Saint-Benoît-des-Ondes Airbnb Market Analysis 2025: Short Term Rental Data & Vacation Rental Statistics in Brittany, France
Is Airbnb profitable in Saint-Benoît-des-Ondes in 2025? Explore comprehensive Airbnb analytics for Saint-Benoît-des-Ondes, Brittany, France to uncover income potential. This 2025 STR market report for Saint-Benoît-des-Ondes, based on AirROI data from April 2024 to March 2025, reveals key trends in the niche market of 24 active listings.
Whether you're considering an Airbnb investment in Saint-Benoît-des-Ondes, optimizing your existing vacation rental, or exploring rental arbitrage opportunities, understanding the Saint-Benoît-des-Ondes Airbnb data is crucial. Leveraging the low regulation environment is key to maximizing your short term rental income potential. Let's dive into the specifics.
Key Saint-Benoît-des-Ondes Airbnb Performance Metrics Overview
Monthly Airbnb Revenue Variations & Income Potential in Saint-Benoît-des-Ondes (2025)
Understanding the monthly revenue variations for Airbnb listings in Saint-Benoît-des-Ondes is key to maximizing your short term rental income potential. Seasonality significantly impacts earnings. Our analysis, based on data from the past 12 months, shows that the peak revenue month for STRs in Saint-Benoît-des-Ondes is typically August, while February often presents the lowest earnings, highlighting opportunities for strategic pricing adjustments during shoulder and low seasons. Explore the typical Airbnb income in Saint-Benoît-des-Ondes across different performance tiers:
- Best-in-class properties (Top 10%) achieve $3,042+ monthly, often utilizing dynamic pricing and superior guest experiences.
- Strong performing properties (Top 25%) earn $2,149 or more, indicating effective management and desirable locations/amenities.
- Typical properties (Median) generate around $1,500 per month, representing the average market performance.
- Entry-level properties (Bottom 25%) see earnings around $864, often with potential for optimization.
Average Monthly Airbnb Earnings Trend in Saint-Benoît-des-Ondes
Saint-Benoît-des-Ondes Airbnb Occupancy Rate Trends (2025)
Maximize your bookings by understanding the Saint-Benoît-des-Ondes STR occupancy trends. Seasonal demand shifts significantly influence how often properties are booked. Typically, Augustsees the highest demand (peak season occupancy), while January experiences the lowest (low season). Effective strategies, like adjusting minimum stays or offering promotions, can boost occupancy during slower periods. Here's how different property tiers perform in Saint-Benoît-des-Ondes:
- Best-in-class properties (Top 10%) achieve 75%+ occupancy, indicating high desirability and potentially optimized availability.
- Strong performing properties (Top 25%) maintain 59% or higher occupancy, suggesting good market fit and guest satisfaction.
- Typical properties (Median) have an occupancy rate around 43%.
- Entry-level properties (Bottom 25%) average 29% occupancy, potentially facing higher vacancy.
Average Monthly Occupancy Rate Trend in Saint-Benoît-des-Ondes
Average Daily Rate (ADR) Airbnb Trends in Saint-Benoît-des-Ondes (2025)
Effective short term rental pricing strategy in Saint-Benoît-des-Ondes involves understanding monthly ADR fluctuations. The Average Daily Rate (ADR) for Airbnb in Saint-Benoît-des-Ondes typically peaks in July and dips lowest during March. Leveraging Airbnb dynamic pricing tools or strategies based on this seasonality can significantly boost revenue. Here's a look at the typical nightly rates achieved:
- Best-in-class properties (Top 10%) command rates of $200+ per night, often due to premium features or locations.
- Strong performing properties (Top 25%) achieve nightly rates of $141 or more.
- Typical properties (Median) charge around $101 per night.
- Entry-level properties (Bottom 25%) earn around $76 per night.
Average Daily Rate (ADR) Trend by Month in Saint-Benoît-des-Ondes
Get Live Saint-Benoît-des-Ondes Market Intelligence 👇

Explore Real-time Analytics
Airbnb Seasonality Analysis & Trends in Saint-Benoît-des-Ondes (2025)
Peak Season (August, July, June)
- Revenue averages $2,727 per month
- Occupancy rates average 66.5%
- Daily rates average $122
Shoulder Season
- Revenue averages $1,490 per month
- Occupancy maintains around 41.1%
- Daily rates hold near $115
Low Season (January, February, March)
- Revenue drops to average $973 per month
- Occupancy decreases to average 28.0%
- Daily rates adjust to average $112
Seasonality Insights for Saint-Benoît-des-Ondes
- The Airbnb seasonality in Saint-Benoît-des-Ondes shows highly seasonal trends requiring careful strategy. While the sections above show seasonal averages, it's also insightful to look at the extremes:
- During the high season, the absolute peak month showcases Saint-Benoît-des-Ondes's highest earning potential, with monthly revenues capable of climbing to $3,357, occupancy reaching a high of 81.5%, and ADRs peaking at $124.
- Conversely, the slowest single month of the year, typically falling within the low season, marks the market's lowest point. In this month, revenue might dip to $890, occupancy could drop to 26.2%, and ADRs may adjust down to $111.
- Understanding both the seasonal averages and these monthly peaks and troughs in revenue, occupancy, and ADR is crucial for maximizing your Airbnb profit potential in Saint-Benoît-des-Ondes.
Seasonal Strategies for Maximizing Profit
- Peak Season: Maximize revenue through premium pricing and potentially longer minimum stays. Ensure high availability.
- Low Season: Offer competitive pricing, special promotions (e.g., extended stay discounts), and flexible cancellation policies. Target off-season travelers like remote workers or budget-conscious guests.
- Shoulder Seasons: Implement dynamic pricing that balances peak and low rates. Target weekend travelers or specific events. Offer slightly more flexible terms than peak season.
- Regularly analyze your own performance against these Saint-Benoît-des-Ondes seasonality benchmarks and adjust your pricing and availability strategy accordingly.
Best Areas for Airbnb Investment in Saint-Benoît-des-Ondes (2025)
Exploring the top neighborhoods for short-term rentals in Saint-Benoît-des-Ondes? This section highlights key areas, outlining why they are attractive for hosts and guests, along with notable local attractions. Consider these locations based on your target guest profile and investment strategy.
| Neighborhood / Area | Why Host Here? (Target Guests & Appeal) | Key Attractions & Landmarks |
|---|---|---|
| Saint-Benoît-des-Ondes Beach | Beautiful coastal area popular with tourists for its sandy beaches and picturesque views. Ideal for attracting beachgoers and families during the summer months. | Plage de Saint-Benoît-des-Ondes, Sentier des Douaniers, Église de Saint-Benoît, Marina de Saint-Benoît-des-Ondes, Les pêcheries |
| Saint-Malo | Nearby historic city known for its walled old town and rich maritime history. A major draw for visitors seeking culture, history, and beautiful coastal scenery. | Intra-Muros, St. Malo Cathedral, Fort National, Grand Bé, Plage de l'Éventail |
| Dinan | Charming medieval town located a short drive away, offers a glimpse into Brittany's rich history and architecture. Popular with tourists exploring the region's heritage. | Dinan Castle, Rue du Jerzual, Eglise Saint-Malo, Les Remparts, Château de Dinan |
| Cancale | Famous for its oysters and stunning coastal views, Cancale attracts food lovers and nature seekers. Excellent for seaside getaways with fresh seafood dining. | Oyster farms, Plage du Verger, Eglise Saint-Méen, Sentier des Douaniers, Maison de la Nature |
| Mont Saint-Michel | Iconic UNESCO World Heritage site located nearby, attracts millions of visitors and provides opportunities for short-term rentals targeting tourists. | Mont Saint-Michel Abbey, La Grande Rue, Le Mouton Blanc, Musee de la Mer, Port de Mont Saint-Michel |
| Combourg | Quaint town known for its beautiful lakes and chateau, offering a serene getaway spot for those looking for a peaceful vacation experience. | Château de Combourg, Lac Tranquille, Église Saint-Sauveur, Promenade du Lac, Jardin des amis |
| Dol-de-Bretagne | Historic town with beautiful architecture and a vibrant cultural scene. Perfect for visitors looking for a blend of history and modern amenities. | Cathédrale Saint-Samson, La Maison de la Baie, Les Halles, Les Remparts de Dol, Circuit de la Baie |
| Fougères | Medieval town famous for its impressive castle and historical buildings, providing an excellent location for heritage tourism. | Château de Fougères, Église Saint-Sulpice, Les Jardins de la Marquise, Les Remparts, Centre historique |
Understanding Airbnb License Requirements & STR Laws in Saint-Benoît-des-Ondes (2025)
While Saint-Benoît-des-Ondes, Brittany, France currently shows low STR regulations, specific Airbnb license requirements might still exist or change. Always verify the latest short term rental regulations and Airbnb license requirements directly with local government authorities for Saint-Benoît-des-Ondes to ensure full compliance before hosting.
(Source: AirROI data, 2025, finding no licensed listings among those analyzed)
Top Performing Airbnb Properties in Saint-Benoît-des-Ondes (2025)
Benchmark your potential! Explore examples of top-performing Airbnb properties in Saint-Benoît-des-Ondesbased on Trailing Twelve Month (TTM) revenue. Analyze their characteristics, revenue, occupancy rate, and ADR to understand what drives success in this market.
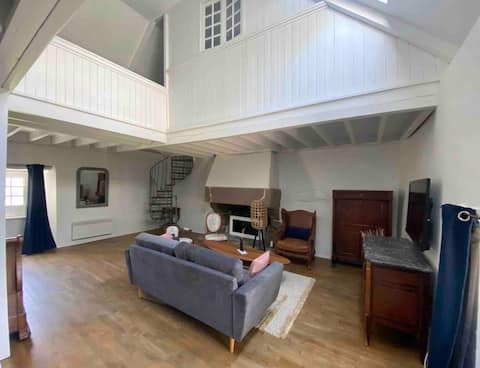
Charming 15th century home 200m from the sea
Entire Place • 2 bedrooms
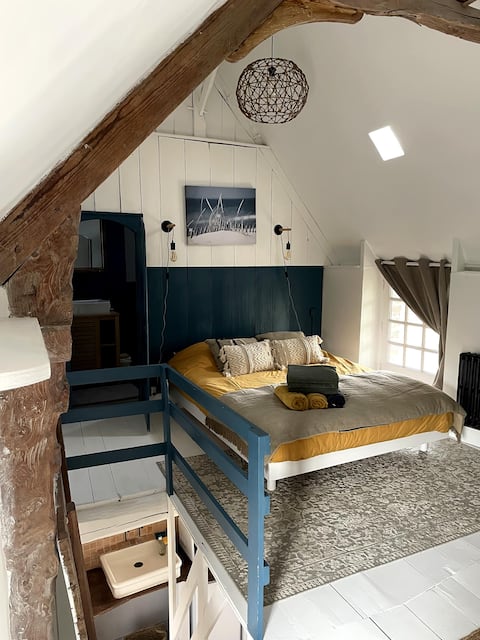
Gîte de Charme en duplex (2p) 200m from the Sea
Entire Place • 1 bedroom
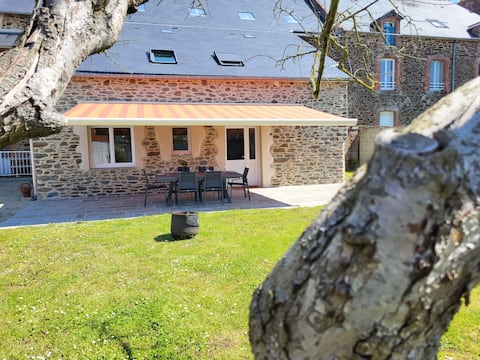
Le Banc des Hermelles
Entire Place • 3 bedrooms
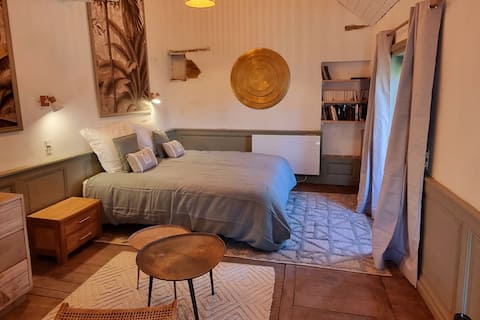
Independent bed and breakfast in Lordship
Private Room • N/A
Charming duplex cottage (4p) 200m from the sea
Entire Place • 1 bedroom
La Croissantine, fisherman's house on the seaside
Entire Place • 3 bedrooms
Note: Performance varies based on location, size, amenities, seasonality, and management quality. Data reflects the past 12 months.
Top Performing Airbnb Hosts in Saint-Benoît-des-Ondes (2025)
Learn from the best! This table showcases top-performing Airbnb hosts in Saint-Benoît-des-Ondes based on the number of properties managed and estimated total revenue over the past year. Analyze their scale and performance metrics.
| Host Name | Properties | Grossing Revenue | Stay Reviews | Avg Rating |
|---|---|---|---|---|
| Jean-Michel | 5 | $146,260 | 97 | 4.97/5.0 |
| Cécile | 5 | $72,626 | 217 | 4.89/5.0 |
| Guillaume | 2 | $41,307 | 170 | 4.95/5.0 |
| Olivier Et Caro | 1 | $23,495 | 209 | 4.89/5.0 |
| Hélène | 1 | $22,052 | 5 | 5.00/5.0 |
| Valérie | 1 | $19,190 | 98 | 4.95/5.0 |
| Corinne | 1 | $19,146 | 319 | 4.81/5.0 |
| Marina | 1 | $12,018 | 103 | 4.97/5.0 |
| Laurence | 1 | $11,575 | 59 | 4.95/5.0 |
| Renan | 1 | $11,049 | 145 | 4.68/5.0 |
Analyzing the strategies of top hosts, such as their property selection, pricing, and guest communication, can offer valuable lessons for optimizing your own Airbnb operations in Saint-Benoît-des-Ondes.
Dive Deeper: Advanced Saint-Benoît-des-Ondes STR Market Data (2025)
Ready to unlock more insights? AirROI provides access to advanced metrics and comprehensive Airbnb data for Saint-Benoît-des-Ondes. Explore detailed analytics beyond this report to refine your investment strategy, optimize pricing, and maximize your vacation rental profits.
Explore Advanced MetricsSaint-Benoît-des-Ondes Short-Term Rental Market Composition (2025): Property & Room Types
Room Type Distribution
Property Type Distribution
Market Composition Insights for Saint-Benoît-des-Ondes
- The Saint-Benoît-des-Ondes Airbnb market composition is heavily skewed towards Entire Home/Apt listings, which make up 87.5% of the 24 active rentals. This indicates strong guest preference for privacy and space.
- Looking at the property type distribution in Saint-Benoît-des-Ondes, House properties are the most common (41.7%), reflecting the local real estate landscape.
- Houses represent a significant 41.7% portion, catering likely to families or larger groups.
- The presence of 16.7% Hotel/Boutique listings indicates integration with traditional hospitality.
Saint-Benoît-des-Ondes Airbnb Room Capacity Analysis (2025): Bedroom Distribution
Distribution of Listings by Number of Bedrooms
Room Capacity Insights for Saint-Benoît-des-Ondes
- The dominant room capacity in Saint-Benoît-des-Ondes is 1 bedroom listings, making up 45.8% of the market. This suggests a strong demand for properties suitable for couples or solo travelers.
- Together, 1 bedroom and 2 bedrooms properties represent 70.8% of the active Airbnb listings in Saint-Benoît-des-Ondes, indicating a high concentration in these sizes.
Saint-Benoît-des-Ondes Vacation Rental Guest Capacity Trends (2025)
Distribution of Listings by Guest Capacity
Guest Capacity Insights for Saint-Benoît-des-Ondes
- The most common guest capacity trend in Saint-Benoît-des-Ondes vacation rentals is listings accommodating 2 guests (33.3%). This suggests the primary traveler segment is likely couples or solo travelers.
- Properties designed for 2 guests and 4 guests dominate the Saint-Benoît-des-Ondes STR market, accounting for 62.5% of listings.
- 20.9% of properties accommodate 6+ guests, serving the market segment for larger families or group travel in Saint-Benoît-des-Ondes.
- On average, properties in Saint-Benoît-des-Ondes are equipped to host 3.3 guests.
Saint-Benoît-des-Ondes Airbnb Booking Patterns (2025): Available vs. Booked Days
Available Days Distribution
Booked Days Distribution
Booking Pattern Insights for Saint-Benoît-des-Ondes
- The most common availability pattern in Saint-Benoît-des-Ondes falls within the 181-270 days range, representing 58.3% of listings. This suggests many properties have significant open periods on their calendars.
- Approximately 83.3% of listings show high availability (181+ days open annually), indicating potential for increased bookings or specific owner usage patterns.
- For booked days, the 91-180 days range is most frequent in Saint-Benoît-des-Ondes (54.2%), reflecting common guest stay durations or potential owner blocking patterns.
- A notable 20.8% of properties secure long booking periods (181+ days booked per year), highlighting successful long-term rental strategies or significant owner usage.
Saint-Benoît-des-Ondes Airbnb Minimum Stay Requirements Analysis
Distribution of Listings by Minimum Night Requirement
1 Night
7 listings
29.2% of total
2 Nights
11 listings
45.8% of total
3 Nights
1 listings
4.2% of total
4-6 Nights
2 listings
8.3% of total
30+ Nights
3 listings
12.5% of total
Key Insights
- The most prevalent minimum stay requirement in Saint-Benoît-des-Ondes is 2 Nights, adopted by 45.8% of listings. This highlights the market's preference for shorter, flexible bookings.
- A strong majority (75.0%) of the Saint-Benoît-des-Ondes Airbnb data shows acceptance of very short stays (1-2 nights), indicating a dynamic, high-turnover market.
- A significant segment (12.5%) caters to monthly stays (30+ nights) in Saint-Benoît-des-Ondes, pointing to opportunities in the extended-stay market.
Recommendations
- Align with the market by considering a 2 Nights minimum stay, as 45.8% of Saint-Benoît-des-Ondes hosts use this setting.
- If feasible, allowing 1-night stays, especially midweek or during low season, could capture last-minute bookings, as only 29.2% currently do.
- Explore offering discounts for stays of 30+ nights to attract the 12.5% of the market seeking extended stays.
- Adjust minimum nights based on seasonality – potentially shorter during low season and longer during peak demand periods in Saint-Benoît-des-Ondes.
Saint-Benoît-des-Ondes Airbnb Cancellation Policy Trends Analysis (2025)
Flexible
5 listings
20.8% of total
Moderate
13 listings
54.2% of total
Firm
4 listings
16.7% of total
Strict
2 listings
8.3% of total
Cancellation Policy Insights for Saint-Benoît-des-Ondes
- The prevailing Airbnb cancellation policy trend in Saint-Benoît-des-Ondes is Moderate, used by 54.2% of listings.
- The market strongly favors guest-friendly terms, with 75.0% of listings offering Flexible or Moderate policies. This suggests guests in Saint-Benoît-des-Ondes may expect booking flexibility.
- Strict cancellation policies are quite rare (8.3%), potentially making listings with this policy less competitive unless justified by high demand or property type.
Recommendations for Hosts
- Consider adopting a Moderate policy to align with the 54.2% market standard in Saint-Benoît-des-Ondes.
- Using a Strict policy might deter some guests, as only 8.3% of listings use it. Evaluate if potential revenue protection outweighs possible lower booking rates.
- Regularly review your cancellation policy against competitors and market demand shifts in Saint-Benoît-des-Ondes.
Saint-Benoît-des-Ondes STR Booking Lead Time Analysis (2025)
Average Booking Lead Time by Month
Booking Lead Time Insights for Saint-Benoît-des-Ondes
- The overall average booking lead time for vacation rentals in Saint-Benoît-des-Ondes is 69 days.
- Guests book furthest in advance for stays during July (average 142 days), likely coinciding with peak travel demand or local events.
- The shortest booking windows occur for stays in February (average 39 days), indicating more last-minute travel plans during this time.
- Seasonally, Summer (114 days avg.) sees the longest lead times, while Winter (54 days avg.) has the shortest, reflecting typical travel planning cycles.
Recommendations for Hosts
- Use the overall average lead time (69 days) as a baseline for your pricing and availability strategy in Saint-Benoît-des-Ondes.
- For July stays, consider implementing length-of-stay discounts or slightly higher rates for bookings made less than 142 days out to capitalize on advance planning.
- Target marketing efforts for the Summer season well in advance (at least 114 days) to capture early planners.
- Monitor your own booking lead times against these Saint-Benoît-des-Ondes averages to identify opportunities for dynamic pricing adjustments.
Popular & Essential Airbnb Amenities in Saint-Benoît-des-Ondes (2025)
Amenity Prevalence
Amenity Insights for Saint-Benoît-des-Ondes
- Essential amenities in Saint-Benoît-des-Ondes that guests expect include: Heating. Lacking these (this) could significantly impact bookings.
- Popular amenities like Smoke alarm, Dishes and silverware, TV are common but not universal. Offering these can provide a competitive edge.
- Warning: Wifi is not universally provided but is considered essential globally. Ensure reliable Wifi is offered.
Recommendations for Hosts
- Ensure your listing includes all essential amenities for Saint-Benoît-des-Ondes: Heating.
- Consider adding popular differentiators like Smoke alarm or Dishes and silverware to increase appeal.
- Highlight unique or less common amenities you offer (e.g., hot tub, dedicated workspace, EV charger) in your listing description and photos.
- Regularly check competitor amenities in Saint-Benoît-des-Ondes to stay competitive.
Saint-Benoît-des-Ondes Airbnb Guest Demographics & Profile Analysis (2025)
Guest Profile Summary for Saint-Benoît-des-Ondes
- The typical guest profile for Airbnb in Saint-Benoît-des-Ondes consists of primarily domestic travelers (83%), often arriving from nearby Paris, typically belonging to the Post-2000s (Gen Z/Alpha) group (50%), primarily speaking French or English.
- Domestic travelers account for 83.0% of guests.
- Key international markets include France (83%) and Germany (5%).
- Top languages spoken are French (37.8%) followed by English (35.7%).
- A significant demographic segment is the Post-2000s (Gen Z/Alpha) group, representing 50% of guests.
Recommendations for Hosts
- Target domestic marketing efforts towards travelers from Paris and Rennes.
- Tailor amenities and listing descriptions to appeal to the dominant Post-2000s (Gen Z/Alpha) demographic (e.g., highlight fast WiFi, smart home features, local guides).
- Highlight unique local experiences or amenities relevant to the primary guest profile.
- Consider seasonal promotions aligned with peak travel times for key origin markets.
Nearby Short-Term Rental Market Comparison
How does the Saint-Benoît-des-Ondes Airbnb market stack up against its neighbors? Compare key performance metrics like average monthly revenue, ADR, and occupancy rates in surrounding areas to understand the broader regional STR landscape.
| Market | Active Properties | Monthly Revenue | Daily Rate | Avg. Occupancy |
|---|---|---|---|---|
| St Martin | 14 | $4,074 | $436.70 | 51% |
| Moulins-le-Carbonnel | 11 | $3,213 | $320.85 | 35% |
| Gonneville-en-Auge | 12 | $3,061 | $235.90 | 40% |
| Vallon-sur-Gée | 11 | $2,913 | $379.01 | 30% |
| Saint Lawrence | 11 | $2,911 | $317.86 | 52% |
| Auberville | 22 | $2,777 | $249.63 | 36% |
| St Ouen | 15 | $2,635 | $339.51 | 51% |
| Chambellay | 11 | $2,525 | $255.24 | 34% |
| St Clement | 14 | $2,522 | $219.76 | 51% |
| Grouville | 21 | $2,510 | $218.40 | 52% |