Rochefort-en-Terre Airbnb Market Analysis 2025: Short Term Rental Data & Vacation Rental Statistics in Brittany, France
Is Airbnb profitable in Rochefort-en-Terre in 2025? Explore comprehensive Airbnb analytics for Rochefort-en-Terre, Brittany, France to uncover income potential. This 2025 STR market report for Rochefort-en-Terre, based on AirROI data from April 2024 to March 2025, reveals key trends in the niche market of 17 active listings.
Whether you're considering an Airbnb investment in Rochefort-en-Terre, optimizing your existing vacation rental, or exploring rental arbitrage opportunities, understanding the Rochefort-en-Terre Airbnb data is crucial. Leveraging the low regulation environment is key to maximizing your short term rental income potential. Let's dive into the specifics.
Key Rochefort-en-Terre Airbnb Performance Metrics Overview
Monthly Airbnb Revenue Variations & Income Potential in Rochefort-en-Terre (2025)
Understanding the monthly revenue variations for Airbnb listings in Rochefort-en-Terre is key to maximizing your short term rental income potential. Seasonality significantly impacts earnings. Our analysis, based on data from the past 12 months, shows that the peak revenue month for STRs in Rochefort-en-Terre is typically December, while February often presents the lowest earnings, highlighting opportunities for strategic pricing adjustments during shoulder and low seasons. Explore the typical Airbnb income in Rochefort-en-Terre across different performance tiers:
- Best-in-class properties (Top 10%) achieve $2,610+ monthly, often utilizing dynamic pricing and superior guest experiences.
- Strong performing properties (Top 25%) earn $1,984 or more, indicating effective management and desirable locations/amenities.
- Typical properties (Median) generate around $1,351 per month, representing the average market performance.
- Entry-level properties (Bottom 25%) see earnings around $931, often with potential for optimization.
Average Monthly Airbnb Earnings Trend in Rochefort-en-Terre
Rochefort-en-Terre Airbnb Occupancy Rate Trends (2025)
Maximize your bookings by understanding the Rochefort-en-Terre STR occupancy trends. Seasonal demand shifts significantly influence how often properties are booked. Typically, Decembersees the highest demand (peak season occupancy), while April experiences the lowest (low season). Effective strategies, like adjusting minimum stays or offering promotions, can boost occupancy during slower periods. Here's how different property tiers perform in Rochefort-en-Terre:
- Best-in-class properties (Top 10%) achieve 77%+ occupancy, indicating high desirability and potentially optimized availability.
- Strong performing properties (Top 25%) maintain 66% or higher occupancy, suggesting good market fit and guest satisfaction.
- Typical properties (Median) have an occupancy rate around 48%.
- Entry-level properties (Bottom 25%) average 34% occupancy, potentially facing higher vacancy.
Average Monthly Occupancy Rate Trend in Rochefort-en-Terre
Average Daily Rate (ADR) Airbnb Trends in Rochefort-en-Terre (2025)
Effective short term rental pricing strategy in Rochefort-en-Terre involves understanding monthly ADR fluctuations. The Average Daily Rate (ADR) for Airbnb in Rochefort-en-Terre typically peaks in July and dips lowest during February. Leveraging Airbnb dynamic pricing tools or strategies based on this seasonality can significantly boost revenue. Here's a look at the typical nightly rates achieved:
- Best-in-class properties (Top 10%) command rates of $632+ per night, often due to premium features or locations.
- Strong performing properties (Top 25%) achieve nightly rates of $119 or more.
- Typical properties (Median) charge around $90 per night.
- Entry-level properties (Bottom 25%) earn around $68 per night.
Average Daily Rate (ADR) Trend by Month in Rochefort-en-Terre
Get Live Rochefort-en-Terre Market Intelligence 👇

Explore Real-time Analytics
Airbnb Seasonality Analysis & Trends in Rochefort-en-Terre (2025)
Peak Season (December, August, July)
- Revenue averages $2,147 per month
- Occupancy rates average 73.4%
- Daily rates average $157
Shoulder Season
- Revenue averages $1,484 per month
- Occupancy maintains around 44.8%
- Daily rates hold near $171
Low Season (February, March, November)
- Revenue drops to average $966 per month
- Occupancy decreases to average 36.4%
- Daily rates adjust to average $86
Seasonality Insights for Rochefort-en-Terre
- The Airbnb seasonality in Rochefort-en-Terre shows highly seasonal trends requiring careful strategy. While the sections above show seasonal averages, it's also insightful to look at the extremes:
- During the high season, the absolute peak month showcases Rochefort-en-Terre's highest earning potential, with monthly revenues capable of climbing to $2,369, occupancy reaching a high of 77.1%, and ADRs peaking at $191.
- Conversely, the slowest single month of the year, typically falling within the low season, marks the market's lowest point. In this month, revenue might dip to $833, occupancy could drop to 31.4%, and ADRs may adjust down to $84.
- Understanding both the seasonal averages and these monthly peaks and troughs in revenue, occupancy, and ADR is crucial for maximizing your Airbnb profit potential in Rochefort-en-Terre.
Seasonal Strategies for Maximizing Profit
- Peak Season: Maximize revenue through premium pricing and potentially longer minimum stays. Ensure high availability.
- Low Season: Offer competitive pricing, special promotions (e.g., extended stay discounts), and flexible cancellation policies. Target off-season travelers like remote workers or budget-conscious guests.
- Shoulder Seasons: Implement dynamic pricing that balances peak and low rates. Target weekend travelers or specific events. Offer slightly more flexible terms than peak season.
- Regularly analyze your own performance against these Rochefort-en-Terre seasonality benchmarks and adjust your pricing and availability strategy accordingly.
Best Areas for Airbnb Investment in Rochefort-en-Terre (2025)
Exploring the top neighborhoods for short-term rentals in Rochefort-en-Terre? This section highlights key areas, outlining why they are attractive for hosts and guests, along with notable local attractions. Consider these locations based on your target guest profile and investment strategy.
| Neighborhood / Area | Why Host Here? (Target Guests & Appeal) | Key Attractions & Landmarks |
|---|---|---|
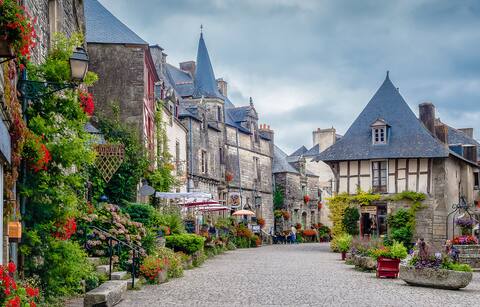
| Historic Center | Rochefort-en-Terre is known for its medieval architecture and charming streets. The historic center attracts visitors looking to explore the town's rich history and beautiful scenery. | The Church of Saint-Jean-Baptiste, The Castle of Rochefort-en-Terre, The Artisan Shops, The Gardens of the Castle, Local Festivals |
| Parc de Kerjula | This area features beautiful parks and green spaces, perfect for families and nature lovers. It is popular for leisure activities and outdoor relaxation, attracting those looking for a peaceful stay. | Parc de Kerjula Gardens, Walking Trails, Picnic Areas, Playgrounds |
| Riverside | The riverside offers picturesque views and serene landscapes, making it ideal for travelers seeking tranquility and natural beauty. It appeals to those who enjoy outdoor activities such as hiking and cycling. | The River Blavet, Cycling Paths, Nature Walks, Fishing Spots |
| Artisan District | This district is home to various artisan workshops and studios, drawing craft enthusiasts and those interested in local art and culture. It supports the local economy and offers unique shopping experiences. | Local Artisans' Workshops, Craft Markets, Art Exhibitions, Cafés and Bistros |
| Nearby Beaches | Proximity to stunning beaches makes Rochefort-en-Terre an attractive option for visitors looking to combine town and beach experiences. It is great for summer vacations and family trips. | La Baule Beach, Carnac Beach, Morgat Beach, Beachfront Dining |
| Cultural Events | Rochefort-en-Terre hosts various cultural events throughout the year, making it lively and appealing for visitors interested in local culture and traditions. | Annual Festivals, Local Concerts, Cultural Workshops, Art Fairs |
| Local Cuisine | The food scene in Rochefort-en-Terre is vibrant, with traditional Brittany cuisine drawing gastronomes and food lovers. Popular for its crêperies and seafood restaurants. | Crêperies, Bistros, Local Markets, Culinary Festivals |
| Proximity to Golfe du Morbihan | Being close to the beautiful Golfe du Morbihan attracts visitors looking for stunning coastal landscapes and activities such as sailing and island hopping. | Island Tours, Scenic Boat Rides, Coastal Walks, Nature Reserves |
Understanding Airbnb License Requirements & STR Laws in Rochefort-en-Terre (2025)
While Rochefort-en-Terre, Brittany, France currently shows low STR regulations, specific Airbnb license requirements might still exist or change. Always verify the latest short term rental regulations and Airbnb license requirements directly with local government authorities for Rochefort-en-Terre to ensure full compliance before hosting.
(Source: AirROI data, 2025, based on 6% licensed listings)
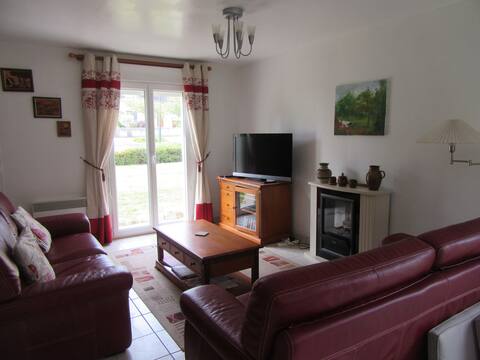
Top Performing Airbnb Properties in Rochefort-en-Terre (2025)
Benchmark your potential! Explore examples of top-performing Airbnb properties in Rochefort-en-Terrebased on Trailing Twelve Month (TTM) revenue. Analyze their characteristics, revenue, occupancy rate, and ADR to understand what drives success in this market.
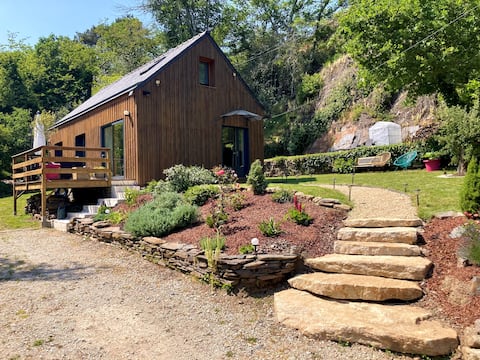
#Cottage in a green setting in a medieval village
Entire Place • 2 bedrooms
Brita Cottage in beautiful Rochefort en Terre
Entire Place • 4 bedrooms
Bed & Breakfast à Rochefort-en-Terre
Private Room • N/A
Room for rent
Private Room • N/A
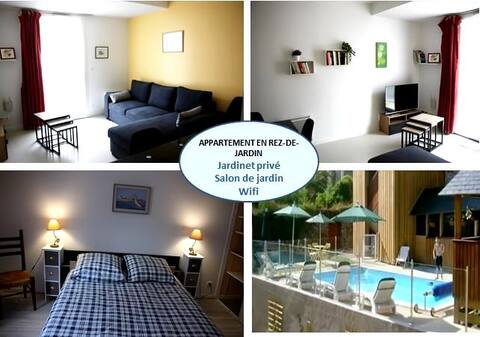
Residence with pool Apartment and its terrace
Entire Place • 1 bedroom
Cottage pottery with breakfast 6 people
Entire Place • 3 bedrooms
Note: Performance varies based on location, size, amenities, seasonality, and management quality. Data reflects the past 12 months.
Top Performing Airbnb Hosts in Rochefort-en-Terre (2025)
Learn from the best! This table showcases top-performing Airbnb hosts in Rochefort-en-Terre based on the number of properties managed and estimated total revenue over the past year. Analyze their scale and performance metrics.
| Host Name | Properties | Grossing Revenue | Stay Reviews | Avg Rating |
|---|---|---|---|---|
| Marie | 1 | $30,348 | 68 | 4.97/5.0 |
| Nicolas | 2 | $28,700 | 270 | 4.88/5.0 |
| William | 1 | $27,596 | 8 | 4.75/5.0 |
| Elisabeth & Vincent | 1 | $23,591 | 214 | 4.98/5.0 |
| Catherine | 1 | $19,506 | 60 | 4.95/5.0 |
| Etienne | 1 | $18,714 | 45 | 4.84/5.0 |
| Bara | 1 | $17,078 | 288 | 4.94/5.0 |
| Isabell | 1 | $15,784 | 18 | 4.72/5.0 |
| David | 1 | $15,651 | 199 | 4.99/5.0 |
| Samia | 1 | $9,004 | 92 | 4.70/5.0 |
Analyzing the strategies of top hosts, such as their property selection, pricing, and guest communication, can offer valuable lessons for optimizing your own Airbnb operations in Rochefort-en-Terre.
Dive Deeper: Advanced Rochefort-en-Terre STR Market Data (2025)
Ready to unlock more insights? AirROI provides access to advanced metrics and comprehensive Airbnb data for Rochefort-en-Terre. Explore detailed analytics beyond this report to refine your investment strategy, optimize pricing, and maximize your vacation rental profits.
Explore Advanced MetricsRochefort-en-Terre Short-Term Rental Market Composition (2025): Property & Room Types
Room Type Distribution
Property Type Distribution
Market Composition Insights for Rochefort-en-Terre
- The Rochefort-en-Terre Airbnb market composition is heavily skewed towards Entire Home/Apt listings, which make up 88.2% of the 17 active rentals. This indicates strong guest preference for privacy and space.
- Looking at the property type distribution in Rochefort-en-Terre, House properties are the most common (47.1%), reflecting the local real estate landscape.
- Houses represent a significant 47.1% portion, catering likely to families or larger groups.
- The presence of 5.9% Hotel/Boutique listings indicates integration with traditional hospitality.
Rochefort-en-Terre Airbnb Room Capacity Analysis (2025): Bedroom Distribution
Distribution of Listings by Number of Bedrooms
Room Capacity Insights for Rochefort-en-Terre
- The dominant room capacity in Rochefort-en-Terre is 1 bedroom listings, making up 47.1% of the market. This suggests a strong demand for properties suitable for couples or solo travelers.
- Together, 1 bedroom and 3 bedrooms properties represent 58.9% of the active Airbnb listings in Rochefort-en-Terre, indicating a high concentration in these sizes.
- A significant 23.6% of listings offer 3+ bedrooms, catering to larger groups and families seeking more space in Rochefort-en-Terre.
Rochefort-en-Terre Vacation Rental Guest Capacity Trends (2025)
Distribution of Listings by Guest Capacity
Guest Capacity Insights for Rochefort-en-Terre
- The most common guest capacity trend in Rochefort-en-Terre vacation rentals is listings accommodating 4 guests (29.4%). This suggests the primary traveler segment is likely small families or groups.
- Properties designed for 4 guests and 2 guests dominate the Rochefort-en-Terre STR market, accounting for 47.0% of listings.
- 23.6% of properties accommodate 6+ guests, serving the market segment for larger families or group travel in Rochefort-en-Terre.
- On average, properties in Rochefort-en-Terre are equipped to host 3.8 guests.
Rochefort-en-Terre Airbnb Booking Patterns (2025): Available vs. Booked Days
Available Days Distribution
Booked Days Distribution
Booking Pattern Insights for Rochefort-en-Terre
- The most common availability pattern in Rochefort-en-Terre falls within the 271-366 days range, representing 35.3% of listings. This suggests many properties have significant open periods on their calendars.
- Approximately 64.7% of listings show high availability (181+ days open annually), indicating potential for increased bookings or specific owner usage patterns.
- For booked days, the 91-180 days range is most frequent in Rochefort-en-Terre (35.3%), reflecting common guest stay durations or potential owner blocking patterns.
- A notable 35.3% of properties secure long booking periods (181+ days booked per year), highlighting successful long-term rental strategies or significant owner usage.
Rochefort-en-Terre Airbnb Minimum Stay Requirements Analysis
Distribution of Listings by Minimum Night Requirement
1 Night
5 listings
33.3% of total
2 Nights
2 listings
13.3% of total
3 Nights
1 listings
6.7% of total
4-6 Nights
2 listings
13.3% of total
7-29 Nights
1 listings
6.7% of total
30+ Nights
4 listings
26.7% of total
Key Insights
- The most prevalent minimum stay requirement in Rochefort-en-Terre is 1 Night, adopted by 33.3% of listings. This highlights the market's preference for shorter, flexible bookings.
- A significant segment (26.7%) caters to monthly stays (30+ nights) in Rochefort-en-Terre, pointing to opportunities in the extended-stay market.
Recommendations
- Align with the market by considering a 1 Night minimum stay, as 33.3% of Rochefort-en-Terre hosts use this setting.
- Explore offering discounts for stays of 30+ nights to attract the 26.7% of the market seeking extended stays.
- Adjust minimum nights based on seasonality – potentially shorter during low season and longer during peak demand periods in Rochefort-en-Terre.
Rochefort-en-Terre Airbnb Cancellation Policy Trends Analysis (2025)
Flexible
2 listings
15.4% of total
Moderate
4 listings
30.8% of total
Firm
5 listings
38.5% of total
Strict
2 listings
15.4% of total
Cancellation Policy Insights for Rochefort-en-Terre
- The prevailing Airbnb cancellation policy trend in Rochefort-en-Terre is Firm, used by 38.5% of listings.
- A majority (53.9%) of hosts in Rochefort-en-Terre utilize Firm or Strict policies, indicating a market where hosts prioritize booking security.
Recommendations for Hosts
- Consider adopting a Firm policy to align with the 38.5% market standard in Rochefort-en-Terre.
- Regularly review your cancellation policy against competitors and market demand shifts in Rochefort-en-Terre.
Rochefort-en-Terre STR Booking Lead Time Analysis (2025)
Average Booking Lead Time by Month
Booking Lead Time Insights for Rochefort-en-Terre
- The overall average booking lead time for vacation rentals in Rochefort-en-Terre is 51 days.
- Guests book furthest in advance for stays during July (average 91 days), likely coinciding with peak travel demand or local events.
- The shortest booking windows occur for stays in February (average 39 days), indicating more last-minute travel plans during this time.
- Seasonally, Summer (76 days avg.) sees the longest lead times, while Winter (60 days avg.) has the shortest, reflecting typical travel planning cycles.
Recommendations for Hosts
- Use the overall average lead time (51 days) as a baseline for your pricing and availability strategy in Rochefort-en-Terre.
- For July stays, consider implementing length-of-stay discounts or slightly higher rates for bookings made less than 91 days out to capitalize on advance planning.
- Target marketing efforts for the Summer season well in advance (at least 76 days) to capture early planners.
- Monitor your own booking lead times against these Rochefort-en-Terre averages to identify opportunities for dynamic pricing adjustments.
Popular & Essential Airbnb Amenities in Rochefort-en-Terre (2025)
Amenity Prevalence
Amenity Insights for Rochefort-en-Terre
- Essential amenities in Rochefort-en-Terre that guests expect include: Heating. Lacking these (this) could significantly impact bookings.
- Popular amenities like Essentials, Hot water, Smoke alarm are common but not universal. Offering these can provide a competitive edge.
- Warning: Wifi is not universally provided but is considered essential globally. Ensure reliable Wifi is offered.
Recommendations for Hosts
- Ensure your listing includes all essential amenities for Rochefort-en-Terre: Heating.
- Consider adding popular differentiators like Essentials or Hot water to increase appeal.
- Highlight unique or less common amenities you offer (e.g., hot tub, dedicated workspace, EV charger) in your listing description and photos.
- Regularly check competitor amenities in Rochefort-en-Terre to stay competitive.
Rochefort-en-Terre Airbnb Guest Demographics & Profile Analysis (2025)
Guest Profile Summary for Rochefort-en-Terre
- The typical guest profile for Airbnb in Rochefort-en-Terre consists of primarily domestic travelers (74%), often arriving from nearby Nantes, typically belonging to the Post-2000s (Gen Z/Alpha) group (50%), primarily speaking French or English.
- Domestic travelers account for 73.9% of guests.
- Key international markets include France (73.9%) and United Kingdom (6%).
- Top languages spoken are French (40.8%) followed by English (37.8%).
- A significant demographic segment is the Post-2000s (Gen Z/Alpha) group, representing 50% of guests.
Recommendations for Hosts
- Target domestic marketing efforts towards travelers from Nantes and Rennes.
- Tailor amenities and listing descriptions to appeal to the dominant Post-2000s (Gen Z/Alpha) demographic (e.g., highlight fast WiFi, smart home features, local guides).
- Highlight unique local experiences or amenities relevant to the primary guest profile.
- Consider seasonal promotions aligned with peak travel times for key origin markets.
Nearby Short-Term Rental Market Comparison
How does the Rochefort-en-Terre Airbnb market stack up against its neighbors? Compare key performance metrics like average monthly revenue, ADR, and occupancy rates in surrounding areas to understand the broader regional STR landscape.
| Market | Active Properties | Monthly Revenue | Daily Rate | Avg. Occupancy |
|---|---|---|---|---|
| Le Bois-Plage-en-Ré | 303 | $2,528 | $284.63 | 45% |
| Sainte-Florence | 10 | $2,445 | $233.78 | 46% |
| La Flotte | 396 | $2,382 | $236.53 | 46% |
| Île-de-Bréhat | 46 | $2,254 | $221.52 | 45% |
| La Couarde-sur-Mer | 218 | $2,188 | $259.23 | 41% |
| Le Parc | 13 | $2,138 | $173.31 | 43% |
| Ombrée d'Anjou | 21 | $2,063 | $213.63 | 35% |
| Lanmodez | 19 | $2,050 | $219.93 | 42% |
| Île-aux-Moines | 98 | $2,048 | $236.18 | 42% |
| Laillé | 12 | $2,046 | $116.65 | 37% |