Rennes Airbnb Market Analysis 2025: Short Term Rental Data & Vacation Rental Statistics in Brittany, France
Is Airbnb profitable in Rennes in 2025? Explore comprehensive Airbnb analytics for Rennes, Brittany, France to uncover income potential. This 2025 STR market report for Rennes, based on AirROI data from April 2024 to March 2025, reveals key trends in the bustling market of 1,456 active listings.
Whether you're considering an Airbnb investment in Rennes, optimizing your existing vacation rental, or exploring rental arbitrage opportunities, understanding the Rennes Airbnb data is crucial. Navigating the high regulation landscape is key to maximizing your short term rental income potential. Let's dive into the specifics.
Key Rennes Airbnb Performance Metrics Overview
Monthly Airbnb Revenue Variations & Income Potential in Rennes (2025)
Understanding the monthly revenue variations for Airbnb listings in Rennes is key to maximizing your short term rental income potential. Seasonality significantly impacts earnings. Our analysis, based on data from the past 12 months, shows that the peak revenue month for STRs in Rennes is typically May, while February often presents the lowest earnings, highlighting opportunities for strategic pricing adjustments during shoulder and low seasons. Explore the typical Airbnb income in Rennes across different performance tiers:
- Best-in-class properties (Top 10%) achieve $2,578+ monthly, often utilizing dynamic pricing and superior guest experiences.
- Strong performing properties (Top 25%) earn $1,777 or more, indicating effective management and desirable locations/amenities.
- Typical properties (Median) generate around $1,171 per month, representing the average market performance.
- Entry-level properties (Bottom 25%) see earnings around $670, often with potential for optimization.
Average Monthly Airbnb Earnings Trend in Rennes
Rennes Airbnb Occupancy Rate Trends (2025)
Maximize your bookings by understanding the Rennes STR occupancy trends. Seasonal demand shifts significantly influence how often properties are booked. Typically, Septembersees the highest demand (peak season occupancy), while March experiences the lowest (low season). Effective strategies, like adjusting minimum stays or offering promotions, can boost occupancy during slower periods. Here's how different property tiers perform in Rennes:
- Best-in-class properties (Top 10%) achieve 86%+ occupancy, indicating high desirability and potentially optimized availability.
- Strong performing properties (Top 25%) maintain 73% or higher occupancy, suggesting good market fit and guest satisfaction.
- Typical properties (Median) have an occupancy rate around 53%.
- Entry-level properties (Bottom 25%) average 29% occupancy, potentially facing higher vacancy.
Average Monthly Occupancy Rate Trend in Rennes
Average Daily Rate (ADR) Airbnb Trends in Rennes (2025)
Effective short term rental pricing strategy in Rennes involves understanding monthly ADR fluctuations. The Average Daily Rate (ADR) for Airbnb in Rennes typically peaks in December and dips lowest during April. Leveraging Airbnb dynamic pricing tools or strategies based on this seasonality can significantly boost revenue. Here's a look at the typical nightly rates achieved:
- Best-in-class properties (Top 10%) command rates of $129+ per night, often due to premium features or locations.
- Strong performing properties (Top 25%) achieve nightly rates of $93 or more.
- Typical properties (Median) charge around $66 per night.
- Entry-level properties (Bottom 25%) earn around $47 per night.
Average Daily Rate (ADR) Trend by Month in Rennes
Get Live Rennes Market Intelligence 👇
Explore Real-time Analytics
Airbnb Seasonality Analysis & Trends in Rennes (2025)
Peak Season (May, June, April)
- Revenue averages $1,621 per month
- Occupancy rates average 49.6%
- Daily rates average $75
Shoulder Season
- Revenue averages $1,380 per month
- Occupancy maintains around 54.0%
- Daily rates hold near $77
Low Season (January, February, March)
- Revenue drops to average $1,104 per month
- Occupancy decreases to average 46.9%
- Daily rates adjust to average $79
Seasonality Insights for Rennes
- The Airbnb seasonality in Rennes shows moderate seasonality with distinct peak and low periods. While the sections above show seasonal averages, it's also insightful to look at the extremes:
- During the high season, the absolute peak month showcases Rennes's highest earning potential, with monthly revenues capable of climbing to $1,646, occupancy reaching a high of 59.0%, and ADRs peaking at $82.
- Conversely, the slowest single month of the year, typically falling within the low season, marks the market's lowest point. In this month, revenue might dip to $1,009, occupancy could drop to 46.2%, and ADRs may adjust down to $75.
- Understanding both the seasonal averages and these monthly peaks and troughs in revenue, occupancy, and ADR is crucial for maximizing your Airbnb profit potential in Rennes.
Seasonal Strategies for Maximizing Profit
- Peak Season: Maximize revenue through premium pricing and potentially longer minimum stays. Ensure high availability.
- Low Season: Offer competitive pricing, special promotions (e.g., extended stay discounts), and flexible cancellation policies. Target off-season travelers like remote workers or budget-conscious guests.
- Shoulder Seasons: Implement dynamic pricing that balances peak and low rates. Target weekend travelers or specific events. Offer slightly more flexible terms than peak season.
- Regularly analyze your own performance against these Rennes seasonality benchmarks and adjust your pricing and availability strategy accordingly.
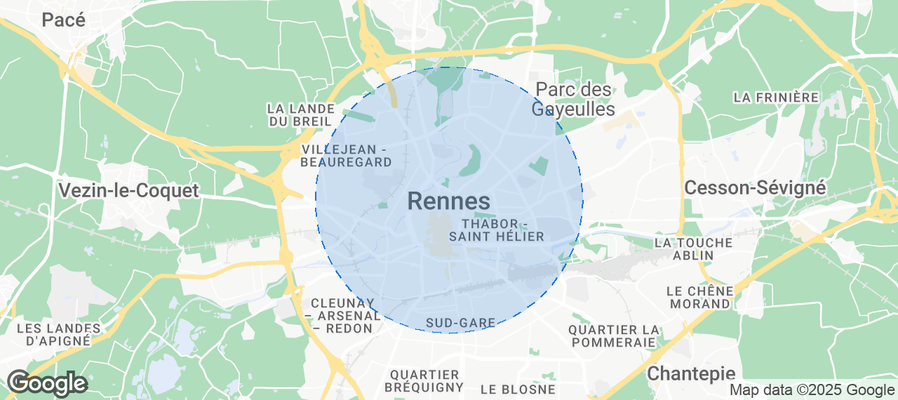
Best Areas for Airbnb Investment in Rennes (2025)
Exploring the top neighborhoods for short-term rentals in Rennes? This section highlights key areas, outlining why they are attractive for hosts and guests, along with notable local attractions. Consider these locations based on your target guest profile and investment strategy.
| Neighborhood / Area | Why Host Here? (Target Guests & Appeal) | Key Attractions & Landmarks |
|---|---|---|
| Centre Historique | The heart of Rennes with beautiful medieval architecture and a vibrant atmosphere. This area attracts tourists looking for culture, history, and local cuisine. | Parlement de Bretagne, Place des Lices, Rennes Cathedral, Les Champs Libres, Théâtre National de Bretagne |
| Thabor | A peaceful neighborhood famous for Parc du Thabor, known for its stunning gardens and close proximity to the city center. Ideal for families and nature lovers. | Parc du Thabor, Rennes Botanical Garden, Rennes Opera House, Historical Museums, Café des Arts |
| La Courrouze | A rapidly developing area with modern amenities and good public transport links to the city. Attractive for young professionals and those looking for new spaces. | Les Ateliers du Vent, Parc des Gayeulles, Shopping centers, Cinemas, Sports facilities |
| Beaulieu | A university district that attracts students and academics, creating a lively atmosphere with cafes and bars. It's ideal for short-term rentals for students. | University of Rennes 1, Bibliothèque de Beaulieu, Café Culturel de Beaulieu, Parc de Beaulieu, Gymnases et installations sportives |
| Saint-Malo | Located nearby, this historic port city draws tourists with its fortified walls and beautiful beaches. Great for Airbnb hosts who cater to beachgoers. | Intra-Muros, Saint-Malo Beach, Fort National, Grand Aquarium, Local Seafood Restaurants |
| Cesson-Sévigné | A suburb of Rennes with a mix of residential and commercial areas. Benefits from good transport links and is appealing for business visitors and families. | Cesson-Sévigné park, Shopping centers, Brocantes and local markets, Cultural events, Nearby nature parks |
| Les Lices | Known for its lively market and nearby restaurants, this neighborhood attracts food lovers and visitors wanting to experience local gastronomy. | Marché des Lices, Gastronomic restaurants, Cooking classes, Bistros, Local food festivals |
| Gare | The area around the train station, known for its connectivity and business environment. Optimally located for travelers and business trips. | Rennes Train Station, Hotel de Ville, Local shops and cafes, Teatro et events, Transportation hubs |
Understanding Airbnb License Requirements & STR Laws in Rennes (2025)
Yes, Rennes, Brittany, France enforces high STR regulations. Obtaining a license and ensuring compliance is almost certainly required according to current 2025 STR laws. Always verify the latest short term rental regulations and Airbnb license requirements directly with local government authorities for Rennes to ensure full compliance before hosting.
(Source: AirROI data, 2025, based on 37% licensed listings)
Top Performing Airbnb Properties in Rennes (2025)
Benchmark your potential! Explore examples of top-performing Airbnb properties in Rennesbased on Trailing Twelve Month (TTM) revenue. Analyze their characteristics, revenue, occupancy rate, and ADR to understand what drives success in this market.
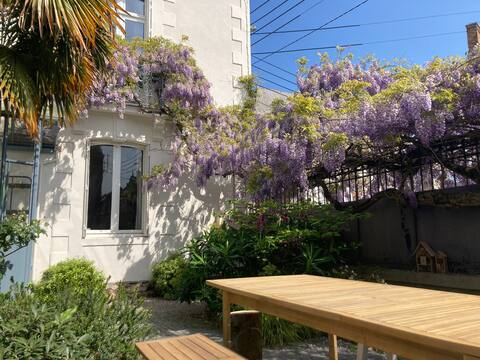
Maison d 'architect centre Rennes - garden parking
Entire Place • 4 bedrooms

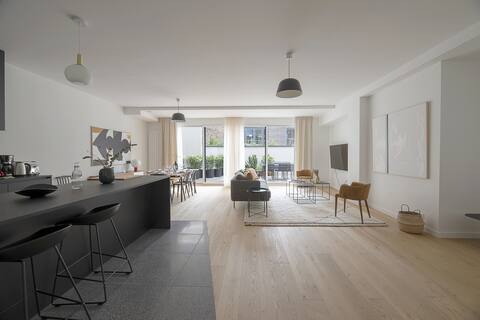
Design terrace apartment - City centre
Entire Place • 4 bedrooms
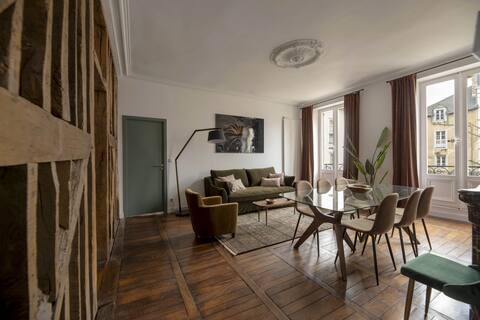
Modern flat with terrace - Hyper-centre
Entire Place • 3 bedrooms
Superb apartment in the historic centre, Rennes
Entire Place • 3 bedrooms

Beautiful house with a pool
Entire Place • 4 bedrooms

Design flat in the heart of Rennes
Entire Place • 3 bedrooms
Note: Performance varies based on location, size, amenities, seasonality, and management quality. Data reflects the past 12 months.
Top Performing Airbnb Hosts in Rennes (2025)
Learn from the best! This table showcases top-performing Airbnb hosts in Rennes based on the number of properties managed and estimated total revenue over the past year. Analyze their scale and performance metrics.
| Host Name | Properties | Grossing Revenue | Stay Reviews | Avg Rating |
|---|---|---|---|---|
| Agence COCOONR / BOOK&PAY | 72 | $1,584,376 | 1805 | 4.61/5.0 |
| Adélaïde & Stéphane, Pénatéa | 27 | $988,607 | 1892 | 4.81/5.0 |
| Agence Cocoonr Rennes | 38 | $639,678 | 1975 | 4.53/5.0 |
| Check In | 29 | $577,975 | 929 | 4.51/5.0 |
| Lucie Et Marie | 25 | $377,588 | 2707 | 4.81/5.0 |
| Grégory Et Pauline | 20 | $324,246 | 1082 | 4.51/5.0 |
| Rennes | 22 | $280,917 | 453 | 4.77/5.0 |
| Sophie | 14 | $250,973 | 1426 | 4.65/5.0 |
| Mélanie | 17 | $249,237 | 1521 | 4.65/5.0 |
| Aurélien | 15 | $199,021 | 4731 | 4.69/5.0 |
Analyzing the strategies of top hosts, such as their property selection, pricing, and guest communication, can offer valuable lessons for optimizing your own Airbnb operations in Rennes.
Dive Deeper: Advanced Rennes STR Market Data (2025)
Ready to unlock more insights? AirROI provides access to advanced metrics and comprehensive Airbnb data for Rennes. Explore detailed analytics beyond this report to refine your investment strategy, optimize pricing, and maximize your vacation rental profits.
Explore Advanced MetricsRennes Short-Term Rental Market Composition (2025): Property & Room Types
Room Type Distribution
Property Type Distribution
Market Composition Insights for Rennes
- The Rennes Airbnb market composition is heavily skewed towards Entire Home/Apt listings, which make up 80.7% of the 1,456 active rentals. This indicates strong guest preference for privacy and space.
- Looking at the property type distribution in Rennes, Apartment/Condo properties are the most common (85.6%), reflecting the local real estate landscape.
- Smaller segments like hotel/boutique, others, outdoor/unique (combined 3.1%) offer potential for unique stay experiences.
Rennes Airbnb Room Capacity Analysis (2025): Bedroom Distribution
Distribution of Listings by Number of Bedrooms
Room Capacity Insights for Rennes
- The dominant room capacity in Rennes is 1 bedroom listings, making up 47.9% of the market. This suggests a strong demand for properties suitable for couples or solo travelers.
- Together, 1 bedroom and 2 bedrooms properties represent 63.1% of the active Airbnb listings in Rennes, indicating a high concentration in these sizes.
- Listings with 3+ bedrooms (9.5%) represent a smaller niche, potentially indicating an underserved market for larger group accommodations in Rennes.
Rennes Vacation Rental Guest Capacity Trends (2025)
Distribution of Listings by Guest Capacity
Guest Capacity Insights for Rennes
- The most common guest capacity trend in Rennes vacation rentals is listings accommodating 2 guests (43.8%). This suggests the primary traveler segment is likely couples or solo travelers.
- Properties designed for 2 guests and 4 guests dominate the Rennes STR market, accounting for 64.7% of listings.
- A significant 47.2% of listings cater specifically to 1-2 guests, highlighting strong demand from couples and solo travelers in Rennes.
- On average, properties in Rennes are equipped to host 2.6 guests.
Rennes Airbnb Booking Patterns (2025): Available vs. Booked Days
Available Days Distribution
Booked Days Distribution
Booking Pattern Insights for Rennes
- The most common availability pattern in Rennes falls within the 181-270 days range, representing 33.2% of listings. This suggests many properties have significant open periods on their calendars.
- Approximately 61.7% of listings show high availability (181+ days open annually), indicating potential for increased bookings or specific owner usage patterns.
- For booked days, the 91-180 days range is most frequent in Rennes (33%), reflecting common guest stay durations or potential owner blocking patterns.
- A notable 39.8% of properties secure long booking periods (181+ days booked per year), highlighting successful long-term rental strategies or significant owner usage.
Rennes Airbnb Minimum Stay Requirements Analysis
Distribution of Listings by Minimum Night Requirement
1 Night
315 listings
24.3% of total
2 Nights
367 listings
28.3% of total
3 Nights
210 listings
16.2% of total
4-6 Nights
64 listings
4.9% of total
7-29 Nights
105 listings
8.1% of total
30+ Nights
236 listings
18.2% of total
Key Insights
- The most prevalent minimum stay requirement in Rennes is 2 Nights, adopted by 28.3% of listings. This highlights the market's preference for shorter, flexible bookings.
- A significant segment (18.2%) caters to monthly stays (30+ nights) in Rennes, pointing to opportunities in the extended-stay market.
Recommendations
- Align with the market by considering a 2 Nights minimum stay, as 28.3% of Rennes hosts use this setting.
- If feasible, allowing 1-night stays, especially midweek or during low season, could capture last-minute bookings, as only 24.3% currently do.
- Explore offering discounts for stays of 30+ nights to attract the 18.2% of the market seeking extended stays.
- Adjust minimum nights based on seasonality – potentially shorter during low season and longer during peak demand periods in Rennes.
Rennes Airbnb Cancellation Policy Trends Analysis (2025)
Super Strict 60 Days
1 listings
0.1% of total
Flexible
400 listings
31.8% of total
Moderate
536 listings
42.6% of total
Firm
139 listings
11% of total
Strict
183 listings
14.5% of total
Cancellation Policy Insights for Rennes
- The prevailing Airbnb cancellation policy trend in Rennes is Moderate, used by 42.6% of listings.
- The market strongly favors guest-friendly terms, with 74.4% of listings offering Flexible or Moderate policies. This suggests guests in Rennes may expect booking flexibility.
Recommendations for Hosts
- Consider adopting a Moderate policy to align with the 42.6% market standard in Rennes.
- Using a Strict policy might deter some guests, as only 14.5% of listings use it. Evaluate if potential revenue protection outweighs possible lower booking rates.
- Regularly review your cancellation policy against competitors and market demand shifts in Rennes.
Rennes STR Booking Lead Time Analysis (2025)
Average Booking Lead Time by Month
Booking Lead Time Insights for Rennes
- The overall average booking lead time for vacation rentals in Rennes is 38 days.
- Guests book furthest in advance for stays during May (average 55 days), likely coinciding with peak travel demand or local events.
- The shortest booking windows occur for stays in February (average 31 days), indicating more last-minute travel plans during this time.
- Seasonally, Spring (47 days avg.) sees the longest lead times, while Winter (35 days avg.) has the shortest, reflecting typical travel planning cycles.
Recommendations for Hosts
- Use the overall average lead time (38 days) as a baseline for your pricing and availability strategy in Rennes.
- For May stays, consider implementing length-of-stay discounts or slightly higher rates for bookings made less than 55 days out to capitalize on advance planning.
- Target marketing efforts for the Spring season well in advance (at least 47 days) to capture early planners.
- Monitor your own booking lead times against these Rennes averages to identify opportunities for dynamic pricing adjustments.
Popular & Essential Airbnb Amenities in Rennes (2025)
Amenity Prevalence
Amenity Insights for Rennes
- Popular amenities like Wifi, Kitchen, Heating are common but not universal. Offering these can provide a competitive edge.
- Warning: Wifi is not universally provided but is considered essential globally. Ensure reliable Wifi is offered.
Recommendations for Hosts
- Consider adding popular differentiators like Wifi or Kitchen to increase appeal.
- Highlight unique or less common amenities you offer (e.g., hot tub, dedicated workspace, EV charger) in your listing description and photos.
- Regularly check competitor amenities in Rennes to stay competitive.
Rennes Airbnb Guest Demographics & Profile Analysis (2025)
Guest Profile Summary for Rennes
- The typical guest profile for Airbnb in Rennes consists of primarily domestic travelers (83%), often arriving from nearby Paris, typically belonging to the Post-2000s (Gen Z/Alpha) group (50%), primarily speaking French or English.
- Domestic travelers account for 83.1% of guests.
- Key international markets include France (83.1%) and United States (1.9%).
- Top languages spoken are French (41.3%) followed by English (34.4%).
- A significant demographic segment is the Post-2000s (Gen Z/Alpha) group, representing 50% of guests.
Recommendations for Hosts
- Target domestic marketing efforts towards travelers from Paris and Rennes.
- Tailor amenities and listing descriptions to appeal to the dominant Post-2000s (Gen Z/Alpha) demographic (e.g., highlight fast WiFi, smart home features, local guides).
- Highlight unique local experiences or amenities relevant to the primary guest profile.
- Consider seasonal promotions aligned with peak travel times for key origin markets.
Nearby Short-Term Rental Market Comparison
How does the Rennes Airbnb market stack up against its neighbors? Compare key performance metrics like average monthly revenue, ADR, and occupancy rates in surrounding areas to understand the broader regional STR landscape.
| Market | Active Properties | Monthly Revenue | Daily Rate | Avg. Occupancy |
|---|---|---|---|---|
| St Martin | 14 | $4,074 | $436.70 | 51% |
| Moulins-le-Carbonnel | 11 | $3,213 | $320.85 | 35% |
| Gonneville-en-Auge | 12 | $3,061 | $235.90 | 40% |
| Vallon-sur-Gée | 11 | $2,913 | $379.01 | 30% |
| Saint Lawrence | 11 | $2,911 | $317.86 | 52% |
| Auberville | 22 | $2,777 | $249.63 | 36% |
| St Ouen | 15 | $2,635 | $339.51 | 51% |
| Chambellay | 11 | $2,525 | $255.24 | 34% |
| St Clement | 14 | $2,522 | $219.76 | 51% |
| Grouville | 21 | $2,510 | $218.40 | 52% |