Redon Airbnb Market Analysis 2025: Short Term Rental Data & Vacation Rental Statistics in Brittany, France
Is Airbnb profitable in Redon in 2025? Explore comprehensive Airbnb analytics for Redon, Brittany, France to uncover income potential. This 2025 STR market report for Redon, based on AirROI data from April 2024 to March 2025, reveals key trends in the niche market of 53 active listings.
Whether you're considering an Airbnb investment in Redon, optimizing your existing vacation rental, or exploring rental arbitrage opportunities, understanding the Redon Airbnb data is crucial. Leveraging the low regulation environment is key to maximizing your short term rental income potential. Let's dive into the specifics.
Key Redon Airbnb Performance Metrics Overview
Monthly Airbnb Revenue Variations & Income Potential in Redon (2025)
Understanding the monthly revenue variations for Airbnb listings in Redon is key to maximizing your short term rental income potential. Seasonality significantly impacts earnings. Our analysis, based on data from the past 12 months, shows that the peak revenue month for STRs in Redon is typically August, while March often presents the lowest earnings, highlighting opportunities for strategic pricing adjustments during shoulder and low seasons. Explore the typical Airbnb income in Redon across different performance tiers:
- Best-in-class properties (Top 10%) achieve $2,148+ monthly, often utilizing dynamic pricing and superior guest experiences.
- Strong performing properties (Top 25%) earn $1,466 or more, indicating effective management and desirable locations/amenities.
- Typical properties (Median) generate around $830 per month, representing the average market performance.
- Entry-level properties (Bottom 25%) see earnings around $441, often with potential for optimization.
Average Monthly Airbnb Earnings Trend in Redon
Redon Airbnb Occupancy Rate Trends (2025)
Maximize your bookings by understanding the Redon STR occupancy trends. Seasonal demand shifts significantly influence how often properties are booked. Typically, Augustsees the highest demand (peak season occupancy), while March experiences the lowest (low season). Effective strategies, like adjusting minimum stays or offering promotions, can boost occupancy during slower periods. Here's how different property tiers perform in Redon:
- Best-in-class properties (Top 10%) achieve 75%+ occupancy, indicating high desirability and potentially optimized availability.
- Strong performing properties (Top 25%) maintain 65% or higher occupancy, suggesting good market fit and guest satisfaction.
- Typical properties (Median) have an occupancy rate around 41%.
- Entry-level properties (Bottom 25%) average 20% occupancy, potentially facing higher vacancy.
Average Monthly Occupancy Rate Trend in Redon
Average Daily Rate (ADR) Airbnb Trends in Redon (2025)
Effective short term rental pricing strategy in Redon involves understanding monthly ADR fluctuations. The Average Daily Rate (ADR) for Airbnb in Redon typically peaks in November and dips lowest during April. Leveraging Airbnb dynamic pricing tools or strategies based on this seasonality can significantly boost revenue. Here's a look at the typical nightly rates achieved:
- Best-in-class properties (Top 10%) command rates of $156+ per night, often due to premium features or locations.
- Strong performing properties (Top 25%) achieve nightly rates of $101 or more.
- Typical properties (Median) charge around $69 per night.
- Entry-level properties (Bottom 25%) earn around $44 per night.
Average Daily Rate (ADR) Trend by Month in Redon
Get Live Redon Market Intelligence 👇

Explore Real-time Analytics
Airbnb Seasonality Analysis & Trends in Redon (2025)
Peak Season (August, July, June)
- Revenue averages $1,655 per month
- Occupancy rates average 51.4%
- Daily rates average $86
Shoulder Season
- Revenue averages $1,112 per month
- Occupancy maintains around 40.6%
- Daily rates hold near $87
Low Season (January, February, March)
- Revenue drops to average $696 per month
- Occupancy decreases to average 36.9%
- Daily rates adjust to average $88
Seasonality Insights for Redon
- The Airbnb seasonality in Redon shows highly seasonal trends requiring careful strategy. While the sections above show seasonal averages, it's also insightful to look at the extremes:
- During the high season, the absolute peak month showcases Redon's highest earning potential, with monthly revenues capable of climbing to $1,758, occupancy reaching a high of 59.9%, and ADRs peaking at $92.
- Conversely, the slowest single month of the year, typically falling within the low season, marks the market's lowest point. In this month, revenue might dip to $619, occupancy could drop to 32.5%, and ADRs may adjust down to $85.
- Understanding both the seasonal averages and these monthly peaks and troughs in revenue, occupancy, and ADR is crucial for maximizing your Airbnb profit potential in Redon.
Seasonal Strategies for Maximizing Profit
- Peak Season: Maximize revenue through premium pricing and potentially longer minimum stays. Ensure high availability.
- Low Season: Offer competitive pricing, special promotions (e.g., extended stay discounts), and flexible cancellation policies. Target off-season travelers like remote workers or budget-conscious guests.
- Shoulder Seasons: Implement dynamic pricing that balances peak and low rates. Target weekend travelers or specific events. Offer slightly more flexible terms than peak season.
- Regularly analyze your own performance against these Redon seasonality benchmarks and adjust your pricing and availability strategy accordingly.
Best Areas for Airbnb Investment in Redon (2025)
Exploring the top neighborhoods for short-term rentals in Redon? This section highlights key areas, outlining why they are attractive for hosts and guests, along with notable local attractions. Consider these locations based on your target guest profile and investment strategy.
| Neighborhood / Area | Why Host Here? (Target Guests & Appeal) | Key Attractions & Landmarks |
|---|---|---|
| Centre-ville de Redon | The town's central area features historical architecture and is close to cafes, shops, and the main train station. Ideal for travelers seeking local experiences and convenience. | Église Saint-Sauveur, Place du Général de Gaulle, Canal de Nantes à Brest, Musée de la Forge, Les Bateaux de l'Ouest |
| Parc de la Roche-Bernard | A beautiful nearby park with scenic views of the Vilaine River, perfect for nature lovers and families looking for outdoor activities. | Vilaine River, Walking trails, Picnic areas, Nature scenery, Local wildlife |
| Le port de Redon | The port area is charming and a point of interest for visitors, with water activities and local eateries that enhance the visitor experience. | Canal locks, Bicycle rentals, Boat tours, Waterfront restaurants, Fishing spots |
| Les sentiers de randonnée | The surrounding hiking trails offer a chance for outdoor enthusiasts to explore the picturesque Brittany countryside, attracting nature lovers and adventurers. | Brittany hiking trails, Scenic views, Wildlife spots, Cycling paths, Nature photography |
| Café de la Paix | A popular local cafe offering authentic French cuisine and a cozy atmosphere, ideal for travelers wanting a taste of local life. | Local cuisine, Outdoor seating, Cultural events, Artisan pastries, Community gatherings |
| Lac de la basse vallée | A serene lake area that offers water sports and leisure activities, making it attractive for families and tourists looking for relaxation. | Swimming, Kayaking, Picnic spots, Fishing, Scenic walks |
| Château de la Villegontier | An interesting historical site that offers a glimpse into the region's past, it attracts history buffs and tourists interested in local heritage. | Historical tours, Guided visits, Gardens, Photography spots, Local history museums |
| Les marchés locaux | Regular local markets provide a vibrant atmosphere where visitors can experience local foods, crafts, and culture, popular among tourists and locals alike. | Fresh produce, Local crafts, Culinary experiences, Cultural performances, Community atmosphere |
Understanding Airbnb License Requirements & STR Laws in Redon (2025)
While Redon, Brittany, France currently shows low STR regulations, specific Airbnb license requirements might still exist or change. Always verify the latest short term rental regulations and Airbnb license requirements directly with local government authorities for Redon to ensure full compliance before hosting.
(Source: AirROI data, 2025, based on 8% licensed listings)
Top Performing Airbnb Properties in Redon (2025)
Benchmark your potential! Explore examples of top-performing Airbnb properties in Redonbased on Trailing Twelve Month (TTM) revenue. Analyze their characteristics, revenue, occupancy rate, and ADR to understand what drives success in this market.

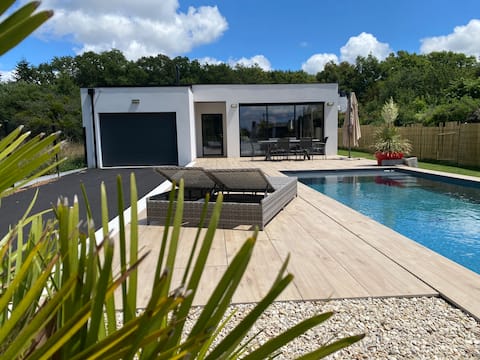
House with pool at the foot of the Bahurel woods.
Entire Place • 4 bedrooms
New house with pool
Entire Place • 3 bedrooms
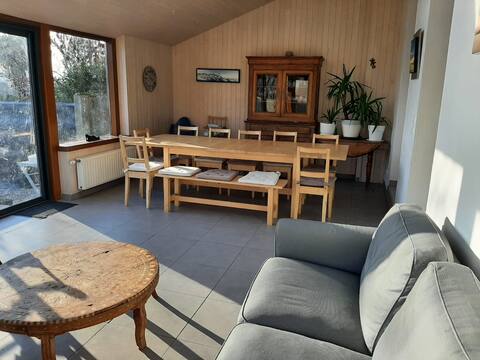
Big Family House " Ty Ar Braz"
Entire Place • 6 bedrooms
Large Apartment 40m2 near port - Wi-Fi broadband
Entire Place • 1 bedroom

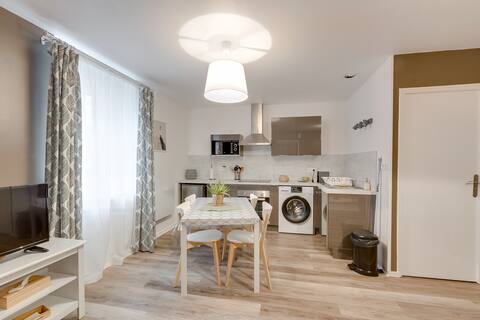
Apartment 30m² + centre + wi-fi + netflix
Entire Place • 1 bedroom

apartment near train station
Entire Place • 1 bedroom
Note: Performance varies based on location, size, amenities, seasonality, and management quality. Data reflects the past 12 months.
Top Performing Airbnb Hosts in Redon (2025)
Learn from the best! This table showcases top-performing Airbnb hosts in Redon based on the number of properties managed and estimated total revenue over the past year. Analyze their scale and performance metrics.
| Host Name | Properties | Grossing Revenue | Stay Reviews | Avg Rating |
|---|---|---|---|---|
| Osemae | 7 | $99,505 | 39 | 3.94/5.0 |
| Benjamin | 1 | $60,279 | 6 | 5.00/5.0 |
| Laura | 3 | $40,300 | 36 | 4.84/5.0 |
| Aude | 1 | $26,133 | 13 | 5.00/5.0 |
| Laetitia | 2 | $23,258 | 16 | 5.00/5.0 |
| Freddy | 1 | $19,386 | 70 | 4.96/5.0 |
| Antoine Et Sandrine | 2 | $18,249 | 488 | 4.86/5.0 |
| Gael | 1 | $17,768 | 138 | 4.84/5.0 |
| Karim | 1 | $15,635 | 66 | 4.73/5.0 |
| Maryleine | 1 | $14,672 | 26 | 4.92/5.0 |
Analyzing the strategies of top hosts, such as their property selection, pricing, and guest communication, can offer valuable lessons for optimizing your own Airbnb operations in Redon.
Dive Deeper: Advanced Redon STR Market Data (2025)
Ready to unlock more insights? AirROI provides access to advanced metrics and comprehensive Airbnb data for Redon. Explore detailed analytics beyond this report to refine your investment strategy, optimize pricing, and maximize your vacation rental profits.
Explore Advanced MetricsRedon Short-Term Rental Market Composition (2025): Property & Room Types
Room Type Distribution
Property Type Distribution
Market Composition Insights for Redon
- The Redon Airbnb market composition is heavily skewed towards Entire Home/Apt listings, which make up 81.1% of the 53 active rentals. This indicates strong guest preference for privacy and space.
- Looking at the property type distribution in Redon, Apartment/Condo properties are the most common (58.5%), reflecting the local real estate landscape.
- Houses represent a significant 35.8% portion, catering likely to families or larger groups.
- Smaller segments like others, hotel/boutique, unique stays (combined 5.7%) offer potential for unique stay experiences.
Redon Airbnb Room Capacity Analysis (2025): Bedroom Distribution
Distribution of Listings by Number of Bedrooms
Room Capacity Insights for Redon
- The dominant room capacity in Redon is 1 bedroom listings, making up 41.5% of the market. This suggests a strong demand for properties suitable for couples or solo travelers.
- Together, 1 bedroom and 2 bedrooms properties represent 66.0% of the active Airbnb listings in Redon, indicating a high concentration in these sizes.
Redon Vacation Rental Guest Capacity Trends (2025)
Distribution of Listings by Guest Capacity
Guest Capacity Insights for Redon
- The most common guest capacity trend in Redon vacation rentals is listings accommodating 4 guests (35.8%). This suggests the primary traveler segment is likely small families or groups.
- Properties designed for 4 guests and 2 guests dominate the Redon STR market, accounting for 54.7% of listings.
- 13.2% of properties accommodate 6+ guests, serving the market segment for larger families or group travel in Redon.
- On average, properties in Redon are equipped to host 3.6 guests.
Redon Airbnb Booking Patterns (2025): Available vs. Booked Days
Available Days Distribution
Booked Days Distribution
Booking Pattern Insights for Redon
- The most common availability pattern in Redon falls within the 271-366 days range, representing 35.8% of listings. This suggests many properties have significant open periods on their calendars.
- Approximately 71.6% of listings show high availability (181+ days open annually), indicating potential for increased bookings or specific owner usage patterns.
- For booked days, the 91-180 days range is most frequent in Redon (35.8%), reflecting common guest stay durations or potential owner blocking patterns.
- A notable 30.2% of properties secure long booking periods (181+ days booked per year), highlighting successful long-term rental strategies or significant owner usage.
Redon Airbnb Minimum Stay Requirements Analysis
Distribution of Listings by Minimum Night Requirement
1 Night
20 listings
40% of total
2 Nights
18 listings
36% of total
3 Nights
6 listings
12% of total
4-6 Nights
5 listings
10% of total
30+ Nights
1 listings
2% of total
Key Insights
- The most prevalent minimum stay requirement in Redon is 1 Night, adopted by 40% of listings. This highlights the market's preference for shorter, flexible bookings.
- A strong majority (76.0%) of the Redon Airbnb data shows acceptance of very short stays (1-2 nights), indicating a dynamic, high-turnover market.
- Dedicated monthly rentals (30+ nights) represent a small niche (2%), possibly an untapped area for hosts.
Recommendations
- Align with the market by considering a 1 Night minimum stay, as 40% of Redon hosts use this setting.
- Adjust minimum nights based on seasonality – potentially shorter during low season and longer during peak demand periods in Redon.
Redon Airbnb Cancellation Policy Trends Analysis (2025)
Super Strict 60 Days
1 listings
2.1% of total
Flexible
21 listings
43.8% of total
Moderate
12 listings
25% of total
Firm
8 listings
16.7% of total
Strict
6 listings
12.5% of total
Cancellation Policy Insights for Redon
- The prevailing Airbnb cancellation policy trend in Redon is Flexible, used by 43.8% of listings.
- There's a relatively balanced mix between guest-friendly (68.8%) and stricter (29.2%) policies, offering choices for different guest needs.
Recommendations for Hosts
- Consider adopting a Flexible policy to align with the 43.8% market standard in Redon.
- Using a Strict policy might deter some guests, as only 12.5% of listings use it. Evaluate if potential revenue protection outweighs possible lower booking rates.
- Regularly review your cancellation policy against competitors and market demand shifts in Redon.
Redon STR Booking Lead Time Analysis (2025)
Average Booking Lead Time by Month
Booking Lead Time Insights for Redon
- The overall average booking lead time for vacation rentals in Redon is 30 days.
- Guests book furthest in advance for stays during June (average 93 days), likely coinciding with peak travel demand or local events.
- The shortest booking windows occur for stays in February (average 19 days), indicating more last-minute travel plans during this time.
- Seasonally, Summer (70 days avg.) sees the longest lead times, while Winter (22 days avg.) has the shortest, reflecting typical travel planning cycles.
Recommendations for Hosts
- Use the overall average lead time (30 days) as a baseline for your pricing and availability strategy in Redon.
- For June stays, consider implementing length-of-stay discounts or slightly higher rates for bookings made less than 93 days out to capitalize on advance planning.
- Target marketing efforts for the Summer season well in advance (at least 70 days) to capture early planners.
- Monitor your own booking lead times against these Redon averages to identify opportunities for dynamic pricing adjustments.
Popular & Essential Airbnb Amenities in Redon (2025)
Amenity Prevalence
Amenity Insights for Redon
- Popular amenities like Heating, Wifi, Kitchen are common but not universal. Offering these can provide a competitive edge.
- Warning: Wifi is not universally provided but is considered essential globally. Ensure reliable Wifi is offered.
Recommendations for Hosts
- Consider adding popular differentiators like Heating or Wifi to increase appeal.
- Highlight unique or less common amenities you offer (e.g., hot tub, dedicated workspace, EV charger) in your listing description and photos.
- Regularly check competitor amenities in Redon to stay competitive.
Redon Airbnb Guest Demographics & Profile Analysis (2025)
Guest Profile Summary for Redon
- The typical guest profile for Airbnb in Redon consists of primarily domestic travelers (89%), often arriving from nearby Paris, typically belonging to the Post-2000s (Gen Z/Alpha) group (50%), primarily speaking French or English.
- Domestic travelers account for 88.9% of guests.
- Key international markets include France (88.9%) and United Kingdom (3.8%).
- Top languages spoken are French (50.6%) followed by English (32.1%).
- A significant demographic segment is the Post-2000s (Gen Z/Alpha) group, representing 50% of guests.
Recommendations for Hosts
- Target domestic marketing efforts towards travelers from Paris and Nantes.
- Tailor amenities and listing descriptions to appeal to the dominant Post-2000s (Gen Z/Alpha) demographic (e.g., highlight fast WiFi, smart home features, local guides).
- Highlight unique local experiences or amenities relevant to the primary guest profile.
- Consider seasonal promotions aligned with peak travel times for key origin markets.
Nearby Short-Term Rental Market Comparison
How does the Redon Airbnb market stack up against its neighbors? Compare key performance metrics like average monthly revenue, ADR, and occupancy rates in surrounding areas to understand the broader regional STR landscape.
| Market | Active Properties | Monthly Revenue | Daily Rate | Avg. Occupancy |
|---|---|---|---|---|
| Le Bois-Plage-en-Ré | 303 | $2,528 | $284.63 | 45% |
| Sainte-Florence | 10 | $2,445 | $233.78 | 46% |
| La Flotte | 396 | $2,382 | $236.53 | 46% |
| Île-de-Bréhat | 46 | $2,254 | $221.52 | 45% |
| La Couarde-sur-Mer | 218 | $2,188 | $259.23 | 41% |
| Le Parc | 13 | $2,138 | $173.31 | 43% |
| Ombrée d'Anjou | 21 | $2,063 | $213.63 | 35% |
| Lanmodez | 19 | $2,050 | $219.93 | 42% |
| Île-aux-Moines | 98 | $2,048 | $236.17 | 42% |
| Laillé | 12 | $2,046 | $116.65 | 37% |