Quiberon Airbnb Market Analysis 2025: Short Term Rental Data & Vacation Rental Statistics in Brittany, France
Is Airbnb profitable in Quiberon in 2025? Explore comprehensive Airbnb analytics for Quiberon, Brittany, France to uncover income potential. This 2025 STR market report for Quiberon, based on AirROI data from April 2024 to March 2025, reveals key trends in the market of 660 active listings.
Whether you're considering an Airbnb investment in Quiberon, optimizing your existing vacation rental, or exploring rental arbitrage opportunities, understanding the Quiberon Airbnb data is crucial. Leveraging the low regulation environment is key to maximizing your short term rental income potential. Let's dive into the specifics.
Key Quiberon Airbnb Performance Metrics Overview
Monthly Airbnb Revenue Variations & Income Potential in Quiberon (2025)
Understanding the monthly revenue variations for Airbnb listings in Quiberon is key to maximizing your short term rental income potential. Seasonality significantly impacts earnings. Our analysis, based on data from the past 12 months, shows that the peak revenue month for STRs in Quiberon is typically August, while March often presents the lowest earnings, highlighting opportunities for strategic pricing adjustments during shoulder and low seasons. Explore the typical Airbnb income in Quiberon across different performance tiers:
- Best-in-class properties (Top 10%) achieve $3,164+ monthly, often utilizing dynamic pricing and superior guest experiences.
- Strong performing properties (Top 25%) earn $2,167 or more, indicating effective management and desirable locations/amenities.
- Typical properties (Median) generate around $1,318 per month, representing the average market performance.
- Entry-level properties (Bottom 25%) see earnings around $730, often with potential for optimization.
Average Monthly Airbnb Earnings Trend in Quiberon
Quiberon Airbnb Occupancy Rate Trends (2025)
Maximize your bookings by understanding the Quiberon STR occupancy trends. Seasonal demand shifts significantly influence how often properties are booked. Typically, Augustsees the highest demand (peak season occupancy), while March experiences the lowest (low season). Effective strategies, like adjusting minimum stays or offering promotions, can boost occupancy during slower periods. Here's how different property tiers perform in Quiberon:
- Best-in-class properties (Top 10%) achieve 76%+ occupancy, indicating high desirability and potentially optimized availability.
- Strong performing properties (Top 25%) maintain 57% or higher occupancy, suggesting good market fit and guest satisfaction.
- Typical properties (Median) have an occupancy rate around 36%.
- Entry-level properties (Bottom 25%) average 20% occupancy, potentially facing higher vacancy.
Average Monthly Occupancy Rate Trend in Quiberon
Average Daily Rate (ADR) Airbnb Trends in Quiberon (2025)
Effective short term rental pricing strategy in Quiberon involves understanding monthly ADR fluctuations. The Average Daily Rate (ADR) for Airbnb in Quiberon typically peaks in July and dips lowest during March. Leveraging Airbnb dynamic pricing tools or strategies based on this seasonality can significantly boost revenue. Here's a look at the typical nightly rates achieved:
- Best-in-class properties (Top 10%) command rates of $214+ per night, often due to premium features or locations.
- Strong performing properties (Top 25%) achieve nightly rates of $142 or more.
- Typical properties (Median) charge around $105 per night.
- Entry-level properties (Bottom 25%) earn around $82 per night.
Average Daily Rate (ADR) Trend by Month in Quiberon
Get Live Quiberon Market Intelligence 👇

Explore Real-time Analytics
Airbnb Seasonality Analysis & Trends in Quiberon (2025)
Peak Season (August, July, June)
- Revenue averages $2,852 per month
- Occupancy rates average 58.5%
- Daily rates average $143
Shoulder Season
- Revenue averages $1,491 per month
- Occupancy maintains around 35.9%
- Daily rates hold near $129
Low Season (January, February, March)
- Revenue drops to average $872 per month
- Occupancy decreases to average 27.4%
- Daily rates adjust to average $123
Seasonality Insights for Quiberon
- The Airbnb seasonality in Quiberon shows highly seasonal trends requiring careful strategy. While the sections above show seasonal averages, it's also insightful to look at the extremes:
- During the high season, the absolute peak month showcases Quiberon's highest earning potential, with monthly revenues capable of climbing to $3,591, occupancy reaching a high of 75.2%, and ADRs peaking at $148.
- Conversely, the slowest single month of the year, typically falling within the low season, marks the market's lowest point. In this month, revenue might dip to $750, occupancy could drop to 25.0%, and ADRs may adjust down to $121.
- Understanding both the seasonal averages and these monthly peaks and troughs in revenue, occupancy, and ADR is crucial for maximizing your Airbnb profit potential in Quiberon.
Seasonal Strategies for Maximizing Profit
- Peak Season: Maximize revenue through premium pricing and potentially longer minimum stays. Ensure high availability.
- Low Season: Offer competitive pricing, special promotions (e.g., extended stay discounts), and flexible cancellation policies. Target off-season travelers like remote workers or budget-conscious guests.
- Shoulder Seasons: Implement dynamic pricing that balances peak and low rates. Target weekend travelers or specific events. Offer slightly more flexible terms than peak season.
- Regularly analyze your own performance against these Quiberon seasonality benchmarks and adjust your pricing and availability strategy accordingly.
Best Areas for Airbnb Investment in Quiberon (2025)
Exploring the top neighborhoods for short-term rentals in Quiberon? This section highlights key areas, outlining why they are attractive for hosts and guests, along with notable local attractions. Consider these locations based on your target guest profile and investment strategy.
| Neighborhood / Area | Why Host Here? (Target Guests & Appeal) | Key Attractions & Landmarks |
|---|---|---|
| La Plage | A beautiful beach area that attracts families and sun-seekers. It offers picturesque views, water sports, and easy access to local shops and cafes. | Quiberon Beach, Water sports activities, Local seafood restaurants, Beachfront promenades, Sunset views |
| Port-Haliguen | A charming port area with a lively marina. Ideal for visitors interested in sailing, fishing, and enjoying fresh seafood. | Marina of Port-Haliguen, Fishing spots, Seafood markets, Coastal walks, Local cafes |
| Côte Sauvage | Known for its rugged coastline and stunning natural beauty. Great for nature lovers, hikers, and those who enjoy peaceful scenery away from the busyness. | Wild beaches, Cliff walks, Scenic lookout points, Nature reserves, Biodiversity |
| Centre-ville | The town center is vibrant and bustling, offering a mix of shopping, dining, and cultural experiences. Ideal for visitors wanting to explore local life. | Local markets, Shops and boutiques, Cafes and bistros, Historic buildings, Cultural sites |
| Pointe de Conguel | A picturesque point with panoramic views of the ocean. Perfect for visitors looking for serene walks and stunning sunsets. | Clifftop walks, Sea views, Lighthouses, Picnic areas, Photography spots |
| Ile de Houat | A nearby island accessible by boat, known for its stunning landscapes and less crowded beaches. Attractive for those wanting a day trip from Quiberon. | Isle beaches, Hiking trails, Local wildlife, Boat tours, Secluded spots |
| Thalassotherapy Centers | Famous for its wellness and health retreats, attracting guests looking for relaxation and rejuvenation through thalassotherapy. | Thermal spas, Health retreats, Wellness programs, Massages and treatments, Relaxation activities |
| Historical Sites | Quiberon has a rich history which attracts visitors interested in culture and heritage. Perfect for those looking to explore historical landmarks. | Fortifications, Museums, Cultural centers, Historic tours, Guided walks |
Understanding Airbnb License Requirements & STR Laws in Quiberon (2025)
While Quiberon, Brittany, France currently shows low STR regulations, specific Airbnb license requirements might still exist or change. Always verify the latest short term rental regulations and Airbnb license requirements directly with local government authorities for Quiberon to ensure full compliance before hosting.
(Source: AirROI data, 2025, based on 5% licensed listings)
Top Performing Airbnb Properties in Quiberon (2025)
Benchmark your potential! Explore examples of top-performing Airbnb properties in Quiberonbased on Trailing Twelve Month (TTM) revenue. Analyze their characteristics, revenue, occupancy rate, and ADR to understand what drives success in this market.

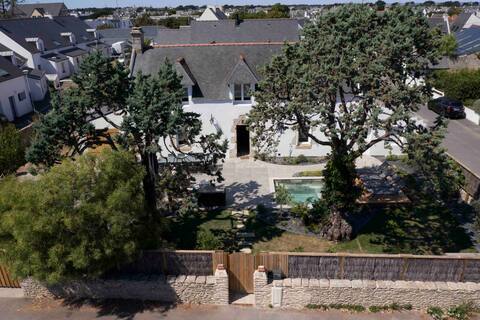
Villa Anna - all comforts and conveniently located
Entire Place • 5 bedrooms

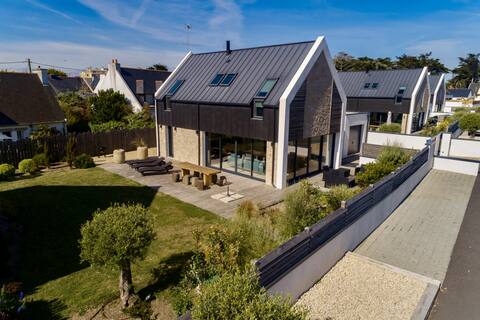
Villa Bikini "Sandy between sand" Sea view
Entire Place • 4 bedrooms
Villa Salicorne
Entire Place • 5 bedrooms
Luxury Villa Hathi, next to the beach and Quiberon
Entire Place • 4 bedrooms
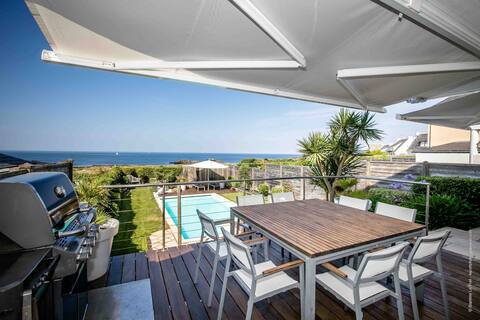
Beautiful villa with sea view, pool and jaccuzi
Entire Place • 4 bedrooms

Large Quiberon apartment full sea view
Entire Place • 2 bedrooms
Note: Performance varies based on location, size, amenities, seasonality, and management quality. Data reflects the past 12 months.
Top Performing Airbnb Hosts in Quiberon (2025)
Learn from the best! This table showcases top-performing Airbnb hosts in Quiberon based on the number of properties managed and estimated total revenue over the past year. Analyze their scale and performance metrics.
| Host Name | Properties | Grossing Revenue | Stay Reviews | Avg Rating |
|---|---|---|---|---|
| Fanny - Interhome Group | 58 | $473,252 | 450 | 3.89/5.0 |
| Laconciergeriedequiberon | 31 | $459,531 | 282 | 3.95/5.0 |
| Britannia Immobilier | 34 | $388,261 | 643 | 4.27/5.0 |
| Justine | 13 | $277,315 | 204 | 4.81/5.0 |
| Nathalie Et Pascal | 29 | $245,636 | 277 | 4.64/5.0 |
| Stephanie | 4 | $178,117 | 277 | 4.94/5.0 |
| Virginie | 8 | $150,360 | 106 | 4.17/5.0 |
| Justine | 7 | $147,070 | 243 | 4.89/5.0 |
| Magali | 2 | $129,114 | 35 | 5.00/5.0 |
| Pierre | 1 | $117,567 | 32 | 4.88/5.0 |
Analyzing the strategies of top hosts, such as their property selection, pricing, and guest communication, can offer valuable lessons for optimizing your own Airbnb operations in Quiberon.
Dive Deeper: Advanced Quiberon STR Market Data (2025)
Ready to unlock more insights? AirROI provides access to advanced metrics and comprehensive Airbnb data for Quiberon. Explore detailed analytics beyond this report to refine your investment strategy, optimize pricing, and maximize your vacation rental profits.
Explore Advanced MetricsQuiberon Short-Term Rental Market Composition (2025): Property & Room Types
Room Type Distribution
Property Type Distribution
Market Composition Insights for Quiberon
- The Quiberon Airbnb market composition is heavily skewed towards Entire Home/Apt listings, which make up 97.1% of the 660 active rentals. This indicates strong guest preference for privacy and space.
- Looking at the property type distribution in Quiberon, Apartment/Condo properties are the most common (58%), reflecting the local real estate landscape.
- Houses represent a significant 38% portion, catering likely to families or larger groups.
- Smaller segments like hotel/boutique, outdoor/unique, others (combined 4.0%) offer potential for unique stay experiences.
Quiberon Airbnb Room Capacity Analysis (2025): Bedroom Distribution
Distribution of Listings by Number of Bedrooms
Room Capacity Insights for Quiberon
- The dominant room capacity in Quiberon is 1 bedroom listings, making up 33% of the market. This suggests a strong demand for properties suitable for couples or solo travelers.
- Together, 1 bedroom and 2 bedrooms properties represent 61.8% of the active Airbnb listings in Quiberon, indicating a high concentration in these sizes.
- A significant 27.0% of listings offer 3+ bedrooms, catering to larger groups and families seeking more space in Quiberon.
Quiberon Vacation Rental Guest Capacity Trends (2025)
Distribution of Listings by Guest Capacity
Guest Capacity Insights for Quiberon
- The most common guest capacity trend in Quiberon vacation rentals is listings accommodating 4 guests (34.8%). This suggests the primary traveler segment is likely small families or groups.
- Properties designed for 4 guests and 2 guests dominate the Quiberon STR market, accounting for 54.5% of listings.
- 30.9% of properties accommodate 6+ guests, serving the market segment for larger families or group travel in Quiberon.
- On average, properties in Quiberon are equipped to host 4.4 guests.
Quiberon Airbnb Booking Patterns (2025): Available vs. Booked Days
Available Days Distribution
Booked Days Distribution
Booking Pattern Insights for Quiberon
- The most common availability pattern in Quiberon falls within the 271-366 days range, representing 46.5% of listings. This suggests many properties have significant open periods on their calendars.
- Approximately 83.5% of listings show high availability (181+ days open annually), indicating potential for increased bookings or specific owner usage patterns.
- For booked days, the 91-180 days range is most frequent in Quiberon (38%), reflecting common guest stay durations or potential owner blocking patterns.
- A notable 17.8% of properties secure long booking periods (181+ days booked per year), highlighting successful long-term rental strategies or significant owner usage.
Quiberon Airbnb Minimum Stay Requirements Analysis
Distribution of Listings by Minimum Night Requirement
1 Night
73 listings
11.6% of total
2 Nights
167 listings
26.5% of total
3 Nights
95 listings
15.1% of total
4-6 Nights
82 listings
13% of total
7-29 Nights
89 listings
14.1% of total
30+ Nights
124 listings
19.7% of total
Key Insights
- The most prevalent minimum stay requirement in Quiberon is 2 Nights, adopted by 26.5% of listings. This highlights the market's preference for shorter, flexible bookings.
- A significant segment (19.7%) caters to monthly stays (30+ nights) in Quiberon, pointing to opportunities in the extended-stay market.
Recommendations
- Align with the market by considering a 2 Nights minimum stay, as 26.5% of Quiberon hosts use this setting.
- If feasible, allowing 1-night stays, especially midweek or during low season, could capture last-minute bookings, as only 11.6% currently do.
- Explore offering discounts for stays of 30+ nights to attract the 19.7% of the market seeking extended stays.
- Adjust minimum nights based on seasonality – potentially shorter during low season and longer during peak demand periods in Quiberon.
Quiberon Airbnb Cancellation Policy Trends Analysis (2025)
Super Strict 30 Days
6 listings
1% of total
Super Strict 60 Days
1 listings
0.2% of total
Flexible
87 listings
14.3% of total
Moderate
115 listings
18.9% of total
Firm
209 listings
34.3% of total
Strict
191 listings
31.4% of total
Cancellation Policy Insights for Quiberon
- The prevailing Airbnb cancellation policy trend in Quiberon is Firm, used by 34.3% of listings.
- A majority (65.7%) of hosts in Quiberon utilize Firm or Strict policies, indicating a market where hosts prioritize booking security.
Recommendations for Hosts
- Consider adopting a Firm policy to align with the 34.3% market standard in Quiberon.
- With 31.4% using Strict terms, this is a viable option in Quiberon, particularly for high-value properties or during peak demand periods.
- Regularly review your cancellation policy against competitors and market demand shifts in Quiberon.
Quiberon STR Booking Lead Time Analysis (2025)
Average Booking Lead Time by Month
Booking Lead Time Insights for Quiberon
- The overall average booking lead time for vacation rentals in Quiberon is 68 days.
- Guests book furthest in advance for stays during July (average 111 days), likely coinciding with peak travel demand or local events.
- The shortest booking windows occur for stays in February (average 31 days), indicating more last-minute travel plans during this time.
- Seasonally, Summer (99 days avg.) sees the longest lead times, while Winter (42 days avg.) has the shortest, reflecting typical travel planning cycles.
Recommendations for Hosts
- Use the overall average lead time (68 days) as a baseline for your pricing and availability strategy in Quiberon.
- For July stays, consider implementing length-of-stay discounts or slightly higher rates for bookings made less than 111 days out to capitalize on advance planning.
- Target marketing efforts for the Summer season well in advance (at least 99 days) to capture early planners.
- Monitor your own booking lead times against these Quiberon averages to identify opportunities for dynamic pricing adjustments.
Popular & Essential Airbnb Amenities in Quiberon (2025)
Amenity Prevalence
Amenity Insights for Quiberon
- Essential amenities in Quiberon that guests expect include: Kitchen, Heating, TV. Lacking these (any) could significantly impact bookings.
- Popular amenities like Dishes and silverware, Hot water, Coffee maker are common but not universal. Offering these can provide a competitive edge.
Recommendations for Hosts
- Ensure your listing includes all essential amenities for Quiberon: Kitchen, Heating, TV.
- Prioritize adding missing essentials: Kitchen, Heating, TV.
- Consider adding popular differentiators like Dishes and silverware or Hot water to increase appeal.
- Highlight unique or less common amenities you offer (e.g., hot tub, dedicated workspace, EV charger) in your listing description and photos.
- Regularly check competitor amenities in Quiberon to stay competitive.
Quiberon Airbnb Guest Demographics & Profile Analysis (2025)
Guest Profile Summary for Quiberon
- The typical guest profile for Airbnb in Quiberon consists of primarily domestic travelers (90%), often arriving from nearby Paris, typically belonging to the Post-2000s (Gen Z/Alpha) group (50%), primarily speaking French or English.
- Domestic travelers account for 90.2% of guests.
- Key international markets include France (90.2%) and Germany (3.3%).
- Top languages spoken are French (47.4%) followed by English (33.2%).
- A significant demographic segment is the Post-2000s (Gen Z/Alpha) group, representing 50% of guests.
Recommendations for Hosts
- Target domestic marketing efforts towards travelers from Paris and Nantes.
- Tailor amenities and listing descriptions to appeal to the dominant Post-2000s (Gen Z/Alpha) demographic (e.g., highlight fast WiFi, smart home features, local guides).
- Highlight unique local experiences or amenities relevant to the primary guest profile.
- Consider seasonal promotions aligned with peak travel times for key origin markets.
Nearby Short-Term Rental Market Comparison
How does the Quiberon Airbnb market stack up against its neighbors? Compare key performance metrics like average monthly revenue, ADR, and occupancy rates in surrounding areas to understand the broader regional STR landscape.
| Market | Active Properties | Monthly Revenue | Daily Rate | Avg. Occupancy |
|---|---|---|---|---|
| Île-de-Bréhat | 46 | $2,254 | $221.52 | 45% |
| Lanmodez | 19 | $2,050 | $219.93 | 42% |
| Île-aux-Moines | 98 | $2,048 | $236.18 | 42% |
| Plouguenast-Langast | 18 | $2,006 | $233.04 | 40% |
| Plélan-le-Petit | 15 | $2,001 | $178.51 | 42% |
| Guern | 13 | $1,802 | $102.72 | 42% |
| Plumaugat | 18 | $1,773 | $272.67 | 29% |
| Caden | 22 | $1,766 | $152.63 | 47% |
| Landaul | 17 | $1,697 | $148.36 | 45% |
| L'Épine | 155 | $1,694 | $158.12 | 45% |