Plounéour-Brignogan-Plages Airbnb Market Analysis 2025: Short Term Rental Data & Vacation Rental Statistics in Brittany, France
Is Airbnb profitable in Plounéour-Brignogan-Plages in 2025? Explore comprehensive Airbnb analytics for Plounéour-Brignogan-Plages, Brittany, France to uncover income potential. This 2025 STR market report for Plounéour-Brignogan-Plages, based on AirROI data from April 2024 to March 2025, reveals key trends in the niche market of 170 active listings.
Whether you're considering an Airbnb investment in Plounéour-Brignogan-Plages, optimizing your existing vacation rental, or exploring rental arbitrage opportunities, understanding the Plounéour-Brignogan-Plages Airbnb data is crucial. Understanding the local regulations is key to maximizing your short term rental income potential. Let's dive into the specifics.
Key Plounéour-Brignogan-Plages Airbnb Performance Metrics Overview
Monthly Airbnb Revenue Variations & Income Potential in Plounéour-Brignogan-Plages (2025)
Understanding the monthly revenue variations for Airbnb listings in Plounéour-Brignogan-Plages is key to maximizing your short term rental income potential. Seasonality significantly impacts earnings. Our analysis, based on data from the past 12 months, shows that the peak revenue month for STRs in Plounéour-Brignogan-Plages is typically August, while January often presents the lowest earnings, highlighting opportunities for strategic pricing adjustments during shoulder and low seasons. Explore the typical Airbnb income in Plounéour-Brignogan-Plages across different performance tiers:
- Best-in-class properties (Top 10%) achieve $5,108+ monthly, often utilizing dynamic pricing and superior guest experiences.
- Strong performing properties (Top 25%) earn $2,986 or more, indicating effective management and desirable locations/amenities.
- Typical properties (Median) generate around $1,660 per month, representing the average market performance.
- Entry-level properties (Bottom 25%) see earnings around $863, often with potential for optimization.
Average Monthly Airbnb Earnings Trend in Plounéour-Brignogan-Plages
Plounéour-Brignogan-Plages Airbnb Occupancy Rate Trends (2025)
Maximize your bookings by understanding the Plounéour-Brignogan-Plages STR occupancy trends. Seasonal demand shifts significantly influence how often properties are booked. Typically, Augustsees the highest demand (peak season occupancy), while January experiences the lowest (low season). Effective strategies, like adjusting minimum stays or offering promotions, can boost occupancy during slower periods. Here's how different property tiers perform in Plounéour-Brignogan-Plages:
- Best-in-class properties (Top 10%) achieve 67%+ occupancy, indicating high desirability and potentially optimized availability.
- Strong performing properties (Top 25%) maintain 50% or higher occupancy, suggesting good market fit and guest satisfaction.
- Typical properties (Median) have an occupancy rate around 34%.
- Entry-level properties (Bottom 25%) average 19% occupancy, potentially facing higher vacancy.
Average Monthly Occupancy Rate Trend in Plounéour-Brignogan-Plages
Average Daily Rate (ADR) Airbnb Trends in Plounéour-Brignogan-Plages (2025)
Effective short term rental pricing strategy in Plounéour-Brignogan-Plages involves understanding monthly ADR fluctuations. The Average Daily Rate (ADR) for Airbnb in Plounéour-Brignogan-Plages typically peaks in July and dips lowest during March. Leveraging Airbnb dynamic pricing tools or strategies based on this seasonality can significantly boost revenue. Here's a look at the typical nightly rates achieved:
- Best-in-class properties (Top 10%) command rates of $397+ per night, often due to premium features or locations.
- Strong performing properties (Top 25%) achieve nightly rates of $239 or more.
- Typical properties (Median) charge around $146 per night.
- Entry-level properties (Bottom 25%) earn around $101 per night.
Average Daily Rate (ADR) Trend by Month in Plounéour-Brignogan-Plages
Get Live Plounéour-Brignogan-Plages Market Intelligence 👇

Explore Real-time Analytics
Airbnb Seasonality Analysis & Trends in Plounéour-Brignogan-Plages (2025)
Peak Season (August, July, May)
- Revenue averages $3,939 per month
- Occupancy rates average 56.8%
- Daily rates average $218
Shoulder Season
- Revenue averages $2,156 per month
- Occupancy maintains around 32.7%
- Daily rates hold near $197
Low Season (January, February, March)
- Revenue drops to average $1,149 per month
- Occupancy decreases to average 21.8%
- Daily rates adjust to average $173
Seasonality Insights for Plounéour-Brignogan-Plages
- The Airbnb seasonality in Plounéour-Brignogan-Plages shows highly seasonal trends requiring careful strategy. While the sections above show seasonal averages, it's also insightful to look at the extremes:
- During the high season, the absolute peak month showcases Plounéour-Brignogan-Plages's highest earning potential, with monthly revenues capable of climbing to $4,963, occupancy reaching a high of 73.3%, and ADRs peaking at $225.
- Conversely, the slowest single month of the year, typically falling within the low season, marks the market's lowest point. In this month, revenue might dip to $1,029, occupancy could drop to 19.2%, and ADRs may adjust down to $172.
- Understanding both the seasonal averages and these monthly peaks and troughs in revenue, occupancy, and ADR is crucial for maximizing your Airbnb profit potential in Plounéour-Brignogan-Plages.
Seasonal Strategies for Maximizing Profit
- Peak Season: Maximize revenue through premium pricing and potentially longer minimum stays. Ensure high availability.
- Low Season: Offer competitive pricing, special promotions (e.g., extended stay discounts), and flexible cancellation policies. Target off-season travelers like remote workers or budget-conscious guests.
- Shoulder Seasons: Implement dynamic pricing that balances peak and low rates. Target weekend travelers or specific events. Offer slightly more flexible terms than peak season.
- Regularly analyze your own performance against these Plounéour-Brignogan-Plages seasonality benchmarks and adjust your pricing and availability strategy accordingly.
Best Areas for Airbnb Investment in Plounéour-Brignogan-Plages (2025)
Exploring the top neighborhoods for short-term rentals in Plounéour-Brignogan-Plages? This section highlights key areas, outlining why they are attractive for hosts and guests, along with notable local attractions. Consider these locations based on your target guest profile and investment strategy.
| Neighborhood / Area | Why Host Here? (Target Guests & Appeal) | Key Attractions & Landmarks |
|---|---|---|
| North Beach | A peaceful coastal area perfect for relaxation, known for its beautiful sandy beaches and family-friendly atmosphere. Ideal for tourists seeking a tranquil getaway by the sea. | Brignogan-Plages Beach, Plage de Kersaliou, Île de Batz, Sentier des Douaniers, Local seafood restaurants |
| Saint-Pol-de-Léon | Nearby town rich in history and culture, featuring beautiful architecture and local markets. Great for guests looking to explore Brittany's rural charm and coastal scenery. | Saint-Pol-de-Léon Cathedral, Le Vieux Port, Local markets, Cité du Landerneau, La Maison des Johnnies |
| Roscoff | A historic fishing port with stunning architecture and ferry access to the îles de Batz. Popular among tourists for its picturesque streets and seaside promenades. | Plage de Rockroum, Thalasso Spa, Notre-Dame de Croaz Batz, Cité de la Mer, Local crêperies |
| Les Abers | A unique coastal region known for its stunning landscapes and natural beauty, perfect for those seeking outdoor activities such as hiking and sailing. | Abers coastline, Ile d'Ouessant, Marina de Portsall, Fishermen's villages, Local seafood markets |
| Kerlouan | A charming village famous for its coastal paths and historic landmarks, appealing to tourists interested in Brittany's rich maritime heritage. | Plage de Kerlouan, Menhirs of Kerlouan, Local art galleries, Fishing harbor, Celtic festivals |
| Gouesnou | A suburban area close to Brest, providing easy access to urban amenities while retaining a peaceful, residential feel. Great for families and business travelers. | Brest Castle, Oceanopolis, Brest's Public Gardens, Local markets, Cultural events |
| Plouescat | A quaint coastal town offering beautiful beaches and a relaxed atmosphere, popular with visitors looking for a true Breton experience. | Plage de Kerfissien, Local restaurants, Historic churches, Walking trails, Brittany's regional parks |
| Morgat | A scenic coastal area with stunning cliffs and beaches, well-known for water sports and outdoor activities. Draws adventure seekers and nature lovers. | Morgat beach, Church of Notre-Dame de la Mer, Hiking trails, Boat excursions, Local surf schools |
Understanding Airbnb License Requirements & STR Laws in Plounéour-Brignogan-Plages (2025)
With 11% of listings showing registration in 2025, understanding potential Airbnb license requirements is crucial in Plounéour-Brignogan-Plages. Always verify the latest short term rental regulations and Airbnb license requirements directly with local government authorities for Plounéour-Brignogan-Plages to ensure full compliance before hosting.
(Source: AirROI data, 2025, based on 11% licensed listings)
Top Performing Airbnb Properties in Plounéour-Brignogan-Plages (2025)
Benchmark your potential! Explore examples of top-performing Airbnb properties in Plounéour-Brignogan-Plagesbased on Trailing Twelve Month (TTM) revenue. Analyze their characteristics, revenue, occupancy rate, and ADR to understand what drives success in this market.
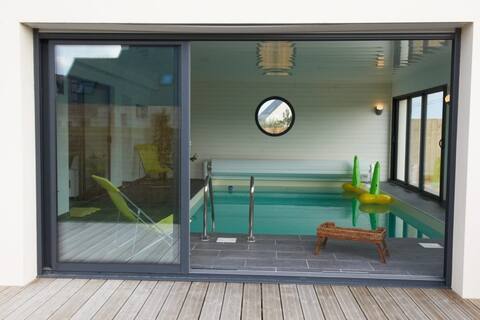
Villa Cassiopée , Indoor Pool, Near Beach
Entire Place • 4 bedrooms

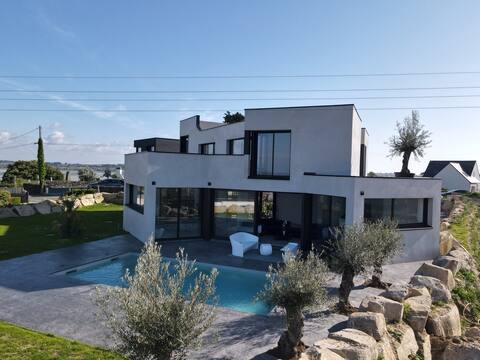
The Villas of Audrey: The Villa of the Legends
Entire Place • 9 bedrooms

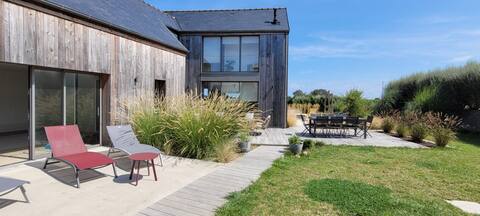
Villa "Coté Plage" sea view, swimming pool for 9 people.
Entire Place • 4 bedrooms

Audrey's villas: Villa Ty Find everything
Entire Place • 8 bedrooms
Dolmen and Rigadelles indoor pool 12pers
Entire Place • 4 bedrooms
Audrey's villas: The blockhouse villa
Entire Place • 4 bedrooms
Note: Performance varies based on location, size, amenities, seasonality, and management quality. Data reflects the past 12 months.
Top Performing Airbnb Hosts in Plounéour-Brignogan-Plages (2025)
Learn from the best! This table showcases top-performing Airbnb hosts in Plounéour-Brignogan-Plages based on the number of properties managed and estimated total revenue over the past year. Analyze their scale and performance metrics.
| Host Name | Properties | Grossing Revenue | Stay Reviews | Avg Rating |
|---|---|---|---|---|
| Audrey | 4 | $281,344 | 163 | 4.93/5.0 |
| Emilie | 4 | $158,769 | 35 | 3.73/5.0 |
| Guy | 1 | $107,936 | 40 | 4.90/5.0 |
| Pierre | 1 | $81,362 | 10 | 5.00/5.0 |
| Titouan | 2 | $79,997 | 36 | 4.94/5.0 |
| Pascal | 1 | $78,171 | 6 | 5.00/5.0 |
| Westone | 5 | $72,148 | 17 | 3.97/5.0 |
| Daniel | 2 | $66,115 | 67 | 4.93/5.0 |
| Isabelle | 1 | $63,476 | 42 | 4.79/5.0 |
| Nicolas | 1 | $61,914 | 28 | 4.96/5.0 |
Analyzing the strategies of top hosts, such as their property selection, pricing, and guest communication, can offer valuable lessons for optimizing your own Airbnb operations in Plounéour-Brignogan-Plages.
Dive Deeper: Advanced Plounéour-Brignogan-Plages STR Market Data (2025)
Ready to unlock more insights? AirROI provides access to advanced metrics and comprehensive Airbnb data for Plounéour-Brignogan-Plages. Explore detailed analytics beyond this report to refine your investment strategy, optimize pricing, and maximize your vacation rental profits.
Explore Advanced MetricsPlounéour-Brignogan-Plages Short-Term Rental Market Composition (2025): Property & Room Types
Room Type Distribution
Property Type Distribution
Market Composition Insights for Plounéour-Brignogan-Plages
- The Plounéour-Brignogan-Plages Airbnb market composition is heavily skewed towards Entire Home/Apt listings, which make up 96.5% of the 170 active rentals. This indicates strong guest preference for privacy and space.
- Looking at the property type distribution in Plounéour-Brignogan-Plages, House properties are the most common (85.9%), reflecting the local real estate landscape.
- Houses represent a significant 85.9% portion, catering likely to families or larger groups.
- Smaller segments like hotel/boutique, outdoor/unique (combined 5.3%) offer potential for unique stay experiences.
Plounéour-Brignogan-Plages Airbnb Room Capacity Analysis (2025): Bedroom Distribution
Distribution of Listings by Number of Bedrooms
Room Capacity Insights for Plounéour-Brignogan-Plages
- The dominant room capacity in Plounéour-Brignogan-Plages is 3 bedrooms listings, making up 28.8% of the market. This suggests a strong demand for properties suitable for families or small groups.
- Together, 3 bedrooms and 4 bedrooms properties represent 57.6% of the active Airbnb listings in Plounéour-Brignogan-Plages, indicating a high concentration in these sizes.
- A significant 71.7% of listings offer 3+ bedrooms, catering to larger groups and families seeking more space in Plounéour-Brignogan-Plages.
Plounéour-Brignogan-Plages Vacation Rental Guest Capacity Trends (2025)
Distribution of Listings by Guest Capacity
Guest Capacity Insights for Plounéour-Brignogan-Plages
- The most common guest capacity trend in Plounéour-Brignogan-Plages vacation rentals is listings accommodating 8+ guests (47.1%). This suggests the primary traveler segment is likely larger groups.
- Properties designed for 8+ guests and 6 guests dominate the Plounéour-Brignogan-Plages STR market, accounting for 65.3% of listings.
- 68.2% of properties accommodate 6+ guests, serving the market segment for larger families or group travel in Plounéour-Brignogan-Plages.
- On average, properties in Plounéour-Brignogan-Plages are equipped to host 6.2 guests.
Plounéour-Brignogan-Plages Airbnb Booking Patterns (2025): Available vs. Booked Days
Available Days Distribution
Booked Days Distribution
Booking Pattern Insights for Plounéour-Brignogan-Plages
- The most common availability pattern in Plounéour-Brignogan-Plages falls within the 271-366 days range, representing 53.5% of listings. This suggests many properties have significant open periods on their calendars.
- Approximately 87.6% of listings show high availability (181+ days open annually), indicating potential for increased bookings or specific owner usage patterns.
- For booked days, the 91-180 days range is most frequent in Plounéour-Brignogan-Plages (34.7%), reflecting common guest stay durations or potential owner blocking patterns.
- A notable 14.1% of properties secure long booking periods (181+ days booked per year), highlighting successful long-term rental strategies or significant owner usage.
Plounéour-Brignogan-Plages Airbnb Minimum Stay Requirements Analysis
Distribution of Listings by Minimum Night Requirement
1 Night
12 listings
7.4% of total
2 Nights
29 listings
17.9% of total
3 Nights
21 listings
13% of total
4-6 Nights
43 listings
26.5% of total
7-29 Nights
30 listings
18.5% of total
30+ Nights
27 listings
16.7% of total
Key Insights
- The most prevalent minimum stay requirement in Plounéour-Brignogan-Plages is 4-6 Nights, adopted by 26.5% of listings. This highlights the market's preference for longer commitments.
- A significant segment (16.7%) caters to monthly stays (30+ nights) in Plounéour-Brignogan-Plages, pointing to opportunities in the extended-stay market.
Recommendations
- Align with the market by considering a 4-6 Nights minimum stay, as 26.5% of Plounéour-Brignogan-Plages hosts use this setting.
- If feasible, allowing 1-night stays, especially midweek or during low season, could capture last-minute bookings, as only 7.4% currently do.
- Explore offering discounts for stays of 30+ nights to attract the 16.7% of the market seeking extended stays.
- Adjust minimum nights based on seasonality – potentially shorter during low season and longer during peak demand periods in Plounéour-Brignogan-Plages.
Plounéour-Brignogan-Plages Airbnb Cancellation Policy Trends Analysis (2025)
Super Strict 60 Days
1 listings
0.7% of total
Super Strict 30 Days
5 listings
3.4% of total
Flexible
16 listings
11% of total
Moderate
21 listings
14.4% of total
Firm
57 listings
39% of total
Strict
46 listings
31.5% of total
Cancellation Policy Insights for Plounéour-Brignogan-Plages
- The prevailing Airbnb cancellation policy trend in Plounéour-Brignogan-Plages is Firm, used by 39% of listings.
- A majority (70.5%) of hosts in Plounéour-Brignogan-Plages utilize Firm or Strict policies, indicating a market where hosts prioritize booking security.
Recommendations for Hosts
- Consider adopting a Firm policy to align with the 39% market standard in Plounéour-Brignogan-Plages.
- With 31.5% using Strict terms, this is a viable option in Plounéour-Brignogan-Plages, particularly for high-value properties or during peak demand periods.
- Regularly review your cancellation policy against competitors and market demand shifts in Plounéour-Brignogan-Plages.
Plounéour-Brignogan-Plages STR Booking Lead Time Analysis (2025)
Average Booking Lead Time by Month
Booking Lead Time Insights for Plounéour-Brignogan-Plages
- The overall average booking lead time for vacation rentals in Plounéour-Brignogan-Plages is 70 days.
- Guests book furthest in advance for stays during July (average 155 days), likely coinciding with peak travel demand or local events.
- The shortest booking windows occur for stays in November (average 35 days), indicating more last-minute travel plans during this time.
- Seasonally, Summer (125 days avg.) sees the longest lead times, while Winter (48 days avg.) has the shortest, reflecting typical travel planning cycles.
Recommendations for Hosts
- Use the overall average lead time (70 days) as a baseline for your pricing and availability strategy in Plounéour-Brignogan-Plages.
- For July stays, consider implementing length-of-stay discounts or slightly higher rates for bookings made less than 155 days out to capitalize on advance planning.
- Target marketing efforts for the Summer season well in advance (at least 125 days) to capture early planners.
- Monitor your own booking lead times against these Plounéour-Brignogan-Plages averages to identify opportunities for dynamic pricing adjustments.
Popular & Essential Airbnb Amenities in Plounéour-Brignogan-Plages (2025)
Amenity Prevalence
Amenity Insights for Plounéour-Brignogan-Plages
- Essential amenities in Plounéour-Brignogan-Plages that guests expect include: Kitchen. Lacking these (this) could significantly impact bookings.
- Popular amenities like TV, Heating, Washer are common but not universal. Offering these can provide a competitive edge.
- Warning: Wifi is not universally provided but is considered essential globally. Ensure reliable Wifi is offered.
Recommendations for Hosts
- Ensure your listing includes all essential amenities for Plounéour-Brignogan-Plages: Kitchen.
- Prioritize adding missing essentials: Kitchen.
- Consider adding popular differentiators like TV or Heating to increase appeal.
- Highlight unique or less common amenities you offer (e.g., hot tub, dedicated workspace, EV charger) in your listing description and photos.
- Regularly check competitor amenities in Plounéour-Brignogan-Plages to stay competitive.
Plounéour-Brignogan-Plages Airbnb Guest Demographics & Profile Analysis (2025)
Guest Profile Summary for Plounéour-Brignogan-Plages
- The typical guest profile for Airbnb in Plounéour-Brignogan-Plages consists of primarily domestic travelers (75%), often arriving from nearby Paris, typically belonging to the Post-2000s (Gen Z/Alpha) group (50%), primarily speaking French or English.
- Domestic travelers account for 74.8% of guests.
- Key international markets include France (74.8%) and Germany (7.9%).
- Top languages spoken are French (40.1%) followed by English (36.7%).
- A significant demographic segment is the Post-2000s (Gen Z/Alpha) group, representing 50% of guests.
Recommendations for Hosts
- Target domestic marketing efforts towards travelers from Paris and Rennes.
- Tailor amenities and listing descriptions to appeal to the dominant Post-2000s (Gen Z/Alpha) demographic (e.g., highlight fast WiFi, smart home features, local guides).
- Highlight unique local experiences or amenities relevant to the primary guest profile.
- Consider seasonal promotions aligned with peak travel times for key origin markets.
Nearby Short-Term Rental Market Comparison
How does the Plounéour-Brignogan-Plages Airbnb market stack up against its neighbors? Compare key performance metrics like average monthly revenue, ADR, and occupancy rates in surrounding areas to understand the broader regional STR landscape.
| Market | Active Properties | Monthly Revenue | Daily Rate | Avg. Occupancy |
|---|---|---|---|---|
| Île-de-Bréhat | 46 | $2,254 | $221.52 | 45% |
| Ushant | 64 | $2,087 | $152.83 | 54% |
| Lanmodez | 19 | $2,050 | $219.93 | 42% |
| Guern | 13 | $1,802 | $102.72 | 42% |
| Landaul | 17 | $1,697 | $148.36 | 45% |
| Plourin | 16 | $1,686 | $176.47 | 45% |
| Sainte-Brigitte | 11 | $1,652 | $164.87 | 39% |
| Langoat | 10 | $1,645 | $105.20 | 58% |
| Sibiril | 43 | $1,568 | $162.58 | 44% |
| Languidic | 39 | $1,566 | $151.00 | 43% |