Plouguiel Airbnb Market Analysis 2025: Short Term Rental Data & Vacation Rental Statistics in Brittany, France
Is Airbnb profitable in Plouguiel in 2025? Explore comprehensive Airbnb analytics for Plouguiel, Brittany, France to uncover income potential. This 2025 STR market report for Plouguiel, based on AirROI data from April 2024 to March 2025, reveals key trends in the niche market of 32 active listings.
Whether you're considering an Airbnb investment in Plouguiel, optimizing your existing vacation rental, or exploring rental arbitrage opportunities, understanding the Plouguiel Airbnb data is crucial. Understanding the local regulations is key to maximizing your short term rental income potential. Let's dive into the specifics.
Key Plouguiel Airbnb Performance Metrics Overview
Monthly Airbnb Revenue Variations & Income Potential in Plouguiel (2025)
Understanding the monthly revenue variations for Airbnb listings in Plouguiel is key to maximizing your short term rental income potential. Seasonality significantly impacts earnings. Our analysis, based on data from the past 12 months, shows that the peak revenue month for STRs in Plouguiel is typically August, while March often presents the lowest earnings, highlighting opportunities for strategic pricing adjustments during shoulder and low seasons. Explore the typical Airbnb income in Plouguiel across different performance tiers:
- Best-in-class properties (Top 10%) achieve $2,302+ monthly, often utilizing dynamic pricing and superior guest experiences.
- Strong performing properties (Top 25%) earn $1,672 or more, indicating effective management and desirable locations/amenities.
- Typical properties (Median) generate around $1,046 per month, representing the average market performance.
- Entry-level properties (Bottom 25%) see earnings around $638, often with potential for optimization.
Average Monthly Airbnb Earnings Trend in Plouguiel
Plouguiel Airbnb Occupancy Rate Trends (2025)
Maximize your bookings by understanding the Plouguiel STR occupancy trends. Seasonal demand shifts significantly influence how often properties are booked. Typically, Augustsees the highest demand (peak season occupancy), while March experiences the lowest (low season). Effective strategies, like adjusting minimum stays or offering promotions, can boost occupancy during slower periods. Here's how different property tiers perform in Plouguiel:
- Best-in-class properties (Top 10%) achieve 73%+ occupancy, indicating high desirability and potentially optimized availability.
- Strong performing properties (Top 25%) maintain 56% or higher occupancy, suggesting good market fit and guest satisfaction.
- Typical properties (Median) have an occupancy rate around 36%.
- Entry-level properties (Bottom 25%) average 22% occupancy, potentially facing higher vacancy.
Average Monthly Occupancy Rate Trend in Plouguiel
Average Daily Rate (ADR) Airbnb Trends in Plouguiel (2025)
Effective short term rental pricing strategy in Plouguiel involves understanding monthly ADR fluctuations. The Average Daily Rate (ADR) for Airbnb in Plouguiel typically peaks in July and dips lowest during February. Leveraging Airbnb dynamic pricing tools or strategies based on this seasonality can significantly boost revenue. Here's a look at the typical nightly rates achieved:
- Best-in-class properties (Top 10%) command rates of $204+ per night, often due to premium features or locations.
- Strong performing properties (Top 25%) achieve nightly rates of $118 or more.
- Typical properties (Median) charge around $92 per night.
- Entry-level properties (Bottom 25%) earn around $69 per night.
Average Daily Rate (ADR) Trend by Month in Plouguiel
Get Live Plouguiel Market Intelligence 👇

Explore Real-time Analytics
Airbnb Seasonality Analysis & Trends in Plouguiel (2025)
Peak Season (August, July, June)
- Revenue averages $2,052 per month
- Occupancy rates average 59.1%
- Daily rates average $116
Shoulder Season
- Revenue averages $1,187 per month
- Occupancy maintains around 36.6%
- Daily rates hold near $110
Low Season (February, March, November)
- Revenue drops to average $660 per month
- Occupancy decreases to average 23.6%
- Daily rates adjust to average $104
Seasonality Insights for Plouguiel
- The Airbnb seasonality in Plouguiel shows highly seasonal trends requiring careful strategy. While the sections above show seasonal averages, it's also insightful to look at the extremes:
- During the high season, the absolute peak month showcases Plouguiel's highest earning potential, with monthly revenues capable of climbing to $2,365, occupancy reaching a high of 73.3%, and ADRs peaking at $117.
- Conversely, the slowest single month of the year, typically falling within the low season, marks the market's lowest point. In this month, revenue might dip to $598, occupancy could drop to 18.7%, and ADRs may adjust down to $102.
- Understanding both the seasonal averages and these monthly peaks and troughs in revenue, occupancy, and ADR is crucial for maximizing your Airbnb profit potential in Plouguiel.
Seasonal Strategies for Maximizing Profit
- Peak Season: Maximize revenue through premium pricing and potentially longer minimum stays. Ensure high availability.
- Low Season: Offer competitive pricing, special promotions (e.g., extended stay discounts), and flexible cancellation policies. Target off-season travelers like remote workers or budget-conscious guests.
- Shoulder Seasons: Implement dynamic pricing that balances peak and low rates. Target weekend travelers or specific events. Offer slightly more flexible terms than peak season.
- Regularly analyze your own performance against these Plouguiel seasonality benchmarks and adjust your pricing and availability strategy accordingly.
Best Areas for Airbnb Investment in Plouguiel (2025)
Exploring the top neighborhoods for short-term rentals in Plouguiel? This section highlights key areas, outlining why they are attractive for hosts and guests, along with notable local attractions. Consider these locations based on your target guest profile and investment strategy.
| Neighborhood / Area | Why Host Here? (Target Guests & Appeal) | Key Attractions & Landmarks |
|---|---|---|
| Plouguiel Town Centre | Charming town center with local culture, shops, and eateries. Ideal for visitors wanting to experience the authentic Breton lifestyle while being close to local amenities. | Chateau de la Roche-Jagu, Sentiers des douaniers, Plages de Treguier, Cote de Granit Rose |
| Trégor Coast | Stunning coastal area known for its dramatic cliffs and beautiful beaches. Attracts nature lovers and beachgoers looking for relaxation and outdoor activities. | Treguier beaches, Hiking trails, Coastal viewpoints, Water sports activities, Sand dune landscapes |
| Rural Brittany | Picturesque countryside ideal for those seeking a quiet retreat. Visitors can enjoy the serene landscape, local agriculture, and quaint villages. | Walking and cycling paths, Local farms, Historic villages, Nature parks, Charming countryside |
| Côte de Granit Rose | Famous for its pink granite rocks and stunning coastal scenery, this area is a popular destination for tourists looking to enjoy unique landscapes and outdoor activities. | Ploumanac'h, Rescue cape lighthouse, Hiking trails along the coast, Dramatic coastline, Local artisan shops |
| L'Île de Bréhat | A beautiful island known for its floral diversity and breathtaking scenery, accessible by ferry from Plouguiel. Attractive for visitors wanting a serene getaway. | Pointe de l'Arcouest, Coastal walks, Beaches, Flower gardens, Local seafood restaurants |
| Local Vineyards | Brittany is known for its unique wines; this area attracts wine lovers interested in discovery tours and tastings. | Wine tasting tours, Local wine producers, Countryside views, Educational tours, Brittany wine heritage |
| Historic Sites | Rich in history, this area includes numerous historic sites, making it appealing for tourists interested in learning about Brittany's past. | Château de La Roche-Jagu, Megalithic sites, Medieval architecture, Local history museums, Guided historical tours |
| Art and Culture Scene | Plouguiel has a growing art scene with galleries and cultural events that attract both locals and tourists, making it a vibrant location to discover local creativity. | Art galleries, Cultural festivals, Local craft shops, Performing arts events, Community workshops |
Understanding Airbnb License Requirements & STR Laws in Plouguiel (2025)
With 16% of listings showing registration in 2025, understanding potential Airbnb license requirements is crucial in Plouguiel. Always verify the latest short term rental regulations and Airbnb license requirements directly with local government authorities for Plouguiel to ensure full compliance before hosting.
(Source: AirROI data, 2025, based on 16% licensed listings)
Top Performing Airbnb Properties in Plouguiel (2025)
Benchmark your potential! Explore examples of top-performing Airbnb properties in Plouguielbased on Trailing Twelve Month (TTM) revenue. Analyze their characteristics, revenue, occupancy rate, and ADR to understand what drives success in this market.
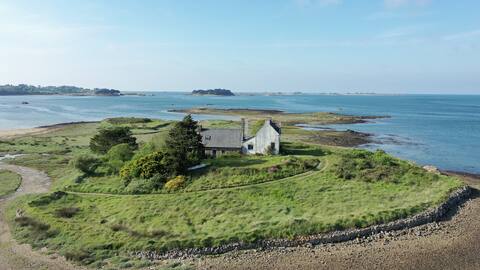
Exceptional site on the sea - Calder's house
Entire Place • 3 bedrooms

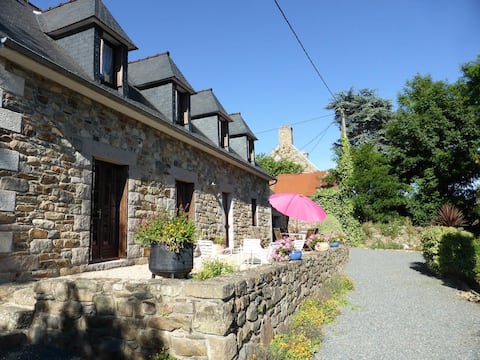
Warm house 8 people equipped
Entire Place • 4 bedrooms
Kerbalanger, on the coastline of the ajoncs
Entire Place • 3 bedrooms
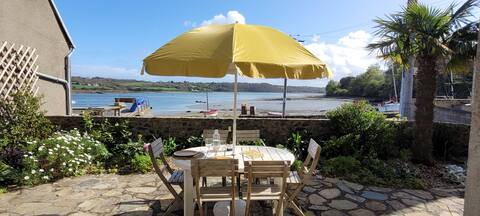
Gite les pieds dans l 'eau La Roche Jaune
Entire Place • 2 bedrooms
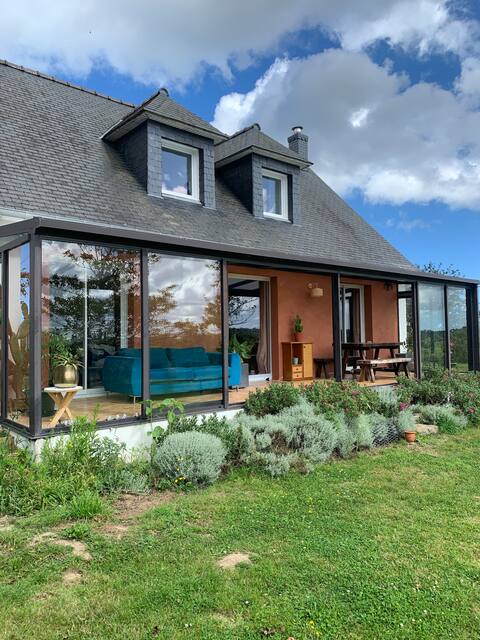
Gr34 : Jolie maison vue sur la vallée
Entire Place • 2 bedrooms
Small fisherman's house
Entire Place • 2 bedrooms
Note: Performance varies based on location, size, amenities, seasonality, and management quality. Data reflects the past 12 months.
Top Performing Airbnb Hosts in Plouguiel (2025)
Learn from the best! This table showcases top-performing Airbnb hosts in Plouguiel based on the number of properties managed and estimated total revenue over the past year. Analyze their scale and performance metrics.
| Host Name | Properties | Grossing Revenue | Stay Reviews | Avg Rating |
|---|---|---|---|---|
| Koulmig | 3 | $30,394 | 24 | 4.96/5.0 |
| Carole | 4 | $30,362 | 151 | 4.78/5.0 |
| Laure | 1 | $28,849 | 110 | 4.85/5.0 |
| Valerie | 1 | $22,652 | 25 | 4.88/5.0 |
| Serge | 3 | $21,481 | 26 | 4.98/5.0 |
| Pascale | 1 | $19,394 | 148 | 4.92/5.0 |
| Marie | 1 | $18,244 | 9 | 4.89/5.0 |
| Host #43477527 | 1 | $17,233 | 1 | 0.00/5.0 |
| Virginie,Anne | 1 | $16,061 | 33 | 4.91/5.0 |
| Anne-Laure | 2 | $15,298 | 104 | 4.90/5.0 |
Analyzing the strategies of top hosts, such as their property selection, pricing, and guest communication, can offer valuable lessons for optimizing your own Airbnb operations in Plouguiel.
Dive Deeper: Advanced Plouguiel STR Market Data (2025)
Ready to unlock more insights? AirROI provides access to advanced metrics and comprehensive Airbnb data for Plouguiel. Explore detailed analytics beyond this report to refine your investment strategy, optimize pricing, and maximize your vacation rental profits.
Explore Advanced MetricsPlouguiel Short-Term Rental Market Composition (2025): Property & Room Types
Room Type Distribution
Property Type Distribution
Market Composition Insights for Plouguiel
- The Plouguiel Airbnb market composition is heavily skewed towards Entire Home/Apt listings, which make up 68.8% of the 32 active rentals. This indicates strong guest preference for privacy and space.
- However, a notable 28.1% share for Private Rooms suggests opportunities for budget-conscious travelers or hosts renting out spare rooms.
- Looking at the property type distribution in Plouguiel, House properties are the most common (56.3%), reflecting the local real estate landscape.
- Houses represent a significant 56.3% portion, catering likely to families or larger groups.
- The presence of 18.8% Hotel/Boutique listings indicates integration with traditional hospitality.
- Smaller segments like others, unique stays (combined 6.2%) offer potential for unique stay experiences.
Plouguiel Airbnb Room Capacity Analysis (2025): Bedroom Distribution
Distribution of Listings by Number of Bedrooms
Room Capacity Insights for Plouguiel
- The dominant room capacity in Plouguiel is 2 bedrooms listings, making up 34.4% of the market. This suggests a strong demand for properties suitable for couples or solo travelers.
- Together, 2 bedrooms and 1 bedroom properties represent 53.2% of the active Airbnb listings in Plouguiel, indicating a high concentration in these sizes.
- A significant 25.0% of listings offer 3+ bedrooms, catering to larger groups and families seeking more space in Plouguiel.
Plouguiel Vacation Rental Guest Capacity Trends (2025)
Distribution of Listings by Guest Capacity
Guest Capacity Insights for Plouguiel
- The most common guest capacity trend in Plouguiel vacation rentals is listings accommodating 8+ guests (18.8%). This suggests the primary traveler segment is likely larger groups.
- Properties designed for 8+ guests and 4 guests dominate the Plouguiel STR market, accounting for 37.6% of listings.
- 28.2% of properties accommodate 6+ guests, serving the market segment for larger families or group travel in Plouguiel.
- On average, properties in Plouguiel are equipped to host 3.7 guests.
Plouguiel Airbnb Booking Patterns (2025): Available vs. Booked Days
Available Days Distribution
Booked Days Distribution
Booking Pattern Insights for Plouguiel
- The most common availability pattern in Plouguiel falls within the 271-366 days range, representing 43.8% of listings. This suggests many properties have significant open periods on their calendars.
- Approximately 87.6% of listings show high availability (181+ days open annually), indicating potential for increased bookings or specific owner usage patterns.
- For booked days, the 91-180 days range is most frequent in Plouguiel (43.8%), reflecting common guest stay durations or potential owner blocking patterns.
- A notable 12.5% of properties secure long booking periods (181+ days booked per year), highlighting successful long-term rental strategies or significant owner usage.
Plouguiel Airbnb Minimum Stay Requirements Analysis
Distribution of Listings by Minimum Night Requirement
1 Night
12 listings
38.7% of total
2 Nights
3 listings
9.7% of total
3 Nights
1 listings
3.2% of total
4-6 Nights
8 listings
25.8% of total
7-29 Nights
6 listings
19.4% of total
30+ Nights
1 listings
3.2% of total
Key Insights
- The most prevalent minimum stay requirement in Plouguiel is 1 Night, adopted by 38.7% of listings. This highlights the market's preference for shorter, flexible bookings.
Recommendations
- Align with the market by considering a 1 Night minimum stay, as 38.7% of Plouguiel hosts use this setting.
- Adjust minimum nights based on seasonality – potentially shorter during low season and longer during peak demand periods in Plouguiel.
Plouguiel Airbnb Cancellation Policy Trends Analysis (2025)
Super Strict 60 Days
1 listings
3.6% of total
Flexible
11 listings
39.3% of total
Moderate
5 listings
17.9% of total
Firm
7 listings
25% of total
Strict
4 listings
14.3% of total
Cancellation Policy Insights for Plouguiel
- The prevailing Airbnb cancellation policy trend in Plouguiel is Flexible, used by 39.3% of listings.
- There's a relatively balanced mix between guest-friendly (57.2%) and stricter (39.3%) policies, offering choices for different guest needs.
Recommendations for Hosts
- Consider adopting a Flexible policy to align with the 39.3% market standard in Plouguiel.
- Using a Strict policy might deter some guests, as only 14.3% of listings use it. Evaluate if potential revenue protection outweighs possible lower booking rates.
- Regularly review your cancellation policy against competitors and market demand shifts in Plouguiel.
Plouguiel STR Booking Lead Time Analysis (2025)
Average Booking Lead Time by Month
Booking Lead Time Insights for Plouguiel
- The overall average booking lead time for vacation rentals in Plouguiel is 48 days.
- Guests book furthest in advance for stays during July (average 128 days), likely coinciding with peak travel demand or local events.
- The shortest booking windows occur for stays in February (average 33 days), indicating more last-minute travel plans during this time.
- Seasonally, Summer (105 days avg.) sees the longest lead times, while Winter (36 days avg.) has the shortest, reflecting typical travel planning cycles.
Recommendations for Hosts
- Use the overall average lead time (48 days) as a baseline for your pricing and availability strategy in Plouguiel.
- For July stays, consider implementing length-of-stay discounts or slightly higher rates for bookings made less than 128 days out to capitalize on advance planning.
- Target marketing efforts for the Summer season well in advance (at least 105 days) to capture early planners.
- Monitor your own booking lead times against these Plouguiel averages to identify opportunities for dynamic pricing adjustments.
Popular & Essential Airbnb Amenities in Plouguiel (2025)
Amenity Prevalence
Amenity Insights for Plouguiel
- Essential amenities in Plouguiel that guests expect include: Free parking on premises. Lacking these (this) could significantly impact bookings.
- Popular amenities like Kitchen, Wifi, Heating are common but not universal. Offering these can provide a competitive edge.
- Warning: Wifi is not universally provided but is considered essential globally. Ensure reliable Wifi is offered.
Recommendations for Hosts
- Ensure your listing includes all essential amenities for Plouguiel: Free parking on premises.
- Prioritize adding missing essentials: Free parking on premises.
- Consider adding popular differentiators like Kitchen or Wifi to increase appeal.
- Highlight unique or less common amenities you offer (e.g., hot tub, dedicated workspace, EV charger) in your listing description and photos.
- Regularly check competitor amenities in Plouguiel to stay competitive.
Plouguiel Airbnb Guest Demographics & Profile Analysis (2025)
Guest Profile Summary for Plouguiel
- The typical guest profile for Airbnb in Plouguiel consists of primarily domestic travelers (78%), often arriving from nearby Paris, typically belonging to the Post-2000s (Gen Z/Alpha) group (50%), primarily speaking French or English.
- Domestic travelers account for 77.8% of guests.
- Key international markets include France (77.8%) and Germany (6.8%).
- Top languages spoken are French (41.3%) followed by English (31.7%).
- A significant demographic segment is the Post-2000s (Gen Z/Alpha) group, representing 50% of guests.
Recommendations for Hosts
- Target domestic marketing efforts towards travelers from Paris and Rennes.
- Tailor amenities and listing descriptions to appeal to the dominant Post-2000s (Gen Z/Alpha) demographic (e.g., highlight fast WiFi, smart home features, local guides).
- Highlight unique local experiences or amenities relevant to the primary guest profile.
- Consider seasonal promotions aligned with peak travel times for key origin markets.
Nearby Short-Term Rental Market Comparison
How does the Plouguiel Airbnb market stack up against its neighbors? Compare key performance metrics like average monthly revenue, ADR, and occupancy rates in surrounding areas to understand the broader regional STR landscape.
| Market | Active Properties | Monthly Revenue | Daily Rate | Avg. Occupancy |
|---|---|---|---|---|
| St Martin | 14 | $4,074 | $436.70 | 51% |
| Saint Lawrence | 11 | $2,911 | $317.86 | 52% |
| St Ouen | 15 | $2,635 | $339.51 | 51% |
| St Clement | 14 | $2,522 | $219.76 | 51% |
| Grouville | 21 | $2,510 | $218.40 | 52% |
| St Helier | 66 | $2,497 | $216.70 | 56% |
| St Saviour | 20 | $2,432 | $199.42 | 54% |
| Île-de-Bréhat | 46 | $2,254 | $221.52 | 45% |
| Trinity | 12 | $2,208 | $156.98 | 61% |
| St Brelade | 49 | $2,206 | $205.10 | 53% |