Plougonven Airbnb Market Analysis 2025: Short Term Rental Data & Vacation Rental Statistics in Brittany, France
Is Airbnb profitable in Plougonven in 2025? Explore comprehensive Airbnb analytics for Plougonven, Brittany, France to uncover income potential. This 2025 STR market report for Plougonven, based on AirROI data from April 2024 to March 2025, reveals key trends in the niche market of 20 active listings.
Whether you're considering an Airbnb investment in Plougonven, optimizing your existing vacation rental, or exploring rental arbitrage opportunities, understanding the Plougonven Airbnb data is crucial. Understanding the local regulations is key to maximizing your short term rental income potential. Let's dive into the specifics.
Key Plougonven Airbnb Performance Metrics Overview
Monthly Airbnb Revenue Variations & Income Potential in Plougonven (2025)
Understanding the monthly revenue variations for Airbnb listings in Plougonven is key to maximizing your short term rental income potential. Seasonality significantly impacts earnings. Our analysis, based on data from the past 12 months, shows that the peak revenue month for STRs in Plougonven is typically August, while January often presents the lowest earnings, highlighting opportunities for strategic pricing adjustments during shoulder and low seasons. Explore the typical Airbnb income in Plougonven across different performance tiers:
- Best-in-class properties (Top 10%) achieve $2,868+ monthly, often utilizing dynamic pricing and superior guest experiences.
- Strong performing properties (Top 25%) earn $1,370 or more, indicating effective management and desirable locations/amenities.
- Typical properties (Median) generate around $862 per month, representing the average market performance.
- Entry-level properties (Bottom 25%) see earnings around $436, often with potential for optimization.
Average Monthly Airbnb Earnings Trend in Plougonven
Plougonven Airbnb Occupancy Rate Trends (2025)
Maximize your bookings by understanding the Plougonven STR occupancy trends. Seasonal demand shifts significantly influence how often properties are booked. Typically, Augustsees the highest demand (peak season occupancy), while January experiences the lowest (low season). Effective strategies, like adjusting minimum stays or offering promotions, can boost occupancy during slower periods. Here's how different property tiers perform in Plougonven:
- Best-in-class properties (Top 10%) achieve 64%+ occupancy, indicating high desirability and potentially optimized availability.
- Strong performing properties (Top 25%) maintain 51% or higher occupancy, suggesting good market fit and guest satisfaction.
- Typical properties (Median) have an occupancy rate around 35%.
- Entry-level properties (Bottom 25%) average 17% occupancy, potentially facing higher vacancy.
Average Monthly Occupancy Rate Trend in Plougonven
Average Daily Rate (ADR) Airbnb Trends in Plougonven (2025)
Effective short term rental pricing strategy in Plougonven involves understanding monthly ADR fluctuations. The Average Daily Rate (ADR) for Airbnb in Plougonven typically peaks in January and dips lowest during October. Leveraging Airbnb dynamic pricing tools or strategies based on this seasonality can significantly boost revenue. Here's a look at the typical nightly rates achieved:
- Best-in-class properties (Top 10%) command rates of $135+ per night, often due to premium features or locations.
- Strong performing properties (Top 25%) achieve nightly rates of $99 or more.
- Typical properties (Median) charge around $78 per night.
- Entry-level properties (Bottom 25%) earn around $64 per night.
Average Daily Rate (ADR) Trend by Month in Plougonven
Get Live Plougonven Market Intelligence 👇

Explore Real-time Analytics
Airbnb Seasonality Analysis & Trends in Plougonven (2025)
Peak Season (August, July, April)
- Revenue averages $1,903 per month
- Occupancy rates average 59.4%
- Daily rates average $127
Shoulder Season
- Revenue averages $1,145 per month
- Occupancy maintains around 32.4%
- Daily rates hold near $130
Low Season (January, February, December)
- Revenue drops to average $581 per month
- Occupancy decreases to average 18.5%
- Daily rates adjust to average $148
Seasonality Insights for Plougonven
- The Airbnb seasonality in Plougonven shows highly seasonal trends requiring careful strategy. While the sections above show seasonal averages, it's also insightful to look at the extremes:
- During the high season, the absolute peak month showcases Plougonven's highest earning potential, with monthly revenues capable of climbing to $2,164, occupancy reaching a high of 67.9%, and ADRs peaking at $149.
- Conversely, the slowest single month of the year, typically falling within the low season, marks the market's lowest point. In this month, revenue might dip to $284, occupancy could drop to 9.0%, and ADRs may adjust down to $121.
- Understanding both the seasonal averages and these monthly peaks and troughs in revenue, occupancy, and ADR is crucial for maximizing your Airbnb profit potential in Plougonven.
Seasonal Strategies for Maximizing Profit
- Peak Season: Maximize revenue through premium pricing and potentially longer minimum stays. Ensure high availability.
- Low Season: Offer competitive pricing, special promotions (e.g., extended stay discounts), and flexible cancellation policies. Target off-season travelers like remote workers or budget-conscious guests.
- Shoulder Seasons: Implement dynamic pricing that balances peak and low rates. Target weekend travelers or specific events. Offer slightly more flexible terms than peak season.
- Regularly analyze your own performance against these Plougonven seasonality benchmarks and adjust your pricing and availability strategy accordingly.
Best Areas for Airbnb Investment in Plougonven (2025)
Exploring the top neighborhoods for short-term rentals in Plougonven? This section highlights key areas, outlining why they are attractive for hosts and guests, along with notable local attractions. Consider these locations based on your target guest profile and investment strategy.
| Neighborhood / Area | Why Host Here? (Target Guests & Appeal) | Key Attractions & Landmarks |
|---|---|---|
| Le Bourg | The heart of Plougonven, offering a charming atmosphere with local shops, cafés, and essential services. A convenient base for exploring Brittany and the nearby coast. | Church of Saint Peter, Local markets, Brittany's countryside, Friendly community vibe |
| Tregor Coast | A beautiful coastal area with stunning views and beaches. Perfect for tourists wanting to enjoy the sea and outdoor activities like hiking and kayaking. | Plage de Trégastel, Coastal hiking trails, Marine wildlife, Water sports activities |
| Monts d'Arrée | A mountainous region offering breathtaking landscapes, ideal for nature lovers and hiking enthusiasts. Gravitates those interested in eco-tourism and outdoor adventures. | Hiking trails, Natural parks, Scenic viewpoints, Local flora and fauna |
| Morlaix | Nearby town with a rich history and well-preserved architecture. Attracts visitors interested in cultural heritage and history, with a charming city center. | Viaduct of Morlaix, Historic town center, Museum of Morlaix, Local festivals |
| Landivisiau | A hub for local commerce and services, providing an authentic Breton experience. Great for those looking for a quieter stay with easy access to larger towns. | Local markets, Cultural events, Nearby parks, Shopping facilities |
| Plougasnou | A quaint seaside town known for its lovely beaches and coastal paths. Perfect for families and beachgoers looking to relax by the sea. | Beaches, Coastal paths, Fishing opportunities, Local seafood restaurants |
| Saint-Thégonnec | Famous for its unique church and calvary, attracting tourists interested in historical and religious sites. A quiet village atmosphere with cultural richness. | Church of Saint Thégonnec, Calvary of Saint Thégonnec, Traditional Breton houses |
| Pleyber-Christ | A hidden gem in Brittany with a peaceful environment and proximity to several natural sites. Ideal for those seeking tranquility and nature retreats. | Natural parks, Historic buildings, Peaceful countryside, Outdoor activities |
Understanding Airbnb License Requirements & STR Laws in Plougonven (2025)
With 15% of listings showing registration in 2025, understanding potential Airbnb license requirements is crucial in Plougonven. Always verify the latest short term rental regulations and Airbnb license requirements directly with local government authorities for Plougonven to ensure full compliance before hosting.
(Source: AirROI data, 2025, based on 15% licensed listings)
Top Performing Airbnb Properties in Plougonven (2025)
Benchmark your potential! Explore examples of top-performing Airbnb properties in Plougonvenbased on Trailing Twelve Month (TTM) revenue. Analyze their characteristics, revenue, occupancy rate, and ADR to understand what drives success in this market.
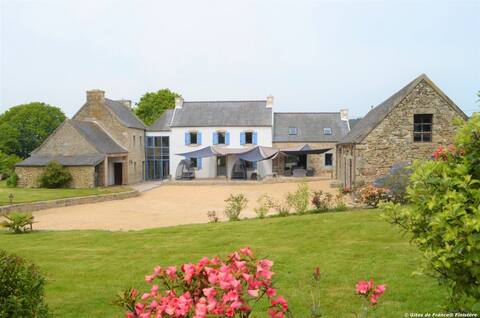
Large luxury property with 2 SPAS and billiards
Entire Place • 7 bedrooms
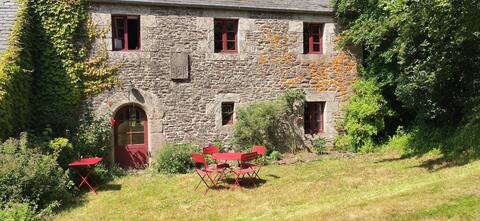
Gite in a green setting
Entire Place • 2 bedrooms

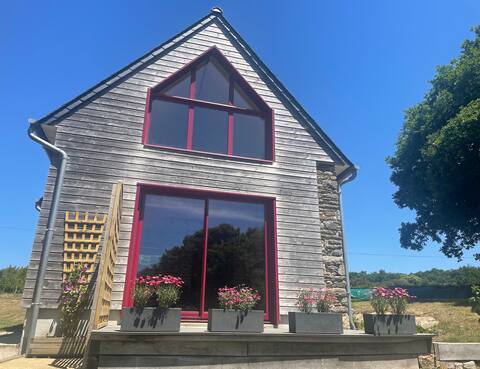
Morlaix Bay House in the heart of nature, with SPA
Entire Place • 3 bedrooms

House in a wooded lot
Entire Place • 3 bedrooms
Gite in Pontaléguen
Entire Place • 2 bedrooms

Country house on one level.
Entire Place • 2 bedrooms
Note: Performance varies based on location, size, amenities, seasonality, and management quality. Data reflects the past 12 months.
Top Performing Airbnb Hosts in Plougonven (2025)
Learn from the best! This table showcases top-performing Airbnb hosts in Plougonven based on the number of properties managed and estimated total revenue over the past year. Analyze their scale and performance metrics.
| Host Name | Properties | Grossing Revenue | Stay Reviews | Avg Rating |
|---|---|---|---|---|
| Isabelle | 1 | $51,383 | 20 | 4.95/5.0 |
| Benoit | 1 | $17,966 | 10 | 4.80/5.0 |
| Claire | 2 | $17,471 | 62 | 4.92/5.0 |
| Yoann | 2 | $15,659 | 14 | 4.62/5.0 |
| Christiane | 1 | $14,937 | 13 | 5.00/5.0 |
| Pascale | 1 | $14,597 | 144 | 4.85/5.0 |
| Mikael Et Perrine | 1 | $14,556 | 30 | 4.97/5.0 |
| Jean Jacques | 1 | $14,057 | 156 | 4.86/5.0 |
| Nathalie | 1 | $6,200 | 99 | 4.63/5.0 |
| Renée | 1 | $5,656 | 10 | 4.90/5.0 |
Analyzing the strategies of top hosts, such as their property selection, pricing, and guest communication, can offer valuable lessons for optimizing your own Airbnb operations in Plougonven.
Dive Deeper: Advanced Plougonven STR Market Data (2025)
Ready to unlock more insights? AirROI provides access to advanced metrics and comprehensive Airbnb data for Plougonven. Explore detailed analytics beyond this report to refine your investment strategy, optimize pricing, and maximize your vacation rental profits.
Explore Advanced MetricsPlougonven Short-Term Rental Market Composition (2025): Property & Room Types
Room Type Distribution
Property Type Distribution
Market Composition Insights for Plougonven
- The Plougonven Airbnb market composition is heavily skewed towards Entire Home/Apt listings, which make up 100% of the 20 active rentals. This indicates strong guest preference for privacy and space.
- Looking at the property type distribution in Plougonven, House properties are the most common (75%), reflecting the local real estate landscape.
- Houses represent a significant 75% portion, catering likely to families or larger groups.
- The presence of 10% Hotel/Boutique listings indicates integration with traditional hospitality.
Plougonven Airbnb Room Capacity Analysis (2025): Bedroom Distribution
Distribution of Listings by Number of Bedrooms
Room Capacity Insights for Plougonven
- The dominant room capacity in Plougonven is 2 bedrooms listings, making up 35% of the market. This suggests a strong demand for properties suitable for couples or solo travelers.
- Together, 2 bedrooms and 1 bedroom properties represent 65.0% of the active Airbnb listings in Plougonven, indicating a high concentration in these sizes.
- A significant 35.0% of listings offer 3+ bedrooms, catering to larger groups and families seeking more space in Plougonven.
Plougonven Vacation Rental Guest Capacity Trends (2025)
Distribution of Listings by Guest Capacity
Guest Capacity Insights for Plougonven
- The most common guest capacity trend in Plougonven vacation rentals is listings accommodating 4 guests (30%). This suggests the primary traveler segment is likely small families or groups.
- Properties designed for 4 guests and 5 guests dominate the Plougonven STR market, accounting for 55.0% of listings.
- 30.0% of properties accommodate 6+ guests, serving the market segment for larger families or group travel in Plougonven.
- On average, properties in Plougonven are equipped to host 4.8 guests.
Plougonven Airbnb Booking Patterns (2025): Available vs. Booked Days
Available Days Distribution
Booked Days Distribution
Booking Pattern Insights for Plougonven
- The most common availability pattern in Plougonven falls within the 271-366 days range, representing 55% of listings. This suggests many properties have significant open periods on their calendars.
- Approximately 95.0% of listings show high availability (181+ days open annually), indicating potential for increased bookings or specific owner usage patterns.
- For booked days, the 31-90 days range is most frequent in Plougonven (40%), reflecting common guest stay durations or potential owner blocking patterns.
- A notable 5.0% of properties secure long booking periods (181+ days booked per year), highlighting successful long-term rental strategies or significant owner usage.
Plougonven Airbnb Minimum Stay Requirements Analysis
Distribution of Listings by Minimum Night Requirement
1 Night
1 listings
5% of total
2 Nights
10 listings
50% of total
3 Nights
2 listings
10% of total
4-6 Nights
4 listings
20% of total
7-29 Nights
2 listings
10% of total
30+ Nights
1 listings
5% of total
Key Insights
- The most prevalent minimum stay requirement in Plougonven is 2 Nights, adopted by 50% of listings. This highlights the market's preference for shorter, flexible bookings.
Recommendations
- Align with the market by considering a 2 Nights minimum stay, as 50% of Plougonven hosts use this setting.
- If feasible, allowing 1-night stays, especially midweek or during low season, could capture last-minute bookings, as only 5% currently do.
- A 2-night minimum appears standard (50%). Consider this for weekends or peak periods.
- Adjust minimum nights based on seasonality – potentially shorter during low season and longer during peak demand periods in Plougonven.
Plougonven Airbnb Cancellation Policy Trends Analysis (2025)
Flexible
5 listings
25% of total
Moderate
6 listings
30% of total
Firm
5 listings
25% of total
Strict
4 listings
20% of total
Cancellation Policy Insights for Plougonven
- The prevailing Airbnb cancellation policy trend in Plougonven is Moderate, used by 30% of listings.
- There's a relatively balanced mix between guest-friendly (55.0%) and stricter (45.0%) policies, offering choices for different guest needs.
Recommendations for Hosts
- Consider adopting a Moderate policy to align with the 30% market standard in Plougonven.
- Regularly review your cancellation policy against competitors and market demand shifts in Plougonven.
Plougonven STR Booking Lead Time Analysis (2025)
Average Booking Lead Time by Month
Booking Lead Time Insights for Plougonven
- The overall average booking lead time for vacation rentals in Plougonven is 51 days.
- Guests book furthest in advance for stays during July (average 122 days), likely coinciding with peak travel demand or local events.
- The shortest booking windows occur for stays in November (average 33 days), indicating more last-minute travel plans during this time.
- Seasonally, Summer (96 days avg.) sees the longest lead times, while Fall (48 days avg.) has the shortest, reflecting typical travel planning cycles.
Recommendations for Hosts
- Use the overall average lead time (51 days) as a baseline for your pricing and availability strategy in Plougonven.
- For July stays, consider implementing length-of-stay discounts or slightly higher rates for bookings made less than 122 days out to capitalize on advance planning.
- Target marketing efforts for the Summer season well in advance (at least 96 days) to capture early planners.
- Monitor your own booking lead times against these Plougonven averages to identify opportunities for dynamic pricing adjustments.
Popular & Essential Airbnb Amenities in Plougonven (2025)
Amenity Prevalence
Amenity Insights for Plougonven
- Essential amenities in Plougonven that guests expect include: Refrigerator, Kitchen, Hair dryer, Dishes and silverware, Coffee maker, Cooking basics, Free parking on premises, Oven, Backyard, BBQ grill. Lacking these (any) could significantly impact bookings.
Recommendations for Hosts
- Ensure your listing includes all essential amenities for Plougonven: Refrigerator, Kitchen, Hair dryer, Dishes and silverware, Coffee maker, Cooking basics, Free parking on premises, Oven, Backyard, BBQ grill.
- Prioritize adding missing essentials: Oven, Backyard, BBQ grill.
- Highlight unique or less common amenities you offer (e.g., hot tub, dedicated workspace, EV charger) in your listing description and photos.
- Regularly check competitor amenities in Plougonven to stay competitive.
Plougonven Airbnb Guest Demographics & Profile Analysis (2025)
Guest Profile Summary for Plougonven
- The typical guest profile for Airbnb in Plougonven consists of primarily domestic travelers (75%), often arriving from nearby Paris, typically belonging to the Post-2000s (Gen Z/Alpha) group (50%), primarily speaking French or English.
- Domestic travelers account for 75.3% of guests.
- Key international markets include France (75.3%) and United Kingdom (6.5%).
- Top languages spoken are French (47%) followed by English (33.3%).
- A significant demographic segment is the Post-2000s (Gen Z/Alpha) group, representing 50% of guests.
Recommendations for Hosts
- Target domestic marketing efforts towards travelers from Paris and Nantes.
- Tailor amenities and listing descriptions to appeal to the dominant Post-2000s (Gen Z/Alpha) demographic (e.g., highlight fast WiFi, smart home features, local guides).
- Highlight unique local experiences or amenities relevant to the primary guest profile.
- Consider seasonal promotions aligned with peak travel times for key origin markets.
Nearby Short-Term Rental Market Comparison
How does the Plougonven Airbnb market stack up against its neighbors? Compare key performance metrics like average monthly revenue, ADR, and occupancy rates in surrounding areas to understand the broader regional STR landscape.
| Market | Active Properties | Monthly Revenue | Daily Rate | Avg. Occupancy |
|---|---|---|---|---|
| St Martin | 14 | $4,074 | $436.70 | 51% |
| Saint Lawrence | 11 | $2,911 | $317.86 | 52% |
| St Ouen | 15 | $2,635 | $339.51 | 51% |
| St Clement | 14 | $2,522 | $219.76 | 51% |
| Grouville | 21 | $2,510 | $218.40 | 52% |
| St Helier | 66 | $2,497 | $216.70 | 56% |
| St Saviour | 20 | $2,432 | $199.42 | 54% |
| Île-de-Bréhat | 46 | $2,254 | $221.52 | 45% |
| Trinity | 12 | $2,208 | $156.98 | 61% |
| St Brelade | 49 | $2,206 | $205.10 | 53% |