Plouescat Airbnb Market Analysis 2025: Short Term Rental Data & Vacation Rental Statistics in Brittany, France
Is Airbnb profitable in Plouescat in 2025? Explore comprehensive Airbnb analytics for Plouescat, Brittany, France to uncover income potential. This 2025 STR market report for Plouescat, based on AirROI data from April 2024 to March 2025, reveals key trends in the niche market of 149 active listings.
Whether you're considering an Airbnb investment in Plouescat, optimizing your existing vacation rental, or exploring rental arbitrage opportunities, understanding the Plouescat Airbnb data is crucial. Understanding the local regulations is key to maximizing your short term rental income potential. Let's dive into the specifics.
Key Plouescat Airbnb Performance Metrics Overview
Monthly Airbnb Revenue Variations & Income Potential in Plouescat (2025)
Understanding the monthly revenue variations for Airbnb listings in Plouescat is key to maximizing your short term rental income potential. Seasonality significantly impacts earnings. Our analysis, based on data from the past 12 months, shows that the peak revenue month for STRs in Plouescat is typically August, while March often presents the lowest earnings, highlighting opportunities for strategic pricing adjustments during shoulder and low seasons. Explore the typical Airbnb income in Plouescat across different performance tiers:
- Best-in-class properties (Top 10%) achieve $3,885+ monthly, often utilizing dynamic pricing and superior guest experiences.
- Strong performing properties (Top 25%) earn $2,258 or more, indicating effective management and desirable locations/amenities.
- Typical properties (Median) generate around $1,389 per month, representing the average market performance.
- Entry-level properties (Bottom 25%) see earnings around $773, often with potential for optimization.
Average Monthly Airbnb Earnings Trend in Plouescat
Plouescat Airbnb Occupancy Rate Trends (2025)
Maximize your bookings by understanding the Plouescat STR occupancy trends. Seasonal demand shifts significantly influence how often properties are booked. Typically, Augustsees the highest demand (peak season occupancy), while January experiences the lowest (low season). Effective strategies, like adjusting minimum stays or offering promotions, can boost occupancy during slower periods. Here's how different property tiers perform in Plouescat:
- Best-in-class properties (Top 10%) achieve 73%+ occupancy, indicating high desirability and potentially optimized availability.
- Strong performing properties (Top 25%) maintain 56% or higher occupancy, suggesting good market fit and guest satisfaction.
- Typical properties (Median) have an occupancy rate around 35%.
- Entry-level properties (Bottom 25%) average 19% occupancy, potentially facing higher vacancy.
Average Monthly Occupancy Rate Trend in Plouescat
Average Daily Rate (ADR) Airbnb Trends in Plouescat (2025)
Effective short term rental pricing strategy in Plouescat involves understanding monthly ADR fluctuations. The Average Daily Rate (ADR) for Airbnb in Plouescat typically peaks in July and dips lowest during March. Leveraging Airbnb dynamic pricing tools or strategies based on this seasonality can significantly boost revenue. Here's a look at the typical nightly rates achieved:
- Best-in-class properties (Top 10%) command rates of $272+ per night, often due to premium features or locations.
- Strong performing properties (Top 25%) achieve nightly rates of $178 or more.
- Typical properties (Median) charge around $117 per night.
- Entry-level properties (Bottom 25%) earn around $85 per night.
Average Daily Rate (ADR) Trend by Month in Plouescat
Get Live Plouescat Market Intelligence 👇

Explore Real-time Analytics
Airbnb Seasonality Analysis & Trends in Plouescat (2025)
Peak Season (August, July, May)
- Revenue averages $3,032 per month
- Occupancy rates average 55.0%
- Daily rates average $161
Shoulder Season
- Revenue averages $1,787 per month
- Occupancy maintains around 36.4%
- Daily rates hold near $147
Low Season (January, March, November)
- Revenue drops to average $1,032 per month
- Occupancy decreases to average 25.2%
- Daily rates adjust to average $137
Seasonality Insights for Plouescat
- The Airbnb seasonality in Plouescat shows highly seasonal trends requiring careful strategy. While the sections above show seasonal averages, it's also insightful to look at the extremes:
- During the high season, the absolute peak month showcases Plouescat's highest earning potential, with monthly revenues capable of climbing to $3,599, occupancy reaching a high of 65.6%, and ADRs peaking at $167.
- Conversely, the slowest single month of the year, typically falling within the low season, marks the market's lowest point. In this month, revenue might dip to $943, occupancy could drop to 21.1%, and ADRs may adjust down to $134.
- Understanding both the seasonal averages and these monthly peaks and troughs in revenue, occupancy, and ADR is crucial for maximizing your Airbnb profit potential in Plouescat.
Seasonal Strategies for Maximizing Profit
- Peak Season: Maximize revenue through premium pricing and potentially longer minimum stays. Ensure high availability.
- Low Season: Offer competitive pricing, special promotions (e.g., extended stay discounts), and flexible cancellation policies. Target off-season travelers like remote workers or budget-conscious guests.
- Shoulder Seasons: Implement dynamic pricing that balances peak and low rates. Target weekend travelers or specific events. Offer slightly more flexible terms than peak season.
- Regularly analyze your own performance against these Plouescat seasonality benchmarks and adjust your pricing and availability strategy accordingly.
Best Areas for Airbnb Investment in Plouescat (2025)
Exploring the top neighborhoods for short-term rentals in Plouescat? This section highlights key areas, outlining why they are attractive for hosts and guests, along with notable local attractions. Consider these locations based on your target guest profile and investment strategy.
| Neighborhood / Area | Why Host Here? (Target Guests & Appeal) | Key Attractions & Landmarks |
|---|---|---|
| Plage de Porsguen | A stunning beach known for its golden sand and clear waters, popular with families and beach lovers. Ideal for summer rentals due to its picturesque scenery and accessibility to local amenities. | Porsguen Beach, Coastal Trails, Local Seafood Restaurants |
| Plage de Kerou | Another beautiful beach, perfect for surfers and sunbathers alike. Its vibrant atmosphere and proximity to water sports make it appealing for young travelers. | Kerou Beach, Surfing Schools, Beach Bars |
| Historic Center of Plouescat | Featuring charming streets, local shops, and historical sites, this area attracts tourists who want to experience authentic Breton culture. | Church of Saint-Erosion, Local Markets, Cafes and Bistros |
| Dunes de Keremma | A natural reserve with stunning dunes and rich biodiversity, perfect for nature lovers and outdoor activities. Ideal for ecotourism and hiking enthusiasts. | Walking Trails, Birdwatching, Natural Beauty |
| Plage de Les Amiets | A calm beach, less crowded and perfect for relaxation. It appeals to couples and travelers looking for peace and tranquility. | Secluded Coves, Picnic Areas, Scenic Views |
| Port de Plouescat | The local harbor area with fishing activities, offering a glimpse into traditional Breton life. Great for foodies looking to taste fresh catches of the day. | Fishing Demos, Seafood Restaurants, Harbor Walks |
| Near the Chapel of Saint-Anne | This historical site attracts visitors interested in local heritage and religious history, increasing potential for cultural tourism. | Saint-Anne Chapel, Local Festivals, Art Exhibits |
| Market Area | Local markets in Plouescat occur weekly and showcase regional produce and crafts. An energetic spot that draws locals and tourists alike for authentic experiences. | Weekly Farmer's Market, Local Crafts, Food Samples |
Understanding Airbnb License Requirements & STR Laws in Plouescat (2025)
With 26% of listings showing registration in 2025, understanding potential Airbnb license requirements is crucial in Plouescat. Always verify the latest short term rental regulations and Airbnb license requirements directly with local government authorities for Plouescat to ensure full compliance before hosting.
(Source: AirROI data, 2025, based on 26% licensed listings)
Top Performing Airbnb Properties in Plouescat (2025)
Benchmark your potential! Explore examples of top-performing Airbnb properties in Plouescatbased on Trailing Twelve Month (TTM) revenue. Analyze their characteristics, revenue, occupancy rate, and ADR to understand what drives success in this market.
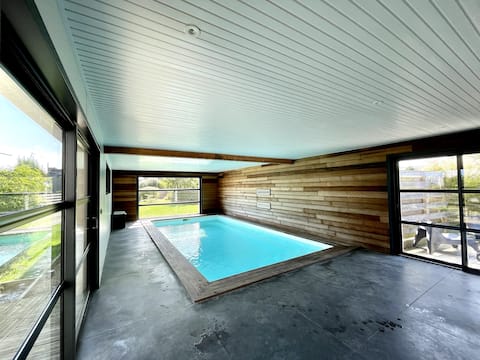
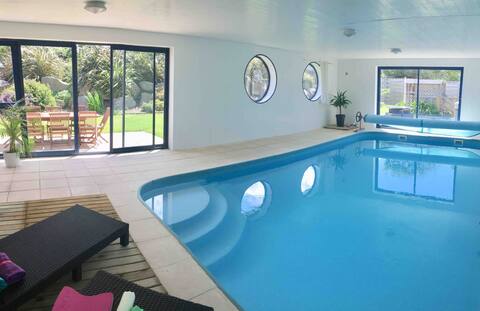
Villa Keremberr - Finistere - Indoor swimming pool
Entire Place • 4 bedrooms
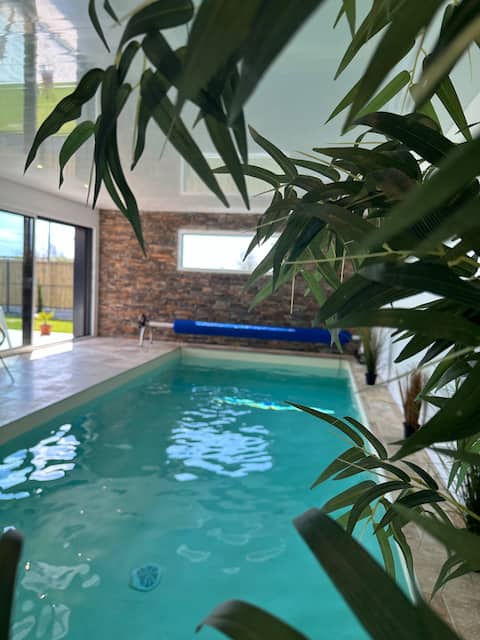
Villa Pool and Beach Bretagne, piscine intérieure
Entire Place • 4 bedrooms
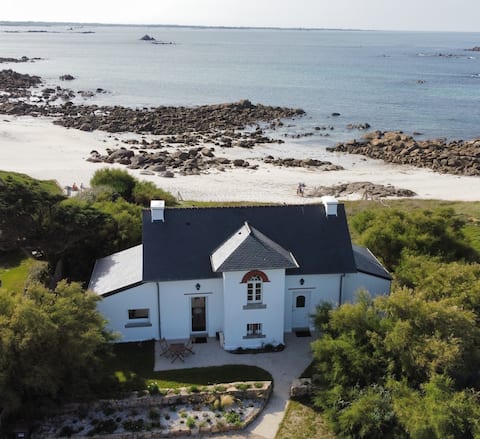
Villa Les Mouettes sea view, SAUNA, beach access
Entire Place • 3 bedrooms
Private Porsguen Pool Cottage
Entire Place • 3 bedrooms
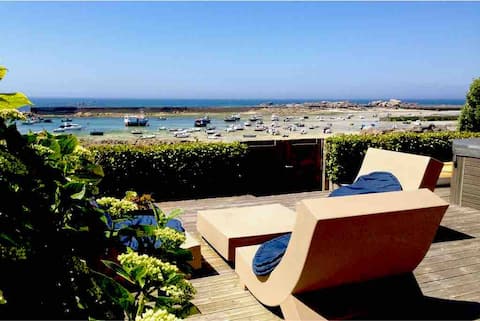
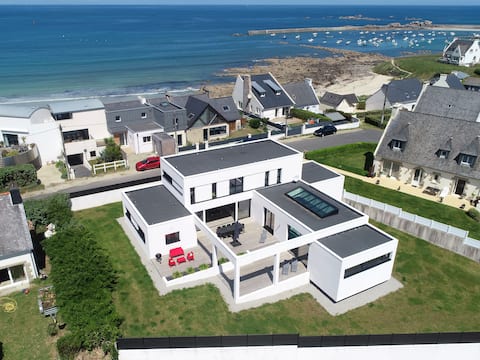
Le Paradis Bleu, a waterfront home!
Entire Place • 4 bedrooms
Villa 4* SPA/Private Pool/Beach 200 m away
Entire Place • 4 bedrooms
Note: Performance varies based on location, size, amenities, seasonality, and management quality. Data reflects the past 12 months.
Top Performing Airbnb Hosts in Plouescat (2025)
Learn from the best! This table showcases top-performing Airbnb hosts in Plouescat based on the number of properties managed and estimated total revenue over the past year. Analyze their scale and performance metrics.
| Host Name | Properties | Grossing Revenue | Stay Reviews | Avg Rating |
|---|---|---|---|---|
| Eva | 1 | $142,354 | 14 | 4.93/5.0 |
| Erwan | 6 | $92,118 | 301 | 4.93/5.0 |
| Ludovic | 2 | $84,605 | 39 | 4.91/5.0 |
| Aurélie Et Régis | 2 | $83,901 | 43 | 4.98/5.0 |
| Christian | 8 | $80,998 | 10 | 1.23/5.0 |
| Magali | 2 | $65,416 | 8 | 2.50/5.0 |
| Delphine | 1 | $64,348 | 28 | 4.96/5.0 |
| Anne | 1 | $59,050 | 37 | 5.00/5.0 |
| Isabelle | 1 | $54,415 | 98 | 4.79/5.0 |
| Michelle | 2 | $45,882 | 6 | 2.50/5.0 |
Analyzing the strategies of top hosts, such as their property selection, pricing, and guest communication, can offer valuable lessons for optimizing your own Airbnb operations in Plouescat.
Dive Deeper: Advanced Plouescat STR Market Data (2025)
Ready to unlock more insights? AirROI provides access to advanced metrics and comprehensive Airbnb data for Plouescat. Explore detailed analytics beyond this report to refine your investment strategy, optimize pricing, and maximize your vacation rental profits.
Explore Advanced MetricsPlouescat Short-Term Rental Market Composition (2025): Property & Room Types
Room Type Distribution
Property Type Distribution
Market Composition Insights for Plouescat
- The Plouescat Airbnb market composition is heavily skewed towards Entire Home/Apt listings, which make up 89.3% of the 149 active rentals. This indicates strong guest preference for privacy and space.
- Looking at the property type distribution in Plouescat, House properties are the most common (81.2%), reflecting the local real estate landscape.
- Houses represent a significant 81.2% portion, catering likely to families or larger groups.
- The presence of 10.1% Hotel/Boutique listings indicates integration with traditional hospitality.
- Smaller segments like apartment/condo, others, outdoor/unique (combined 8.7%) offer potential for unique stay experiences.
Plouescat Airbnb Room Capacity Analysis (2025): Bedroom Distribution
Distribution of Listings by Number of Bedrooms
Room Capacity Insights for Plouescat
- The dominant room capacity in Plouescat is 3 bedrooms listings, making up 32.9% of the market. This suggests a strong demand for properties suitable for families or small groups.
- Together, 3 bedrooms and 2 bedrooms properties represent 58.4% of the active Airbnb listings in Plouescat, indicating a high concentration in these sizes.
- A significant 60.4% of listings offer 3+ bedrooms, catering to larger groups and families seeking more space in Plouescat.
Plouescat Vacation Rental Guest Capacity Trends (2025)
Distribution of Listings by Guest Capacity
Guest Capacity Insights for Plouescat
- The most common guest capacity trend in Plouescat vacation rentals is listings accommodating 6 guests (28.9%). This suggests the primary traveler segment is likely larger groups.
- Properties designed for 6 guests and 8+ guests dominate the Plouescat STR market, accounting for 54.4% of listings.
- 59.1% of properties accommodate 6+ guests, serving the market segment for larger families or group travel in Plouescat.
- On average, properties in Plouescat are equipped to host 5.4 guests.
Plouescat Airbnb Booking Patterns (2025): Available vs. Booked Days
Available Days Distribution
Booked Days Distribution
Booking Pattern Insights for Plouescat
- The most common availability pattern in Plouescat falls within the 271-366 days range, representing 52.3% of listings. This suggests many properties have significant open periods on their calendars.
- Approximately 85.2% of listings show high availability (181+ days open annually), indicating potential for increased bookings or specific owner usage patterns.
- For booked days, the 91-180 days range is most frequent in Plouescat (34.2%), reflecting common guest stay durations or potential owner blocking patterns.
- A notable 16.1% of properties secure long booking periods (181+ days booked per year), highlighting successful long-term rental strategies or significant owner usage.
Plouescat Airbnb Minimum Stay Requirements Analysis
Distribution of Listings by Minimum Night Requirement
1 Night
18 listings
12.9% of total
2 Nights
23 listings
16.5% of total
3 Nights
22 listings
15.8% of total
4-6 Nights
32 listings
23% of total
7-29 Nights
36 listings
25.9% of total
30+ Nights
8 listings
5.8% of total
Key Insights
- The most prevalent minimum stay requirement in Plouescat is 7-29 Nights, adopted by 25.9% of listings. This highlights the market's preference for shorter, flexible bookings.
Recommendations
- Align with the market by considering a 7-29 Nights minimum stay, as 25.9% of Plouescat hosts use this setting.
- If feasible, allowing 1-night stays, especially midweek or during low season, could capture last-minute bookings, as only 12.9% currently do.
- Explore offering discounts for stays of 30+ nights to attract the 5.8% of the market seeking extended stays.
- Adjust minimum nights based on seasonality – potentially shorter during low season and longer during peak demand periods in Plouescat.
Plouescat Airbnb Cancellation Policy Trends Analysis (2025)
Super Strict 30 Days
3 listings
2.3% of total
Flexible
18 listings
14.1% of total
Moderate
27 listings
21.1% of total
Firm
36 listings
28.1% of total
Strict
44 listings
34.4% of total
Cancellation Policy Insights for Plouescat
- The prevailing Airbnb cancellation policy trend in Plouescat is Strict, used by 34.4% of listings.
- A majority (62.5%) of hosts in Plouescat utilize Firm or Strict policies, indicating a market where hosts prioritize booking security.
Recommendations for Hosts
- Consider adopting a Strict policy to align with the 34.4% market standard in Plouescat.
- With 34.4% using Strict terms, this is a viable option in Plouescat, particularly for high-value properties or during peak demand periods.
- Regularly review your cancellation policy against competitors and market demand shifts in Plouescat.
Plouescat STR Booking Lead Time Analysis (2025)
Average Booking Lead Time by Month
Booking Lead Time Insights for Plouescat
- The overall average booking lead time for vacation rentals in Plouescat is 72 days.
- Guests book furthest in advance for stays during July (average 136 days), likely coinciding with peak travel demand or local events.
- The shortest booking windows occur for stays in November (average 47 days), indicating more last-minute travel plans during this time.
- Seasonally, Summer (124 days avg.) sees the longest lead times, while Winter (56 days avg.) has the shortest, reflecting typical travel planning cycles.
Recommendations for Hosts
- Use the overall average lead time (72 days) as a baseline for your pricing and availability strategy in Plouescat.
- For July stays, consider implementing length-of-stay discounts or slightly higher rates for bookings made less than 136 days out to capitalize on advance planning.
- Target marketing efforts for the Summer season well in advance (at least 124 days) to capture early planners.
- Monitor your own booking lead times against these Plouescat averages to identify opportunities for dynamic pricing adjustments.
Popular & Essential Airbnb Amenities in Plouescat (2025)
Amenity Prevalence
Amenity Insights for Plouescat
- Essential amenities in Plouescat that guests expect include: Free parking on premises, Heating. Lacking these (any) could significantly impact bookings.
- Popular amenities like Hot water, TV, Kitchen are common but not universal. Offering these can provide a competitive edge.
- Warning: Wifi is not universally provided but is considered essential globally. Ensure reliable Wifi is offered.
Recommendations for Hosts
- Ensure your listing includes all essential amenities for Plouescat: Free parking on premises, Heating.
- Prioritize adding missing essentials: Free parking on premises, Heating.
- Consider adding popular differentiators like Hot water or TV to increase appeal.
- Highlight unique or less common amenities you offer (e.g., hot tub, dedicated workspace, EV charger) in your listing description and photos.
- Regularly check competitor amenities in Plouescat to stay competitive.
Plouescat Airbnb Guest Demographics & Profile Analysis (2025)
Guest Profile Summary for Plouescat
- The typical guest profile for Airbnb in Plouescat consists of primarily domestic travelers (73%), often arriving from nearby Paris, typically belonging to the Post-2000s (Gen Z/Alpha) group (50%), primarily speaking French or English.
- Domestic travelers account for 73.4% of guests.
- Key international markets include France (73.4%) and Germany (10.4%).
- Top languages spoken are French (41.1%) followed by English (34.9%).
- A significant demographic segment is the Post-2000s (Gen Z/Alpha) group, representing 50% of guests.
Recommendations for Hosts
- Target domestic marketing efforts towards travelers from Paris and Rennes.
- Tailor amenities and listing descriptions to appeal to the dominant Post-2000s (Gen Z/Alpha) demographic (e.g., highlight fast WiFi, smart home features, local guides).
- Highlight unique local experiences or amenities relevant to the primary guest profile.
- Consider seasonal promotions aligned with peak travel times for key origin markets.
Nearby Short-Term Rental Market Comparison
How does the Plouescat Airbnb market stack up against its neighbors? Compare key performance metrics like average monthly revenue, ADR, and occupancy rates in surrounding areas to understand the broader regional STR landscape.
| Market | Active Properties | Monthly Revenue | Daily Rate | Avg. Occupancy |
|---|---|---|---|---|
| Île-de-Bréhat | 46 | $2,254 | $221.52 | 45% |
| Ushant | 64 | $2,087 | $152.83 | 54% |
| Lanmodez | 19 | $2,050 | $219.93 | 42% |
| Guern | 13 | $1,802 | $102.72 | 42% |
| Landaul | 17 | $1,697 | $148.36 | 45% |
| Plourin | 16 | $1,686 | $176.47 | 45% |
| Sainte-Brigitte | 11 | $1,652 | $164.87 | 39% |
| Langoat | 10 | $1,645 | $105.20 | 58% |
| Plounéour-Brignogan-Plages | 170 | $1,596 | $192.20 | 39% |
| Sibiril | 43 | $1,568 | $162.58 | 44% |