Pleurtuit Airbnb Market Analysis 2025: Short Term Rental Data & Vacation Rental Statistics in Brittany, France
Is Airbnb profitable in Pleurtuit in 2025? Explore comprehensive Airbnb analytics for Pleurtuit, Brittany, France to uncover income potential. This 2025 STR market report for Pleurtuit, based on AirROI data from April 2024 to March 2025, reveals key trends in the niche market of 102 active listings.
Whether you're considering an Airbnb investment in Pleurtuit, optimizing your existing vacation rental, or exploring rental arbitrage opportunities, understanding the Pleurtuit Airbnb data is crucial. Leveraging the low regulation environment is key to maximizing your short term rental income potential. Let's dive into the specifics.
Key Pleurtuit Airbnb Performance Metrics Overview
Monthly Airbnb Revenue Variations & Income Potential in Pleurtuit (2025)
Understanding the monthly revenue variations for Airbnb listings in Pleurtuit is key to maximizing your short term rental income potential. Seasonality significantly impacts earnings. Our analysis, based on data from the past 12 months, shows that the peak revenue month for STRs in Pleurtuit is typically August, while March often presents the lowest earnings, highlighting opportunities for strategic pricing adjustments during shoulder and low seasons. Explore the typical Airbnb income in Pleurtuit across different performance tiers:
- Best-in-class properties (Top 10%) achieve $3,415+ monthly, often utilizing dynamic pricing and superior guest experiences.
- Strong performing properties (Top 25%) earn $1,941 or more, indicating effective management and desirable locations/amenities.
- Typical properties (Median) generate around $1,185 per month, representing the average market performance.
- Entry-level properties (Bottom 25%) see earnings around $645, often with potential for optimization.
Average Monthly Airbnb Earnings Trend in Pleurtuit
Pleurtuit Airbnb Occupancy Rate Trends (2025)
Maximize your bookings by understanding the Pleurtuit STR occupancy trends. Seasonal demand shifts significantly influence how often properties are booked. Typically, Augustsees the highest demand (peak season occupancy), while December experiences the lowest (low season). Effective strategies, like adjusting minimum stays or offering promotions, can boost occupancy during slower periods. Here's how different property tiers perform in Pleurtuit:
- Best-in-class properties (Top 10%) achieve 79%+ occupancy, indicating high desirability and potentially optimized availability.
- Strong performing properties (Top 25%) maintain 60% or higher occupancy, suggesting good market fit and guest satisfaction.
- Typical properties (Median) have an occupancy rate around 38%.
- Entry-level properties (Bottom 25%) average 22% occupancy, potentially facing higher vacancy.
Average Monthly Occupancy Rate Trend in Pleurtuit
Average Daily Rate (ADR) Airbnb Trends in Pleurtuit (2025)
Effective short term rental pricing strategy in Pleurtuit involves understanding monthly ADR fluctuations. The Average Daily Rate (ADR) for Airbnb in Pleurtuit typically peaks in July and dips lowest during March. Leveraging Airbnb dynamic pricing tools or strategies based on this seasonality can significantly boost revenue. Here's a look at the typical nightly rates achieved:
- Best-in-class properties (Top 10%) command rates of $216+ per night, often due to premium features or locations.
- Strong performing properties (Top 25%) achieve nightly rates of $137 or more.
- Typical properties (Median) charge around $91 per night.
- Entry-level properties (Bottom 25%) earn around $71 per night.
Average Daily Rate (ADR) Trend by Month in Pleurtuit
Get Live Pleurtuit Market Intelligence 👇

Explore Real-time Analytics
Airbnb Seasonality Analysis & Trends in Pleurtuit (2025)
Peak Season (August, July, June)
- Revenue averages $2,606 per month
- Occupancy rates average 58.3%
- Daily rates average $125
Shoulder Season
- Revenue averages $1,471 per month
- Occupancy maintains around 38.7%
- Daily rates hold near $119
Low Season (February, March, November)
- Revenue drops to average $895 per month
- Occupancy decreases to average 32.6%
- Daily rates adjust to average $114
Seasonality Insights for Pleurtuit
- The Airbnb seasonality in Pleurtuit shows highly seasonal trends requiring careful strategy. While the sections above show seasonal averages, it's also insightful to look at the extremes:
- During the high season, the absolute peak month showcases Pleurtuit's highest earning potential, with monthly revenues capable of climbing to $3,072, occupancy reaching a high of 73.6%, and ADRs peaking at $126.
- Conversely, the slowest single month of the year, typically falling within the low season, marks the market's lowest point. In this month, revenue might dip to $829, occupancy could drop to 29.9%, and ADRs may adjust down to $112.
- Understanding both the seasonal averages and these monthly peaks and troughs in revenue, occupancy, and ADR is crucial for maximizing your Airbnb profit potential in Pleurtuit.
Seasonal Strategies for Maximizing Profit
- Peak Season: Maximize revenue through premium pricing and potentially longer minimum stays. Ensure high availability.
- Low Season: Offer competitive pricing, special promotions (e.g., extended stay discounts), and flexible cancellation policies. Target off-season travelers like remote workers or budget-conscious guests.
- Shoulder Seasons: Implement dynamic pricing that balances peak and low rates. Target weekend travelers or specific events. Offer slightly more flexible terms than peak season.
- Regularly analyze your own performance against these Pleurtuit seasonality benchmarks and adjust your pricing and availability strategy accordingly.
Best Areas for Airbnb Investment in Pleurtuit (2025)
Exploring the top neighborhoods for short-term rentals in Pleurtuit? This section highlights key areas, outlining why they are attractive for hosts and guests, along with notable local attractions. Consider these locations based on your target guest profile and investment strategy.
| Neighborhood / Area | Why Host Here? (Target Guests & Appeal) | Key Attractions & Landmarks |
|---|---|---|
| Pleurtuit Centre | The heart of Pleurtuit, with charming streets and local shops. It's a prime location for visitors who want to experience the local culture and enjoy nearby attractions like the river. | Rance River, Local Cafes, Shops and Boutiques |
| Dinard Beach | Just a short distance from Pleurtuit, Dinard Beach is known for its stunning coastline and water activities. A popular destination for families and beach lovers visiting Brittany. | Dinard Beach, Promenade du Clair de Lune, Casino Barriere, Local seafood restaurants |
| Saint-Malo | Nearby historic port city with medieval architecture, attracting tourists for its rich history and vibrant nightlife. Close proximity to Pleurtuit makes it an ideal place for Airbnb. | Saint-Malo Citadel, Beaches, Grand Aquarium, Fort National, Intra-Muros |
| La Malouine | A residential area with beautiful views of the Rance, perfect for those seeking tranquility and nature. Ideal for guests looking for a peaceful retreat close to Pleurtuit. | Rance River Views, Walking Trails, Local Parks |
| Parame | A lively neighborhood of Dinard known for its shops, restaurants and proximity to the shoreline. It's great for visitors who want both urban amenities and beach access. | Plage de Parame, Local Markets, Cafés and Bakeries |
| Cancale | Famous for its seafood, especially oysters, and beautiful coastal views. A short drive from Pleurtuit, it attracts food enthusiasts and nature lovers alike. | Cancale Oysters, Coastal Paths, Local Seafood Restaurants |
| Bourg des Maisons | A quaint village feeling with proximity to both Pleurtuit and the coast. It offers visitors a unique local experience with easy access to attractions. | Local Farms, Market Days, Village Festivals |
| Espace Duguay-Trouin | A cultural hub near Dinard famous for events and exhibitions. It can attract art and culture enthusiasts, making it a great choice for Airbnb hosts. | Exhibitions, Cultural Events, Waterfront Restaurants |
Understanding Airbnb License Requirements & STR Laws in Pleurtuit (2025)
While Pleurtuit, Brittany, France currently shows low STR regulations, specific Airbnb license requirements might still exist or change. Always verify the latest short term rental regulations and Airbnb license requirements directly with local government authorities for Pleurtuit to ensure full compliance before hosting.
(Source: AirROI data, 2025, based on 7% licensed listings)
Top Performing Airbnb Properties in Pleurtuit (2025)
Benchmark your potential! Explore examples of top-performing Airbnb properties in Pleurtuitbased on Trailing Twelve Month (TTM) revenue. Analyze their characteristics, revenue, occupancy rate, and ADR to understand what drives success in this market.
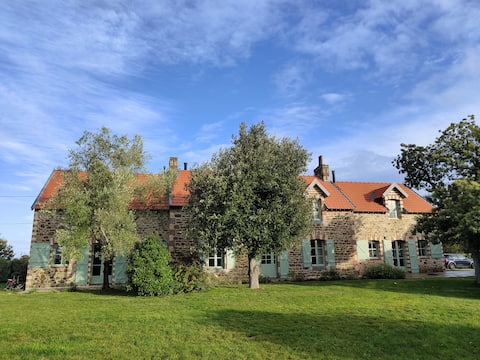
Maison - Les Petits Lapins
Entire Place • 5 bedrooms
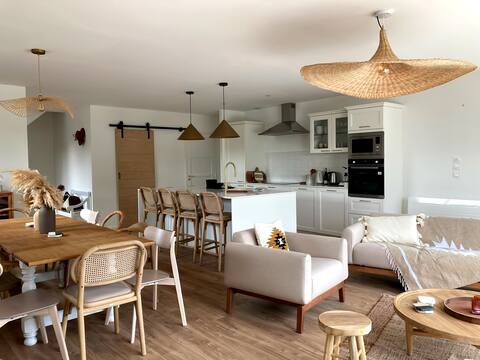
St Malo 15 min and 10 min from Dinard
Entire Place • 4 bedrooms
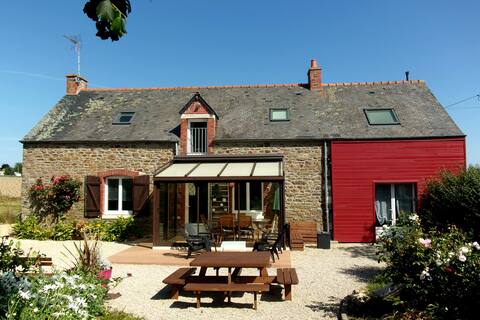
Family home for 14 people 5 minutes from Dinard
Entire Place • 6 bedrooms
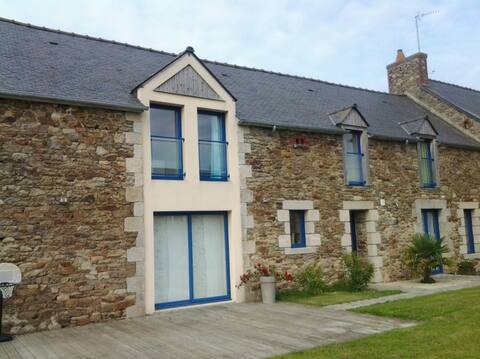
Longère 200m2 - near Dinard/Saint Malo
Entire Place • 5 bedrooms
Family home 5 minutes from Dinard
Entire Place • 5 bedrooms
Fully-equipped house near Dinard with SPA
Entire Place • 4 bedrooms
Note: Performance varies based on location, size, amenities, seasonality, and management quality. Data reflects the past 12 months.
Top Performing Airbnb Hosts in Pleurtuit (2025)
Learn from the best! This table showcases top-performing Airbnb hosts in Pleurtuit based on the number of properties managed and estimated total revenue over the past year. Analyze their scale and performance metrics.
| Host Name | Properties | Grossing Revenue | Stay Reviews | Avg Rating |
|---|---|---|---|---|
| Chrystel Et Rémy | 3 | $96,850 | 186 | 4.95/5.0 |
| Camille | 1 | $72,997 | 4 | 5.00/5.0 |
| Gaetan | 1 | $58,762 | 45 | 4.98/5.0 |
| Elodie | 2 | $55,291 | 141 | 4.85/5.0 |
| Julie | 2 | $53,069 | 84 | 4.74/5.0 |
| Eliza | 3 | $50,530 | 430 | 4.85/5.0 |
| Anne-Sophie - Interhome Group | 4 | $45,044 | 13 | 2.17/5.0 |
| Damien | 1 | $33,841 | 20 | 4.95/5.0 |
| Sarah | 1 | $33,673 | 4 | 5.00/5.0 |
| Guest Adom | 1 | $30,882 | 12 | 4.58/5.0 |
Analyzing the strategies of top hosts, such as their property selection, pricing, and guest communication, can offer valuable lessons for optimizing your own Airbnb operations in Pleurtuit.
Dive Deeper: Advanced Pleurtuit STR Market Data (2025)
Ready to unlock more insights? AirROI provides access to advanced metrics and comprehensive Airbnb data for Pleurtuit. Explore detailed analytics beyond this report to refine your investment strategy, optimize pricing, and maximize your vacation rental profits.
Explore Advanced MetricsPleurtuit Short-Term Rental Market Composition (2025): Property & Room Types
Room Type Distribution
Property Type Distribution
Market Composition Insights for Pleurtuit
- The Pleurtuit Airbnb market composition is heavily skewed towards Entire Home/Apt listings, which make up 87.3% of the 102 active rentals. This indicates strong guest preference for privacy and space.
- Looking at the property type distribution in Pleurtuit, House properties are the most common (57.8%), reflecting the local real estate landscape.
- Houses represent a significant 57.8% portion, catering likely to families or larger groups.
- The presence of 5.9% Hotel/Boutique listings indicates integration with traditional hospitality.
- Smaller segments like outdoor/unique, others (combined 6.9%) offer potential for unique stay experiences.
Pleurtuit Airbnb Room Capacity Analysis (2025): Bedroom Distribution
Distribution of Listings by Number of Bedrooms
Room Capacity Insights for Pleurtuit
- The dominant room capacity in Pleurtuit is 1 bedroom listings, making up 29.4% of the market. This suggests a strong demand for properties suitable for couples or solo travelers.
- Together, 1 bedroom and 2 bedrooms properties represent 53.9% of the active Airbnb listings in Pleurtuit, indicating a high concentration in these sizes.
- A significant 34.2% of listings offer 3+ bedrooms, catering to larger groups and families seeking more space in Pleurtuit.
Pleurtuit Vacation Rental Guest Capacity Trends (2025)
Distribution of Listings by Guest Capacity
Guest Capacity Insights for Pleurtuit
- The most common guest capacity trend in Pleurtuit vacation rentals is listings accommodating 4 guests (28.4%). This suggests the primary traveler segment is likely small families or groups.
- Properties designed for 4 guests and 8+ guests dominate the Pleurtuit STR market, accounting for 46.0% of listings.
- 32.3% of properties accommodate 6+ guests, serving the market segment for larger families or group travel in Pleurtuit.
- On average, properties in Pleurtuit are equipped to host 4.2 guests.
Pleurtuit Airbnb Booking Patterns (2025): Available vs. Booked Days
Available Days Distribution
Booked Days Distribution
Booking Pattern Insights for Pleurtuit
- The most common availability pattern in Pleurtuit falls within the 271-366 days range, representing 43.1% of listings. This suggests many properties have significant open periods on their calendars.
- Approximately 84.3% of listings show high availability (181+ days open annually), indicating potential for increased bookings or specific owner usage patterns.
- For booked days, the 91-180 days range is most frequent in Pleurtuit (43.1%), reflecting common guest stay durations or potential owner blocking patterns.
- A notable 16.7% of properties secure long booking periods (181+ days booked per year), highlighting successful long-term rental strategies or significant owner usage.
Pleurtuit Airbnb Minimum Stay Requirements Analysis
Distribution of Listings by Minimum Night Requirement
1 Night
24 listings
24.7% of total
2 Nights
29 listings
29.9% of total
3 Nights
15 listings
15.5% of total
4-6 Nights
18 listings
18.6% of total
7-29 Nights
6 listings
6.2% of total
30+ Nights
5 listings
5.2% of total
Key Insights
- The most prevalent minimum stay requirement in Pleurtuit is 2 Nights, adopted by 29.9% of listings. This highlights the market's preference for shorter, flexible bookings.
Recommendations
- Align with the market by considering a 2 Nights minimum stay, as 29.9% of Pleurtuit hosts use this setting.
- If feasible, allowing 1-night stays, especially midweek or during low season, could capture last-minute bookings, as only 24.7% currently do.
- Explore offering discounts for stays of 30+ nights to attract the 5.2% of the market seeking extended stays.
- Adjust minimum nights based on seasonality – potentially shorter during low season and longer during peak demand periods in Pleurtuit.
Pleurtuit Airbnb Cancellation Policy Trends Analysis (2025)
Flexible
21 listings
22.6% of total
Moderate
30 listings
32.3% of total
Firm
21 listings
22.6% of total
Strict
21 listings
22.6% of total
Cancellation Policy Insights for Pleurtuit
- The prevailing Airbnb cancellation policy trend in Pleurtuit is Moderate, used by 32.3% of listings.
- There's a relatively balanced mix between guest-friendly (54.9%) and stricter (45.2%) policies, offering choices for different guest needs.
Recommendations for Hosts
- Consider adopting a Moderate policy to align with the 32.3% market standard in Pleurtuit.
- Regularly review your cancellation policy against competitors and market demand shifts in Pleurtuit.
Pleurtuit STR Booking Lead Time Analysis (2025)
Average Booking Lead Time by Month
Booking Lead Time Insights for Pleurtuit
- The overall average booking lead time for vacation rentals in Pleurtuit is 56 days.
- Guests book furthest in advance for stays during July (average 94 days), likely coinciding with peak travel demand or local events.
- The shortest booking windows occur for stays in February (average 20 days), indicating more last-minute travel plans during this time.
- Seasonally, Summer (81 days avg.) sees the longest lead times, while Winter (31 days avg.) has the shortest, reflecting typical travel planning cycles.
Recommendations for Hosts
- Use the overall average lead time (56 days) as a baseline for your pricing and availability strategy in Pleurtuit.
- For July stays, consider implementing length-of-stay discounts or slightly higher rates for bookings made less than 94 days out to capitalize on advance planning.
- Target marketing efforts for the Summer season well in advance (at least 81 days) to capture early planners.
- Monitor your own booking lead times against these Pleurtuit averages to identify opportunities for dynamic pricing adjustments.
Popular & Essential Airbnb Amenities in Pleurtuit (2025)
Amenity Prevalence
Amenity Insights for Pleurtuit
- Popular amenities like Smoke alarm, Heating, Kitchen are common but not universal. Offering these can provide a competitive edge.
- Warning: Wifi is not universally provided but is considered essential globally. Ensure reliable Wifi is offered.
Recommendations for Hosts
- Consider adding popular differentiators like Smoke alarm or Heating to increase appeal.
- Highlight unique or less common amenities you offer (e.g., hot tub, dedicated workspace, EV charger) in your listing description and photos.
- Regularly check competitor amenities in Pleurtuit to stay competitive.
Pleurtuit Airbnb Guest Demographics & Profile Analysis (2025)
Guest Profile Summary for Pleurtuit
- The typical guest profile for Airbnb in Pleurtuit consists of primarily domestic travelers (86%), often arriving from nearby Paris, typically belonging to the Post-2000s (Gen Z/Alpha) group (50%), primarily speaking French or English.
- Domestic travelers account for 85.7% of guests.
- Key international markets include France (85.7%) and Germany (2.9%).
- Top languages spoken are French (44.9%) followed by English (32.1%).
- A significant demographic segment is the Post-2000s (Gen Z/Alpha) group, representing 50% of guests.
Recommendations for Hosts
- Target domestic marketing efforts towards travelers from Paris and Nantes.
- Tailor amenities and listing descriptions to appeal to the dominant Post-2000s (Gen Z/Alpha) demographic (e.g., highlight fast WiFi, smart home features, local guides).
- Highlight unique local experiences or amenities relevant to the primary guest profile.
- Consider seasonal promotions aligned with peak travel times for key origin markets.
Nearby Short-Term Rental Market Comparison
How does the Pleurtuit Airbnb market stack up against its neighbors? Compare key performance metrics like average monthly revenue, ADR, and occupancy rates in surrounding areas to understand the broader regional STR landscape.
| Market | Active Properties | Monthly Revenue | Daily Rate | Avg. Occupancy |
|---|---|---|---|---|
| St Martin | 14 | $4,074 | $436.70 | 51% |
| Saint Lawrence | 11 | $2,911 | $317.86 | 52% |
| St Ouen | 15 | $2,635 | $339.51 | 51% |
| St Clement | 14 | $2,522 | $219.76 | 51% |
| Grouville | 21 | $2,510 | $218.40 | 52% |
| St Helier | 66 | $2,497 | $216.70 | 56% |
| St Saviour | 20 | $2,432 | $199.42 | 54% |
| Tamerville | 10 | $2,338 | $333.77 | 26% |
| Île-de-Bréhat | 46 | $2,254 | $221.52 | 45% |
| Trinity | 12 | $2,208 | $156.98 | 61% |