Montauban-de-Bretagne Airbnb Market Analysis 2025: Short Term Rental Data & Vacation Rental Statistics in Brittany, France
Is Airbnb profitable in Montauban-de-Bretagne in 2025? Explore comprehensive Airbnb analytics for Montauban-de-Bretagne, Brittany, France to uncover income potential. This 2025 STR market report for Montauban-de-Bretagne, based on AirROI data from April 2024 to March 2025, reveals key trends in the niche market of 18 active listings.
Whether you're considering an Airbnb investment in Montauban-de-Bretagne, optimizing your existing vacation rental, or exploring rental arbitrage opportunities, understanding the Montauban-de-Bretagne Airbnb data is crucial. Leveraging the low regulation environment is key to maximizing your short term rental income potential. Let's dive into the specifics.
Key Montauban-de-Bretagne Airbnb Performance Metrics Overview
Monthly Airbnb Revenue Variations & Income Potential in Montauban-de-Bretagne (2025)
Understanding the monthly revenue variations for Airbnb listings in Montauban-de-Bretagne is key to maximizing your short term rental income potential. Seasonality significantly impacts earnings. Our analysis, based on data from the past 12 months, shows that the peak revenue month for STRs in Montauban-de-Bretagne is typically May, while February often presents the lowest earnings, highlighting opportunities for strategic pricing adjustments during shoulder and low seasons. Explore the typical Airbnb income in Montauban-de-Bretagne across different performance tiers:
- Best-in-class properties (Top 10%) achieve $1,759+ monthly, often utilizing dynamic pricing and superior guest experiences.
- Strong performing properties (Top 25%) earn $1,263 or more, indicating effective management and desirable locations/amenities.
- Typical properties (Median) generate around $733 per month, representing the average market performance.
- Entry-level properties (Bottom 25%) see earnings around $403, often with potential for optimization.
Average Monthly Airbnb Earnings Trend in Montauban-de-Bretagne
Montauban-de-Bretagne Airbnb Occupancy Rate Trends (2025)
Maximize your bookings by understanding the Montauban-de-Bretagne STR occupancy trends. Seasonal demand shifts significantly influence how often properties are booked. Typically, Augustsees the highest demand (peak season occupancy), while February experiences the lowest (low season). Effective strategies, like adjusting minimum stays or offering promotions, can boost occupancy during slower periods. Here's how different property tiers perform in Montauban-de-Bretagne:
- Best-in-class properties (Top 10%) achieve 74%+ occupancy, indicating high desirability and potentially optimized availability.
- Strong performing properties (Top 25%) maintain 55% or higher occupancy, suggesting good market fit and guest satisfaction.
- Typical properties (Median) have an occupancy rate around 34%.
- Entry-level properties (Bottom 25%) average 19% occupancy, potentially facing higher vacancy.
Average Monthly Occupancy Rate Trend in Montauban-de-Bretagne
Average Daily Rate (ADR) Airbnb Trends in Montauban-de-Bretagne (2025)
Effective short term rental pricing strategy in Montauban-de-Bretagne involves understanding monthly ADR fluctuations. The Average Daily Rate (ADR) for Airbnb in Montauban-de-Bretagne typically peaks in July and dips lowest during February. Leveraging Airbnb dynamic pricing tools or strategies based on this seasonality can significantly boost revenue. Here's a look at the typical nightly rates achieved:
- Best-in-class properties (Top 10%) command rates of $94+ per night, often due to premium features or locations.
- Strong performing properties (Top 25%) achieve nightly rates of $70 or more.
- Typical properties (Median) charge around $56 per night.
- Entry-level properties (Bottom 25%) earn around $37 per night.
Average Daily Rate (ADR) Trend by Month in Montauban-de-Bretagne
Get Live Montauban-de-Bretagne Market Intelligence 👇

Explore Real-time Analytics
Airbnb Seasonality Analysis & Trends in Montauban-de-Bretagne (2025)
Peak Season (May, April, June)
- Revenue averages $1,304 per month
- Occupancy rates average 39.5%
- Daily rates average $60
Shoulder Season
- Revenue averages $874 per month
- Occupancy maintains around 45.5%
- Daily rates hold near $58
Low Season (February, March, October)
- Revenue drops to average $510 per month
- Occupancy decreases to average 29.9%
- Daily rates adjust to average $55
Seasonality Insights for Montauban-de-Bretagne
- The Airbnb seasonality in Montauban-de-Bretagne shows highly seasonal trends requiring careful strategy. While the sections above show seasonal averages, it's also insightful to look at the extremes:
- During the high season, the absolute peak month showcases Montauban-de-Bretagne's highest earning potential, with monthly revenues capable of climbing to $1,454, occupancy reaching a high of 54.4%, and ADRs peaking at $60.
- Conversely, the slowest single month of the year, typically falling within the low season, marks the market's lowest point. In this month, revenue might dip to $311, occupancy could drop to 24.2%, and ADRs may adjust down to $53.
- Understanding both the seasonal averages and these monthly peaks and troughs in revenue, occupancy, and ADR is crucial for maximizing your Airbnb profit potential in Montauban-de-Bretagne.
Seasonal Strategies for Maximizing Profit
- Peak Season: Maximize revenue through premium pricing and potentially longer minimum stays. Ensure high availability.
- Low Season: Offer competitive pricing, special promotions (e.g., extended stay discounts), and flexible cancellation policies. Target off-season travelers like remote workers or budget-conscious guests.
- Shoulder Seasons: Implement dynamic pricing that balances peak and low rates. Target weekend travelers or specific events. Offer slightly more flexible terms than peak season.
- Regularly analyze your own performance against these Montauban-de-Bretagne seasonality benchmarks and adjust your pricing and availability strategy accordingly.
Best Areas for Airbnb Investment in Montauban-de-Bretagne (2025)
Exploring the top neighborhoods for short-term rentals in Montauban-de-Bretagne? This section highlights key areas, outlining why they are attractive for hosts and guests, along with notable local attractions. Consider these locations based on your target guest profile and investment strategy.
| Neighborhood / Area | Why Host Here? (Target Guests & Appeal) | Key Attractions & Landmarks |
|---|---|---|
| Historic Center | A charming area filled with medieval architecture and local shops. It's a perfect spot for tourists interested in culture and history, with easy access to important landmarks. | Saint-Jacques Church, Château de Montauban, Place Lapoix, Musee Ingres, Pont Vieux |
| Outdoor Activities | This area is known for its stunning natural surroundings and outdoor activities such as hiking and cycling. A great choice for nature lovers and adventure seekers. | Forest of Paimpont, Lac de Trémelin, Cycling paths, Hiking trails, Kayaking on the Vilaine |
| Gastronomy District | Montauban-de-Bretagne has a thriving food scene, offering local specialties and gourmet experiences. Perfect for foodies looking to explore regional cuisine. | Local markets, Restaurants offering Breton cuisine, Wine tasting events, Cooking classes |
| Family-Friendly Area | A welcoming area known for its parks and family attractions. Ideal for families visiting with children, providing a safe and entertaining environment. | Parc des Expositions, Children's playgrounds, Family-friendly cafes, Cultural workshops |
| Cultural Hub | Home to local arts and crafts, this area is popular among creative tourists looking to engage in workshops and local experiences. | Art galleries, Craft shops, Workshops for local crafts, Theatre performances |
| Events and Festivals | This area hosts various events and festivals throughout the year, attracting visitors looking for entertainment and local culture. | Annual Montauban Festival, Local music events, Craft fairs, Food festivals |
| Relaxation Zone | A peaceful area suited for travelers looking to unwind, featuring spas and wellness retreats. Ideal for those seeking relaxation and comfort. | Spas and Wellness Centers, Yoga retreats, Quiet parks, Leisure activities |
| Shopping District | A vibrant area with local boutiques and shops, perfect for tourists looking to shop for souvenirs and local products. | Local artisan shops, Market stalls, Shopping centers, Cafés nearby |
Understanding Airbnb License Requirements & STR Laws in Montauban-de-Bretagne (2025)
While Montauban-de-Bretagne, Brittany, France currently shows low STR regulations, specific Airbnb license requirements might still exist or change. Always verify the latest short term rental regulations and Airbnb license requirements directly with local government authorities for Montauban-de-Bretagne to ensure full compliance before hosting.
(Source: AirROI data, 2025, finding no licensed listings among those analyzed)
Top Performing Airbnb Properties in Montauban-de-Bretagne (2025)
Benchmark your potential! Explore examples of top-performing Airbnb properties in Montauban-de-Bretagnebased on Trailing Twelve Month (TTM) revenue. Analyze their characteristics, revenue, occupancy rate, and ADR to understand what drives success in this market.

Furniture studio of 45 m2
Entire Place • 1 bedroom
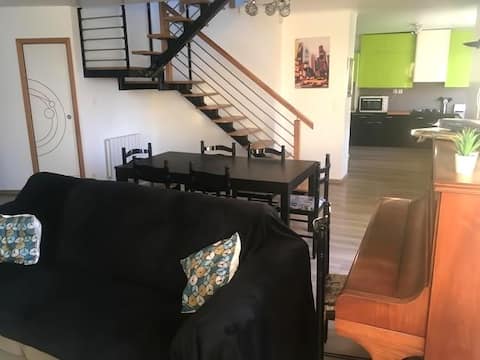
Centre town house
Entire Place • 3 bedrooms
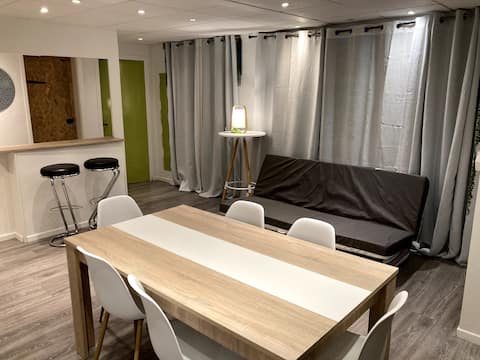
Centre Bourg apartment
Entire Place • 2 bedrooms
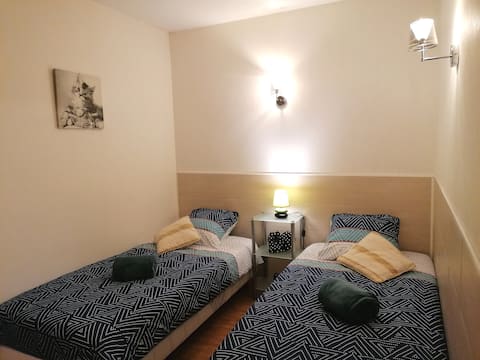
Studio
Entire Place • 1 bedroom

Thorin Apartment - Manor 17th
Entire Place • 1 bedroom
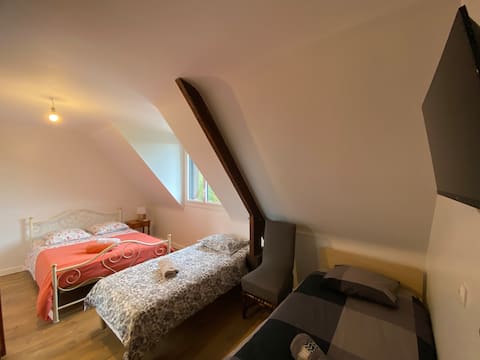
Pleasant room of 18 m2 in the house
Entire Place • 1 bedroom
Note: Performance varies based on location, size, amenities, seasonality, and management quality. Data reflects the past 12 months.
Top Performing Airbnb Hosts in Montauban-de-Bretagne (2025)
Learn from the best! This table showcases top-performing Airbnb hosts in Montauban-de-Bretagne based on the number of properties managed and estimated total revenue over the past year. Analyze their scale and performance metrics.
| Host Name | Properties | Grossing Revenue | Stay Reviews | Avg Rating |
|---|---|---|---|---|
| Anne Laure | 3 | $44,624 | 306 | 4.63/5.0 |
| Jean Yves | 3 | $42,517 | 65 | 4.72/5.0 |
| David | 2 | $19,870 | 178 | 4.97/5.0 |
| Lydia | 1 | $10,809 | 110 | 4.86/5.0 |
| Nathalie | 1 | $9,877 | 10 | 4.90/5.0 |
| Brigitte | 2 | $8,063 | 31 | 4.81/5.0 |
| Valérie | 1 | $6,874 | 73 | 4.99/5.0 |
| Céline | 2 | $2,585 | 46 | 4.84/5.0 |
| Host #453466638 | 1 | $1,564 | 0 | 0.00/5.0 |
| Jean Maurice | 1 | $903 | 9 | 4.44/5.0 |
Analyzing the strategies of top hosts, such as their property selection, pricing, and guest communication, can offer valuable lessons for optimizing your own Airbnb operations in Montauban-de-Bretagne.
Dive Deeper: Advanced Montauban-de-Bretagne STR Market Data (2025)
Ready to unlock more insights? AirROI provides access to advanced metrics and comprehensive Airbnb data for Montauban-de-Bretagne. Explore detailed analytics beyond this report to refine your investment strategy, optimize pricing, and maximize your vacation rental profits.
Explore Advanced MetricsMontauban-de-Bretagne Short-Term Rental Market Composition (2025): Property & Room Types
Room Type Distribution
Property Type Distribution
Market Composition Insights for Montauban-de-Bretagne
- The Montauban-de-Bretagne Airbnb market composition is heavily skewed towards Entire Home/Apt listings, which make up 50% of the 18 active rentals. This indicates strong guest preference for privacy and space.
- However, a notable 44.4% share for Private Rooms suggests opportunities for budget-conscious travelers or hosts renting out spare rooms.
- Looking at the property type distribution in Montauban-de-Bretagne, House properties are the most common (44.4%), reflecting the local real estate landscape.
- Houses represent a significant 44.4% portion, catering likely to families or larger groups.
- The presence of 16.7% Hotel/Boutique listings indicates integration with traditional hospitality.
Montauban-de-Bretagne Airbnb Room Capacity Analysis (2025): Bedroom Distribution
Distribution of Listings by Number of Bedrooms
Room Capacity Insights for Montauban-de-Bretagne
- The dominant room capacity in Montauban-de-Bretagne is 1 bedroom listings, making up 33.3% of the market. This suggests a strong demand for properties suitable for couples or solo travelers.
- Together, 1 bedroom and 2 bedrooms properties represent 50.0% of the active Airbnb listings in Montauban-de-Bretagne, indicating a high concentration in these sizes.
- Listings with 3+ bedrooms (5.6%) represent a smaller niche, potentially indicating an underserved market for larger group accommodations in Montauban-de-Bretagne.
Montauban-de-Bretagne Vacation Rental Guest Capacity Trends (2025)
Distribution of Listings by Guest Capacity
Guest Capacity Insights for Montauban-de-Bretagne
- The most common guest capacity trend in Montauban-de-Bretagne vacation rentals is listings accommodating 2 guests (33.3%). This suggests the primary traveler segment is likely couples or solo travelers.
- Properties designed for 2 guests and 4 guests dominate the Montauban-de-Bretagne STR market, accounting for 44.4% of listings.
- On average, properties in Montauban-de-Bretagne are equipped to host 1.7 guests.
Montauban-de-Bretagne Airbnb Booking Patterns (2025): Available vs. Booked Days
Available Days Distribution
Booked Days Distribution
Booking Pattern Insights for Montauban-de-Bretagne
- The most common availability pattern in Montauban-de-Bretagne falls within the 271-366 days range, representing 38.9% of listings. This suggests many properties have significant open periods on their calendars.
- Approximately 66.7% of listings show high availability (181+ days open annually), indicating potential for increased bookings or specific owner usage patterns.
- For booked days, the 181-270 days range is most frequent in Montauban-de-Bretagne (33.3%), reflecting common guest stay durations or potential owner blocking patterns.
- A notable 33.3% of properties secure long booking periods (181+ days booked per year), highlighting successful long-term rental strategies or significant owner usage.
Montauban-de-Bretagne Airbnb Minimum Stay Requirements Analysis
Distribution of Listings by Minimum Night Requirement
1 Night
10 listings
55.6% of total
2 Nights
5 listings
27.8% of total
4-6 Nights
1 listings
5.6% of total
30+ Nights
2 listings
11.1% of total
Key Insights
- The most prevalent minimum stay requirement in Montauban-de-Bretagne is 1 Night, adopted by 55.6% of listings. This highlights the market's preference for shorter, flexible bookings.
- A strong majority (83.4%) of the Montauban-de-Bretagne Airbnb data shows acceptance of very short stays (1-2 nights), indicating a dynamic, high-turnover market.
- A significant segment (11.1%) caters to monthly stays (30+ nights) in Montauban-de-Bretagne, pointing to opportunities in the extended-stay market.
Recommendations
- Align with the market by considering a 1 Night minimum stay, as 55.6% of Montauban-de-Bretagne hosts use this setting.
- Explore offering discounts for stays of 30+ nights to attract the 11.1% of the market seeking extended stays.
- Adjust minimum nights based on seasonality – potentially shorter during low season and longer during peak demand periods in Montauban-de-Bretagne.
Montauban-de-Bretagne Airbnb Cancellation Policy Trends Analysis (2025)
Flexible
14 listings
82.4% of total
Moderate
2 listings
11.8% of total
Strict
1 listings
5.9% of total
Cancellation Policy Insights for Montauban-de-Bretagne
- The prevailing Airbnb cancellation policy trend in Montauban-de-Bretagne is Flexible, used by 82.4% of listings.
- The market strongly favors guest-friendly terms, with 94.2% of listings offering Flexible or Moderate policies. This suggests guests in Montauban-de-Bretagne may expect booking flexibility.
- Strict cancellation policies are quite rare (5.9%), potentially making listings with this policy less competitive unless justified by high demand or property type.
Recommendations for Hosts
- Consider adopting a Flexible policy to align with the 82.4% market standard in Montauban-de-Bretagne.
- Given the high prevalence of Flexible policies (82.4%), offering this can enhance booking appeal, especially during shoulder seasons.
- Using a Strict policy might deter some guests, as only 5.9% of listings use it. Evaluate if potential revenue protection outweighs possible lower booking rates.
- Regularly review your cancellation policy against competitors and market demand shifts in Montauban-de-Bretagne.
Montauban-de-Bretagne STR Booking Lead Time Analysis (2025)
Average Booking Lead Time by Month
Booking Lead Time Insights for Montauban-de-Bretagne
- The overall average booking lead time for vacation rentals in Montauban-de-Bretagne is 25 days.
- Guests book furthest in advance for stays during July (average 51 days), likely coinciding with peak travel demand or local events.
- The shortest booking windows occur for stays in February (average 9 days), indicating more last-minute travel plans during this time.
- Seasonally, Summer (41 days avg.) sees the longest lead times, while Winter (19 days avg.) has the shortest, reflecting typical travel planning cycles.
Recommendations for Hosts
- Use the overall average lead time (25 days) as a baseline for your pricing and availability strategy in Montauban-de-Bretagne.
- For July stays, consider implementing length-of-stay discounts or slightly higher rates for bookings made less than 51 days out to capitalize on advance planning.
- During February, focus on last-minute booking availability and promotions, as guests book with very short notice (9 days avg.).
- Target marketing efforts for the Summer season well in advance (at least 41 days) to capture early planners.
- Monitor your own booking lead times against these Montauban-de-Bretagne averages to identify opportunities for dynamic pricing adjustments.
Popular & Essential Airbnb Amenities in Montauban-de-Bretagne (2025)
Amenity Prevalence
Amenity Insights for Montauban-de-Bretagne
- Popular amenities like Smoke alarm, Free parking on premises, Kitchen are common but not universal. Offering these can provide a competitive edge.
- Warning: Wifi is not universally provided but is considered essential globally. Ensure reliable Wifi is offered.
Recommendations for Hosts
- Consider adding popular differentiators like Smoke alarm or Free parking on premises to increase appeal.
- Highlight unique or less common amenities you offer (e.g., hot tub, dedicated workspace, EV charger) in your listing description and photos.
- Regularly check competitor amenities in Montauban-de-Bretagne to stay competitive.
Montauban-de-Bretagne Airbnb Guest Demographics & Profile Analysis (2025)
Guest Profile Summary for Montauban-de-Bretagne
- The typical guest profile for Airbnb in Montauban-de-Bretagne consists of primarily domestic travelers (90%), often arriving from nearby Paris, typically belonging to the Post-2000s (Gen Z/Alpha) group (50%), primarily speaking French or English.
- Domestic travelers account for 90.4% of guests.
- Key international markets include France (90.4%) and Italy (2.4%).
- Top languages spoken are French (49.3%) followed by English (31%).
- A significant demographic segment is the Post-2000s (Gen Z/Alpha) group, representing 50% of guests.
Recommendations for Hosts
- Target domestic marketing efforts towards travelers from Paris and Rouen.
- Tailor amenities and listing descriptions to appeal to the dominant Post-2000s (Gen Z/Alpha) demographic (e.g., highlight fast WiFi, smart home features, local guides).
- Highlight unique local experiences or amenities relevant to the primary guest profile.
- Consider seasonal promotions aligned with peak travel times for key origin markets.
Nearby Short-Term Rental Market Comparison
How does the Montauban-de-Bretagne Airbnb market stack up against its neighbors? Compare key performance metrics like average monthly revenue, ADR, and occupancy rates in surrounding areas to understand the broader regional STR landscape.
| Market | Active Properties | Monthly Revenue | Daily Rate | Avg. Occupancy |
|---|---|---|---|---|
| St Martin | 14 | $4,074 | $436.70 | 51% |
| Saint Lawrence | 11 | $2,911 | $317.86 | 52% |
| St Ouen | 15 | $2,635 | $339.51 | 51% |
| St Clement | 14 | $2,522 | $219.76 | 51% |
| Grouville | 21 | $2,510 | $218.40 | 52% |
| St Helier | 66 | $2,497 | $216.70 | 56% |
| St Saviour | 20 | $2,432 | $199.42 | 54% |
| Tamerville | 10 | $2,338 | $333.77 | 26% |
| Île-de-Bréhat | 46 | $2,254 | $221.52 | 45% |
| Trinity | 12 | $2,208 | $156.98 | 61% |