Miniac-Morvan Airbnb Market Analysis 2025: Short Term Rental Data & Vacation Rental Statistics in Brittany, France
Is Airbnb profitable in Miniac-Morvan in 2025? Explore comprehensive Airbnb analytics for Miniac-Morvan, Brittany, France to uncover income potential. This 2025 STR market report for Miniac-Morvan, based on AirROI data from April 2024 to March 2025, reveals key trends in the niche market of 53 active listings.
Whether you're considering an Airbnb investment in Miniac-Morvan, optimizing your existing vacation rental, or exploring rental arbitrage opportunities, understanding the Miniac-Morvan Airbnb data is crucial. Leveraging the low regulation environment is key to maximizing your short term rental income potential. Let's dive into the specifics.
Key Miniac-Morvan Airbnb Performance Metrics Overview
Monthly Airbnb Revenue Variations & Income Potential in Miniac-Morvan (2025)
Understanding the monthly revenue variations for Airbnb listings in Miniac-Morvan is key to maximizing your short term rental income potential. Seasonality significantly impacts earnings. Our analysis, based on data from the past 12 months, shows that the peak revenue month for STRs in Miniac-Morvan is typically August, while January often presents the lowest earnings, highlighting opportunities for strategic pricing adjustments during shoulder and low seasons. Explore the typical Airbnb income in Miniac-Morvan across different performance tiers:
- Best-in-class properties (Top 10%) achieve $3,471+ monthly, often utilizing dynamic pricing and superior guest experiences.
- Strong performing properties (Top 25%) earn $2,144 or more, indicating effective management and desirable locations/amenities.
- Typical properties (Median) generate around $1,163 per month, representing the average market performance.
- Entry-level properties (Bottom 25%) see earnings around $482, often with potential for optimization.
Average Monthly Airbnb Earnings Trend in Miniac-Morvan
Miniac-Morvan Airbnb Occupancy Rate Trends (2025)
Maximize your bookings by understanding the Miniac-Morvan STR occupancy trends. Seasonal demand shifts significantly influence how often properties are booked. Typically, Augustsees the highest demand (peak season occupancy), while January experiences the lowest (low season). Effective strategies, like adjusting minimum stays or offering promotions, can boost occupancy during slower periods. Here's how different property tiers perform in Miniac-Morvan:
- Best-in-class properties (Top 10%) achieve 76%+ occupancy, indicating high desirability and potentially optimized availability.
- Strong performing properties (Top 25%) maintain 52% or higher occupancy, suggesting good market fit and guest satisfaction.
- Typical properties (Median) have an occupancy rate around 28%.
- Entry-level properties (Bottom 25%) average 16% occupancy, potentially facing higher vacancy.
Average Monthly Occupancy Rate Trend in Miniac-Morvan
Average Daily Rate (ADR) Airbnb Trends in Miniac-Morvan (2025)
Effective short term rental pricing strategy in Miniac-Morvan involves understanding monthly ADR fluctuations. The Average Daily Rate (ADR) for Airbnb in Miniac-Morvan typically peaks in July and dips lowest during October. Leveraging Airbnb dynamic pricing tools or strategies based on this seasonality can significantly boost revenue. Here's a look at the typical nightly rates achieved:
- Best-in-class properties (Top 10%) command rates of $203+ per night, often due to premium features or locations.
- Strong performing properties (Top 25%) achieve nightly rates of $124 or more.
- Typical properties (Median) charge around $94 per night.
- Entry-level properties (Bottom 25%) earn around $66 per night.
Average Daily Rate (ADR) Trend by Month in Miniac-Morvan
Get Live Miniac-Morvan Market Intelligence 👇

Explore Real-time Analytics
Airbnb Seasonality Analysis & Trends in Miniac-Morvan (2025)
Peak Season (August, May, June)
- Revenue averages $2,724 per month
- Occupancy rates average 44.9%
- Daily rates average $139
Shoulder Season
- Revenue averages $1,672 per month
- Occupancy maintains around 36.1%
- Daily rates hold near $138
Low Season (January, February, March)
- Revenue drops to average $650 per month
- Occupancy decreases to average 24.9%
- Daily rates adjust to average $137
Seasonality Insights for Miniac-Morvan
- The Airbnb seasonality in Miniac-Morvan shows highly seasonal trends requiring careful strategy. While the sections above show seasonal averages, it's also insightful to look at the extremes:
- During the high season, the absolute peak month showcases Miniac-Morvan's highest earning potential, with monthly revenues capable of climbing to $2,820, occupancy reaching a high of 57.6%, and ADRs peaking at $144.
- Conversely, the slowest single month of the year, typically falling within the low season, marks the market's lowest point. In this month, revenue might dip to $535, occupancy could drop to 19.9%, and ADRs may adjust down to $133.
- Understanding both the seasonal averages and these monthly peaks and troughs in revenue, occupancy, and ADR is crucial for maximizing your Airbnb profit potential in Miniac-Morvan.
Seasonal Strategies for Maximizing Profit
- Peak Season: Maximize revenue through premium pricing and potentially longer minimum stays. Ensure high availability.
- Low Season: Offer competitive pricing, special promotions (e.g., extended stay discounts), and flexible cancellation policies. Target off-season travelers like remote workers or budget-conscious guests.
- Shoulder Seasons: Implement dynamic pricing that balances peak and low rates. Target weekend travelers or specific events. Offer slightly more flexible terms than peak season.
- Regularly analyze your own performance against these Miniac-Morvan seasonality benchmarks and adjust your pricing and availability strategy accordingly.
Best Areas for Airbnb Investment in Miniac-Morvan (2025)
Exploring the top neighborhoods for short-term rentals in Miniac-Morvan? This section highlights key areas, outlining why they are attractive for hosts and guests, along with notable local attractions. Consider these locations based on your target guest profile and investment strategy.
| Neighborhood / Area | Why Host Here? (Target Guests & Appeal) | Key Attractions & Landmarks |
|---|---|---|
| Saint-Malo | A historic coastal town known for its well-preserved medieval architecture and beautiful beaches. Popular with tourists for its rich history and vibrant maritime culture. | Saint-Malo Cathedral, Fort National, Les Remparts, Plage de Bon Secours, Grand Aquarium, Intra-Muros |
| Dinard | A charming seaside resort known for its stunning Victorian villas and scenic coastline. Attracts visitors seeking a pleasant beach getaway with a touch of elegance. | Promenade du Clair de Lune, Plage de la Écluse, Dinard's Casino, Villa les Pypans, Port de Dinard, Festival du Film British |
| Combourg | A picturesque town known for its romantic château and beautiful countryside. Ideal for guests looking for a peaceful retreat with access to outdoor activities. | Château de Combourg, Lac de Combourg, Parc de la Vallée, Église Saint-Sulpice, Le Jardin de la Roche, Bicycle routes |
| Fougères | Famous for its impressive medieval fortress, Fougères offers travelers a glimpse into Brittany's history amidst a backdrop of beautiful gardens and parks. | Château de Fougères, Jardin du Parc, Église Saint-Sulpice, Les Jardins de Brocéliande, Le Jardin des Plantes, Old Town of Fougères |
| Liffré | A growing town near Rennes, presenting opportunities for investment in urban tourism as it combines modern amenities with historical sites nearby. | Château de Liffré, Parks and gardens, Nearby Rennes, Local markets, Liffré swimming pool, Cultural events |
| Mont-Saint-Michel | One of France's most iconic landmarks, it attracts millions of tourists each year. Ideal for vacation rentals due to its tourist influx. | Abbey of Mont-Saint-Michel, Mere Poulard, Mont-Saint-Michel Bay, The Village, Shops and restaurants, Tidal lands |
| Les Sables-d'Olonne | Popular beach destination famous for its sandy beaches and vibrant summer atmosphere. Great for attracting families and beachgoers. | La Grande Plage, Les Olonnes, Promenade Pierre Lamy, Aquarium, Les Halles, City center shops |
| Rennes | The capital of Brittany, known for its lively cultural scene and historic architecture. A hub for business travelers and tourists alike. | Parlement de Bretagne, Rennes Cathedral, Thabor Park, Place des Lices, Les Champs Libres, Local markets |
Understanding Airbnb License Requirements & STR Laws in Miniac-Morvan (2025)
While Miniac-Morvan, Brittany, France currently shows low STR regulations, specific Airbnb license requirements might still exist or change. Always verify the latest short term rental regulations and Airbnb license requirements directly with local government authorities for Miniac-Morvan to ensure full compliance before hosting.
(Source: AirROI data, 2025, based on 6% licensed listings)
Top Performing Airbnb Properties in Miniac-Morvan (2025)
Benchmark your potential! Explore examples of top-performing Airbnb properties in Miniac-Morvanbased on Trailing Twelve Month (TTM) revenue. Analyze their characteristics, revenue, occupancy rate, and ADR to understand what drives success in this market.

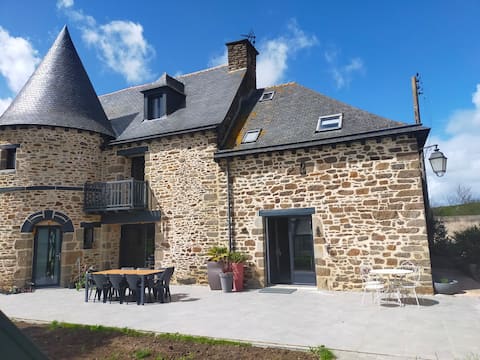
Domaine La Verrerie Bretagne
Entire Place • 5 bedrooms

Traditional country home near Mont St-Michel
Entire Place • 5 bedrooms
Grand Gîte près de Saint-Malo
Entire Place • 5 bedrooms
Gîte de la Ville Aubry
Entire Place • 4 bedrooms
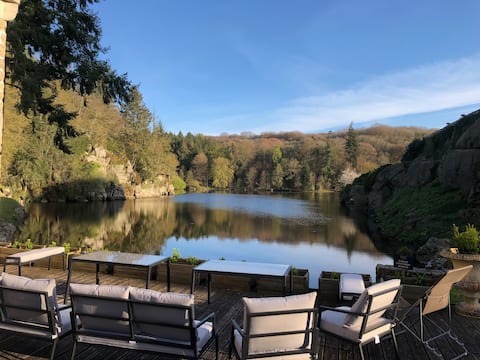
Moulin Gîte splendide with a view of a pond
Entire Place • 5 bedrooms

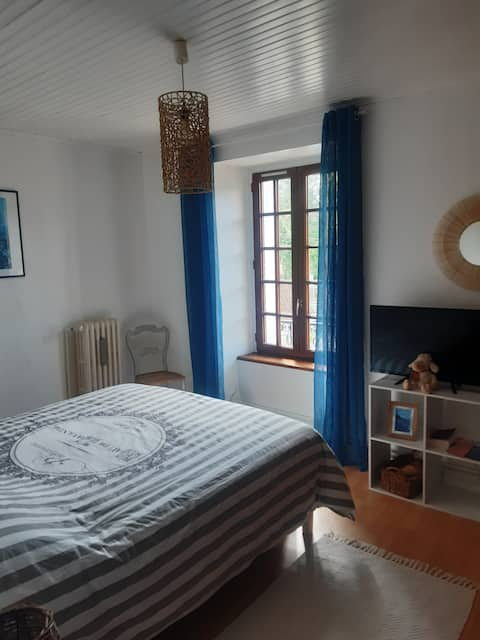
WARM HOUSE IN THE COUNTRYSIDE
Entire Place • 4 bedrooms
Note: Performance varies based on location, size, amenities, seasonality, and management quality. Data reflects the past 12 months.
Top Performing Airbnb Hosts in Miniac-Morvan (2025)
Learn from the best! This table showcases top-performing Airbnb hosts in Miniac-Morvan based on the number of properties managed and estimated total revenue over the past year. Analyze their scale and performance metrics.
| Host Name | Properties | Grossing Revenue | Stay Reviews | Avg Rating |
|---|---|---|---|---|
| Celine | 3 | $150,894 | 130 | 4.88/5.0 |
| Marlena | 2 | $67,427 | 25 | 4.78/5.0 |
| Anne | 2 | $58,978 | 259 | 4.96/5.0 |
| Hfl | 1 | $40,744 | 10 | 4.70/5.0 |
| Marie | 3 | $37,425 | 201 | 4.89/5.0 |
| Jean Marie | 1 | $35,929 | 29 | 4.93/5.0 |
| Olivia | 1 | $35,853 | 6 | 4.67/5.0 |
| Kerkasa | 6 | $33,186 | 57 | 4.76/5.0 |
| Samuel | 3 | $30,534 | 219 | 4.95/5.0 |
| Fabien | 1 | $28,974 | 84 | 4.92/5.0 |
Analyzing the strategies of top hosts, such as their property selection, pricing, and guest communication, can offer valuable lessons for optimizing your own Airbnb operations in Miniac-Morvan.
Dive Deeper: Advanced Miniac-Morvan STR Market Data (2025)
Ready to unlock more insights? AirROI provides access to advanced metrics and comprehensive Airbnb data for Miniac-Morvan. Explore detailed analytics beyond this report to refine your investment strategy, optimize pricing, and maximize your vacation rental profits.
Explore Advanced MetricsMiniac-Morvan Short-Term Rental Market Composition (2025): Property & Room Types
Room Type Distribution
Property Type Distribution
Market Composition Insights for Miniac-Morvan
- The Miniac-Morvan Airbnb market composition is heavily skewed towards Entire Home/Apt listings, which make up 75.5% of the 53 active rentals. This indicates strong guest preference for privacy and space.
- Looking at the property type distribution in Miniac-Morvan, House properties are the most common (66%), reflecting the local real estate landscape.
- Houses represent a significant 66% portion, catering likely to families or larger groups.
- The presence of 11.3% Hotel/Boutique listings indicates integration with traditional hospitality.
- Smaller segments like others (combined 1.9%) offer potential for unique stay experiences.
Miniac-Morvan Airbnb Room Capacity Analysis (2025): Bedroom Distribution
Distribution of Listings by Number of Bedrooms
Room Capacity Insights for Miniac-Morvan
- The dominant room capacity in Miniac-Morvan is 2 bedrooms listings, making up 22.6% of the market. This suggests a strong demand for properties suitable for couples or solo travelers.
- Together, 2 bedrooms and 1 bedroom properties represent 43.4% of the active Airbnb listings in Miniac-Morvan, indicating a high concentration in these sizes.
- A significant 32.0% of listings offer 3+ bedrooms, catering to larger groups and families seeking more space in Miniac-Morvan.
Miniac-Morvan Vacation Rental Guest Capacity Trends (2025)
Distribution of Listings by Guest Capacity
Guest Capacity Insights for Miniac-Morvan
- The most common guest capacity trend in Miniac-Morvan vacation rentals is listings accommodating 8+ guests (24.5%). This suggests the primary traveler segment is likely larger groups.
- Properties designed for 8+ guests and 2 guests dominate the Miniac-Morvan STR market, accounting for 39.6% of listings.
- 37.7% of properties accommodate 6+ guests, serving the market segment for larger families or group travel in Miniac-Morvan.
- On average, properties in Miniac-Morvan are equipped to host 3.9 guests.
Miniac-Morvan Airbnb Booking Patterns (2025): Available vs. Booked Days
Available Days Distribution
Booked Days Distribution
Booking Pattern Insights for Miniac-Morvan
- The most common availability pattern in Miniac-Morvan falls within the 271-366 days range, representing 54.7% of listings. This suggests many properties have significant open periods on their calendars.
- Approximately 81.1% of listings show high availability (181+ days open annually), indicating potential for increased bookings or specific owner usage patterns.
- For booked days, the 31-90 days range is most frequent in Miniac-Morvan (35.8%), reflecting common guest stay durations or potential owner blocking patterns.
- A notable 18.9% of properties secure long booking periods (181+ days booked per year), highlighting successful long-term rental strategies or significant owner usage.
Miniac-Morvan Airbnb Minimum Stay Requirements Analysis
Distribution of Listings by Minimum Night Requirement
1 Night
20 listings
38.5% of total
2 Nights
20 listings
38.5% of total
3 Nights
3 listings
5.8% of total
4-6 Nights
3 listings
5.8% of total
7-29 Nights
1 listings
1.9% of total
30+ Nights
5 listings
9.6% of total
Key Insights
- The most prevalent minimum stay requirement in Miniac-Morvan is 1 Night, adopted by 38.5% of listings. This highlights the market's preference for shorter, flexible bookings.
- A strong majority (77.0%) of the Miniac-Morvan Airbnb data shows acceptance of very short stays (1-2 nights), indicating a dynamic, high-turnover market.
Recommendations
- Align with the market by considering a 1 Night minimum stay, as 38.5% of Miniac-Morvan hosts use this setting.
- Explore offering discounts for stays of 30+ nights to attract the 9.6% of the market seeking extended stays.
- Adjust minimum nights based on seasonality – potentially shorter during low season and longer during peak demand periods in Miniac-Morvan.
Miniac-Morvan Airbnb Cancellation Policy Trends Analysis (2025)
Flexible
14 listings
27.5% of total
Moderate
11 listings
21.6% of total
Firm
13 listings
25.5% of total
Strict
13 listings
25.5% of total
Cancellation Policy Insights for Miniac-Morvan
- The prevailing Airbnb cancellation policy trend in Miniac-Morvan is Flexible, used by 27.5% of listings.
- A majority (51.0%) of hosts in Miniac-Morvan utilize Firm or Strict policies, indicating a market where hosts prioritize booking security.
Recommendations for Hosts
- Consider adopting a Flexible policy to align with the 27.5% market standard in Miniac-Morvan.
- Regularly review your cancellation policy against competitors and market demand shifts in Miniac-Morvan.
Miniac-Morvan STR Booking Lead Time Analysis (2025)
Average Booking Lead Time by Month
Booking Lead Time Insights for Miniac-Morvan
- The overall average booking lead time for vacation rentals in Miniac-Morvan is 57 days.
- Guests book furthest in advance for stays during July (average 102 days), likely coinciding with peak travel demand or local events.
- The shortest booking windows occur for stays in March (average 28 days), indicating more last-minute travel plans during this time.
- Seasonally, Summer (86 days avg.) sees the longest lead times, while Winter (33 days avg.) has the shortest, reflecting typical travel planning cycles.
Recommendations for Hosts
- Use the overall average lead time (57 days) as a baseline for your pricing and availability strategy in Miniac-Morvan.
- For July stays, consider implementing length-of-stay discounts or slightly higher rates for bookings made less than 102 days out to capitalize on advance planning.
- Target marketing efforts for the Summer season well in advance (at least 86 days) to capture early planners.
- Monitor your own booking lead times against these Miniac-Morvan averages to identify opportunities for dynamic pricing adjustments.
Popular & Essential Airbnb Amenities in Miniac-Morvan (2025)
Amenity Prevalence
Amenity Insights for Miniac-Morvan
- Essential amenities in Miniac-Morvan that guests expect include: Heating, Free parking on premises. Lacking these (any) could significantly impact bookings.
- Popular amenities like Hot water, Kitchen, Dishes and silverware are common but not universal. Offering these can provide a competitive edge.
- Warning: Wifi is not universally provided but is considered essential globally. Ensure reliable Wifi is offered.
Recommendations for Hosts
- Ensure your listing includes all essential amenities for Miniac-Morvan: Heating, Free parking on premises.
- Prioritize adding missing essentials: Heating, Free parking on premises.
- Consider adding popular differentiators like Hot water or Kitchen to increase appeal.
- Highlight unique or less common amenities you offer (e.g., hot tub, dedicated workspace, EV charger) in your listing description and photos.
- Regularly check competitor amenities in Miniac-Morvan to stay competitive.
Miniac-Morvan Airbnb Guest Demographics & Profile Analysis (2025)
Guest Profile Summary for Miniac-Morvan
- The typical guest profile for Airbnb in Miniac-Morvan consists of primarily domestic travelers (82%), often arriving from nearby Paris, typically belonging to the Post-2000s (Gen Z/Alpha) group (50%), primarily speaking French or English.
- Domestic travelers account for 81.5% of guests.
- Key international markets include France (81.5%) and United Kingdom (3.2%).
- Top languages spoken are French (44.9%) followed by English (33.2%).
- A significant demographic segment is the Post-2000s (Gen Z/Alpha) group, representing 50% of guests.
Recommendations for Hosts
- Target domestic marketing efforts towards travelers from Paris and Nantes.
- Tailor amenities and listing descriptions to appeal to the dominant Post-2000s (Gen Z/Alpha) demographic (e.g., highlight fast WiFi, smart home features, local guides).
- Highlight unique local experiences or amenities relevant to the primary guest profile.
- Consider seasonal promotions aligned with peak travel times for key origin markets.
Nearby Short-Term Rental Market Comparison
How does the Miniac-Morvan Airbnb market stack up against its neighbors? Compare key performance metrics like average monthly revenue, ADR, and occupancy rates in surrounding areas to understand the broader regional STR landscape.
| Market | Active Properties | Monthly Revenue | Daily Rate | Avg. Occupancy |
|---|---|---|---|---|
| St Martin | 14 | $4,074 | $436.70 | 51% |
| Moulins-le-Carbonnel | 11 | $3,213 | $320.85 | 35% |
| Gonneville-en-Auge | 12 | $3,061 | $235.90 | 40% |
| Vallon-sur-Gée | 11 | $2,913 | $379.01 | 30% |
| Saint Lawrence | 11 | $2,911 | $317.86 | 52% |
| Auberville | 22 | $2,777 | $249.63 | 36% |
| St Ouen | 15 | $2,635 | $339.51 | 51% |
| Chambellay | 11 | $2,525 | $255.24 | 34% |
| St Clement | 14 | $2,522 | $219.76 | 51% |
| Grouville | 21 | $2,510 | $218.40 | 52% |