Le Vivier-sur-Mer Airbnb Market Analysis 2025: Short Term Rental Data & Vacation Rental Statistics in Brittany, France
Is Airbnb profitable in Le Vivier-sur-Mer in 2025? Explore comprehensive Airbnb analytics for Le Vivier-sur-Mer, Brittany, France to uncover income potential. This 2025 STR market report for Le Vivier-sur-Mer, based on AirROI data from April 2024 to March 2025, reveals key trends in the niche market of 22 active listings.
Whether you're considering an Airbnb investment in Le Vivier-sur-Mer, optimizing your existing vacation rental, or exploring rental arbitrage opportunities, understanding the Le Vivier-sur-Mer Airbnb data is crucial. Navigating the high regulation landscape is key to maximizing your short term rental income potential. Let's dive into the specifics.
Key Le Vivier-sur-Mer Airbnb Performance Metrics Overview
Monthly Airbnb Revenue Variations & Income Potential in Le Vivier-sur-Mer (2025)
Understanding the monthly revenue variations for Airbnb listings in Le Vivier-sur-Mer is key to maximizing your short term rental income potential. Seasonality significantly impacts earnings. Our analysis, based on data from the past 12 months, shows that the peak revenue month for STRs in Le Vivier-sur-Mer is typically August, while November often presents the lowest earnings, highlighting opportunities for strategic pricing adjustments during shoulder and low seasons. Explore the typical Airbnb income in Le Vivier-sur-Mer across different performance tiers:
- Best-in-class properties (Top 10%) achieve $3,347+ monthly, often utilizing dynamic pricing and superior guest experiences.
- Strong performing properties (Top 25%) earn $2,407 or more, indicating effective management and desirable locations/amenities.
- Typical properties (Median) generate around $1,562 per month, representing the average market performance.
- Entry-level properties (Bottom 25%) see earnings around $947, often with potential for optimization.
Average Monthly Airbnb Earnings Trend in Le Vivier-sur-Mer
Le Vivier-sur-Mer Airbnb Occupancy Rate Trends (2025)
Maximize your bookings by understanding the Le Vivier-sur-Mer STR occupancy trends. Seasonal demand shifts significantly influence how often properties are booked. Typically, Augustsees the highest demand (peak season occupancy), while January experiences the lowest (low season). Effective strategies, like adjusting minimum stays or offering promotions, can boost occupancy during slower periods. Here's how different property tiers perform in Le Vivier-sur-Mer:
- Best-in-class properties (Top 10%) achieve 80%+ occupancy, indicating high desirability and potentially optimized availability.
- Strong performing properties (Top 25%) maintain 66% or higher occupancy, suggesting good market fit and guest satisfaction.
- Typical properties (Median) have an occupancy rate around 46%.
- Entry-level properties (Bottom 25%) average 28% occupancy, potentially facing higher vacancy.
Average Monthly Occupancy Rate Trend in Le Vivier-sur-Mer
Average Daily Rate (ADR) Airbnb Trends in Le Vivier-sur-Mer (2025)
Effective short term rental pricing strategy in Le Vivier-sur-Mer involves understanding monthly ADR fluctuations. The Average Daily Rate (ADR) for Airbnb in Le Vivier-sur-Mer typically peaks in July and dips lowest during March. Leveraging Airbnb dynamic pricing tools or strategies based on this seasonality can significantly boost revenue. Here's a look at the typical nightly rates achieved:
- Best-in-class properties (Top 10%) command rates of $202+ per night, often due to premium features or locations.
- Strong performing properties (Top 25%) achieve nightly rates of $139 or more.
- Typical properties (Median) charge around $119 per night.
- Entry-level properties (Bottom 25%) earn around $93 per night.
Average Daily Rate (ADR) Trend by Month in Le Vivier-sur-Mer
Get Live Le Vivier-sur-Mer Market Intelligence 👇
Explore Real-time Analytics
Airbnb Seasonality Analysis & Trends in Le Vivier-sur-Mer (2025)
Peak Season (August, June, May)
- Revenue averages $2,512 per month
- Occupancy rates average 62.8%
- Daily rates average $132
Shoulder Season
- Revenue averages $1,777 per month
- Occupancy maintains around 48.2%
- Daily rates hold near $131
Low Season (January, February, November)
- Revenue drops to average $1,021 per month
- Occupancy decreases to average 32.8%
- Daily rates adjust to average $130
Seasonality Insights for Le Vivier-sur-Mer
- The Airbnb seasonality in Le Vivier-sur-Mer shows highly seasonal trends requiring careful strategy. While the sections above show seasonal averages, it's also insightful to look at the extremes:
- During the high season, the absolute peak month showcases Le Vivier-sur-Mer's highest earning potential, with monthly revenues capable of climbing to $2,766, occupancy reaching a high of 69.8%, and ADRs peaking at $135.
- Conversely, the slowest single month of the year, typically falling within the low season, marks the market's lowest point. In this month, revenue might dip to $899, occupancy could drop to 28.2%, and ADRs may adjust down to $128.
- Understanding both the seasonal averages and these monthly peaks and troughs in revenue, occupancy, and ADR is crucial for maximizing your Airbnb profit potential in Le Vivier-sur-Mer.
Seasonal Strategies for Maximizing Profit
- Peak Season: Maximize revenue through premium pricing and potentially longer minimum stays. Ensure high availability.
- Low Season: Offer competitive pricing, special promotions (e.g., extended stay discounts), and flexible cancellation policies. Target off-season travelers like remote workers or budget-conscious guests.
- Shoulder Seasons: Implement dynamic pricing that balances peak and low rates. Target weekend travelers or specific events. Offer slightly more flexible terms than peak season.
- Regularly analyze your own performance against these Le Vivier-sur-Mer seasonality benchmarks and adjust your pricing and availability strategy accordingly.
Best Areas for Airbnb Investment in Le Vivier-sur-Mer (2025)
Exploring the top neighborhoods for short-term rentals in Le Vivier-sur-Mer? This section highlights key areas, outlining why they are attractive for hosts and guests, along with notable local attractions. Consider these locations based on your target guest profile and investment strategy.
| Neighborhood / Area | Why Host Here? (Target Guests & Appeal) | Key Attractions & Landmarks |
|---|---|---|
| Le Vivier-sur-Mer Town Center | The charming town center is close to local markets, bakeries, and restaurants. It’s a great location for guests looking to experience local culture and cuisine. | Local Markets, Restaurants, Bakeries, Historic Church, Nearby Beaches |
| Mont-Saint-Michel Viewpoint | Offering stunning views of Mont-Saint-Michel, this area attracts tourists who want a picturesque backdrop for their stay and easy access to this iconic landmark. | Mont-Saint-Michel, Breathtaking Views, Walking Trails, Photography Spots |
| Beachfront Properties | Direct access to beautiful sandy beaches makes this area highly desirable for families and beach lovers looking to relax by the sea. | Sandy Beaches, Water Sports, Beachside Restaurants, Family-friendly Activities |
| Pointe du Grouin | A natural site known for its scenic coastal views and birdwatching opportunities, appealing to nature enthusiasts and those looking for tranquility. | Coastal Walks, Birdwatching, Scenic Views, Picnic Areas |
| Saint-Malo | Just a short drive away, this historic city of Saint-Malo offers rich history, fortified walls, and a vibrant atmosphere, perfect for day trips. | Historic Fortifications, Beaches, Shopping and Dining, Cité d'Aleth |
| Cancale | Famous for its oysters and seaside charm, Cancale is just adjacent to Le Vivier-sur-Mer and attracts food lovers and ocean enthusiasts. | Oyster Farms, Seaside Walks, Restaurants, Local Crafts |
| Brittany Coastline | The vast coastline offers numerous quaint villages and beautiful landscapes, perfect for explorers looking for off-the-beaten-path locations to enjoy nature. | Coastal Villages, Hiking Trails, Natural Parks, Cultural Sites |
| Historical Sites of Dol-de-Bretagne | Located nearby, Dol-de-Bretagne boasts rich historical sites and cultural experiences, making it attractive for guests interested in history. | Cathedral of Saint-Samson, Museums, Historic Town Center, Cultural Events |
Understanding Airbnb License Requirements & STR Laws in Le Vivier-sur-Mer (2025)
Yes, Le Vivier-sur-Mer, Brittany, France enforces high STR regulations. Obtaining a license and ensuring compliance is almost certainly required according to current 2025 STR laws. Always verify the latest short term rental regulations and Airbnb license requirements directly with local government authorities for Le Vivier-sur-Mer to ensure full compliance before hosting.
(Source: AirROI data, 2025, based on 32% licensed listings)
Top Performing Airbnb Properties in Le Vivier-sur-Mer (2025)
Benchmark your potential! Explore examples of top-performing Airbnb properties in Le Vivier-sur-Merbased on Trailing Twelve Month (TTM) revenue. Analyze their characteristics, revenue, occupancy rate, and ADR to understand what drives success in this market.
The selfish old monkey
Entire Place • 1 bedroom
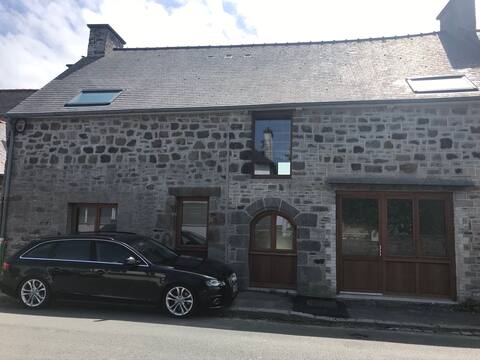
Fisherman's house 6 people
Entire Place • 3 bedrooms
Spacious home filled with charm
Entire Place • 3 bedrooms
Breton character house "L 'entre deux"
Entire Place • 3 bedrooms

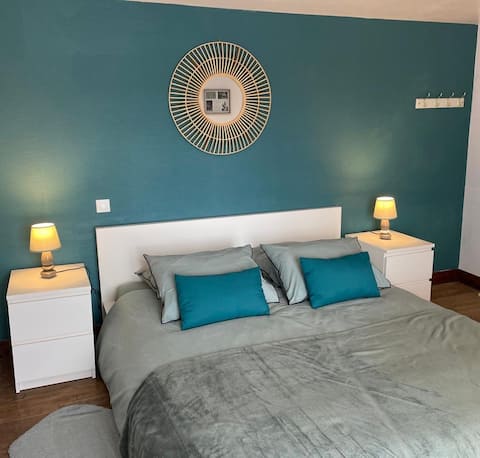
Ty bord ar mor
Entire Place • 2 bedrooms
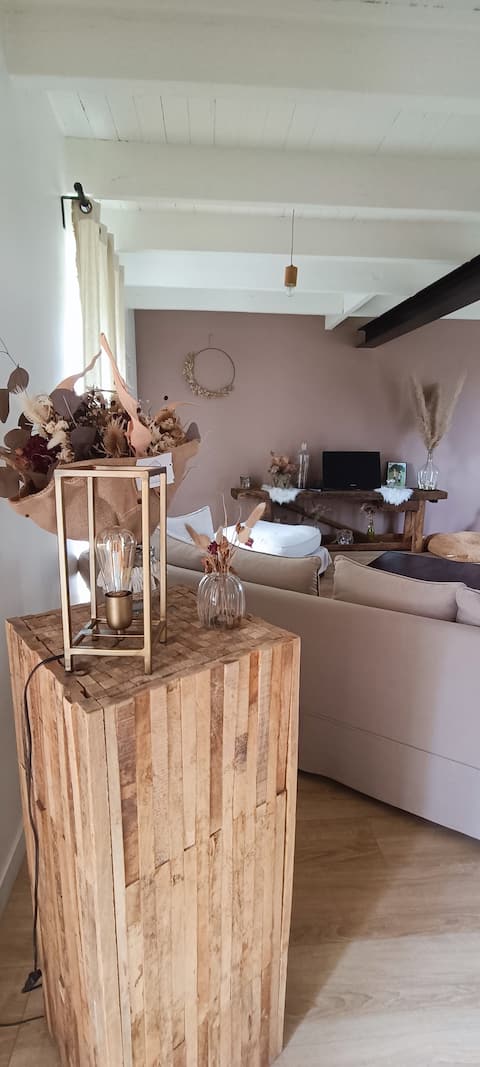
House 3 min walk to Baie du Mont St Michel
Entire Place • 2 bedrooms
Note: Performance varies based on location, size, amenities, seasonality, and management quality. Data reflects the past 12 months.
Top Performing Airbnb Hosts in Le Vivier-sur-Mer (2025)
Learn from the best! This table showcases top-performing Airbnb hosts in Le Vivier-sur-Mer based on the number of properties managed and estimated total revenue over the past year. Analyze their scale and performance metrics.
| Host Name | Properties | Grossing Revenue | Stay Reviews | Avg Rating |
|---|---|---|---|---|
| Corinne | 3 | $67,000 | 176 | 4.92/5.0 |
| Aurelie Et Pierre Emmanuel | 1 | $33,103 | 71 | 5.00/5.0 |
| Diane | 2 | $29,868 | 49 | 4.68/5.0 |
| Pauline | 1 | $27,543 | 7 | 5.00/5.0 |
| Sarl Cleophas | 1 | $25,306 | 84 | 4.71/5.0 |
| Jean Yves | 1 | $24,804 | 177 | 4.91/5.0 |
| Adeline | 1 | $23,961 | 55 | 4.89/5.0 |
| Marion | 1 | $22,415 | 129 | 4.84/5.0 |
| Host #66423331 | 1 | $21,887 | 4 | 5.00/5.0 |
| Host #479988835 | 1 | $21,324 | 11 | 4.55/5.0 |
Analyzing the strategies of top hosts, such as their property selection, pricing, and guest communication, can offer valuable lessons for optimizing your own Airbnb operations in Le Vivier-sur-Mer.
Dive Deeper: Advanced Le Vivier-sur-Mer STR Market Data (2025)
Ready to unlock more insights? AirROI provides access to advanced metrics and comprehensive Airbnb data for Le Vivier-sur-Mer. Explore detailed analytics beyond this report to refine your investment strategy, optimize pricing, and maximize your vacation rental profits.
Explore Advanced MetricsLe Vivier-sur-Mer Short-Term Rental Market Composition (2025): Property & Room Types
Room Type Distribution
Property Type Distribution
Market Composition Insights for Le Vivier-sur-Mer
- The Le Vivier-sur-Mer Airbnb market composition is heavily skewed towards Entire Home/Apt listings, which make up 86.4% of the 22 active rentals. This indicates strong guest preference for privacy and space.
- Looking at the property type distribution in Le Vivier-sur-Mer, House properties are the most common (63.6%), reflecting the local real estate landscape.
- Houses represent a significant 63.6% portion, catering likely to families or larger groups.
- The presence of 9.1% Hotel/Boutique listings indicates integration with traditional hospitality.
- Smaller segments like others, unique stays (combined 9.0%) offer potential for unique stay experiences.
Le Vivier-sur-Mer Airbnb Room Capacity Analysis (2025): Bedroom Distribution
Distribution of Listings by Number of Bedrooms
Room Capacity Insights for Le Vivier-sur-Mer
- The dominant room capacity in Le Vivier-sur-Mer is 1 bedroom listings, making up 36.4% of the market. This suggests a strong demand for properties suitable for couples or solo travelers.
- Together, 1 bedroom and 2 bedrooms properties represent 68.2% of the active Airbnb listings in Le Vivier-sur-Mer, indicating a high concentration in these sizes.
- A significant 27.3% of listings offer 3+ bedrooms, catering to larger groups and families seeking more space in Le Vivier-sur-Mer.
Le Vivier-sur-Mer Vacation Rental Guest Capacity Trends (2025)
Distribution of Listings by Guest Capacity
Guest Capacity Insights for Le Vivier-sur-Mer
- The most common guest capacity trend in Le Vivier-sur-Mer vacation rentals is listings accommodating 4 guests (40.9%). This suggests the primary traveler segment is likely small families or groups.
- Properties designed for 4 guests and 6 guests dominate the Le Vivier-sur-Mer STR market, accounting for 68.2% of listings.
- 31.8% of properties accommodate 6+ guests, serving the market segment for larger families or group travel in Le Vivier-sur-Mer.
- On average, properties in Le Vivier-sur-Mer are equipped to host 4.2 guests.
Le Vivier-sur-Mer Airbnb Booking Patterns (2025): Available vs. Booked Days
Available Days Distribution
Booked Days Distribution
Booking Pattern Insights for Le Vivier-sur-Mer
- The most common availability pattern in Le Vivier-sur-Mer falls within the 181-270 days range, representing 45.5% of listings. This suggests many properties have significant open periods on their calendars.
- Approximately 63.7% of listings show high availability (181+ days open annually), indicating potential for increased bookings or specific owner usage patterns.
- For booked days, the 91-180 days range is most frequent in Le Vivier-sur-Mer (45.5%), reflecting common guest stay durations or potential owner blocking patterns.
- A notable 36.3% of properties secure long booking periods (181+ days booked per year), highlighting successful long-term rental strategies or significant owner usage.
Le Vivier-sur-Mer Airbnb Minimum Stay Requirements Analysis
Distribution of Listings by Minimum Night Requirement
1 Night
3 listings
16.7% of total
2 Nights
11 listings
61.1% of total
3 Nights
3 listings
16.7% of total
4-6 Nights
1 listings
5.6% of total
Key Insights
- The most prevalent minimum stay requirement in Le Vivier-sur-Mer is 2 Nights, adopted by 61.1% of listings. This highlights the market's preference for shorter, flexible bookings.
- A strong majority (77.8%) of the Le Vivier-sur-Mer Airbnb data shows acceptance of very short stays (1-2 nights), indicating a dynamic, high-turnover market.
Recommendations
- Align with the market by considering a 2 Nights minimum stay, as 61.1% of Le Vivier-sur-Mer hosts use this setting.
- If feasible, allowing 1-night stays, especially midweek or during low season, could capture last-minute bookings, as only 16.7% currently do.
- A 2-night minimum appears standard (61.1%). Consider this for weekends or peak periods.
- Adjust minimum nights based on seasonality – potentially shorter during low season and longer during peak demand periods in Le Vivier-sur-Mer.
Le Vivier-sur-Mer Airbnb Cancellation Policy Trends Analysis (2025)
Non-refundable
1 listings
5.6% of total
Flexible
7 listings
38.9% of total
Moderate
4 listings
22.2% of total
Firm
2 listings
11.1% of total
Strict
4 listings
22.2% of total
Cancellation Policy Insights for Le Vivier-sur-Mer
- The prevailing Airbnb cancellation policy trend in Le Vivier-sur-Mer is Flexible, used by 38.9% of listings.
- There's a relatively balanced mix between guest-friendly (61.1%) and stricter (33.3%) policies, offering choices for different guest needs.
Recommendations for Hosts
- Consider adopting a Flexible policy to align with the 38.9% market standard in Le Vivier-sur-Mer.
- Regularly review your cancellation policy against competitors and market demand shifts in Le Vivier-sur-Mer.
Le Vivier-sur-Mer STR Booking Lead Time Analysis (2025)
Average Booking Lead Time by Month
Booking Lead Time Insights for Le Vivier-sur-Mer
- The overall average booking lead time for vacation rentals in Le Vivier-sur-Mer is 57 days.
- Guests book furthest in advance for stays during July (average 125 days), likely coinciding with peak travel demand or local events.
- The shortest booking windows occur for stays in February (average 29 days), indicating more last-minute travel plans during this time.
- Seasonally, Summer (112 days avg.) sees the longest lead times, while Winter (43 days avg.) has the shortest, reflecting typical travel planning cycles.
Recommendations for Hosts
- Use the overall average lead time (57 days) as a baseline for your pricing and availability strategy in Le Vivier-sur-Mer.
- For July stays, consider implementing length-of-stay discounts or slightly higher rates for bookings made less than 125 days out to capitalize on advance planning.
- Target marketing efforts for the Summer season well in advance (at least 112 days) to capture early planners.
- Monitor your own booking lead times against these Le Vivier-sur-Mer averages to identify opportunities for dynamic pricing adjustments.
Popular & Essential Airbnb Amenities in Le Vivier-sur-Mer (2025)
Amenity Prevalence
Amenity Insights for Le Vivier-sur-Mer
- Essential amenities in Le Vivier-sur-Mer that guests expect include: Kitchen, TV. Lacking these (any) could significantly impact bookings.
- Popular amenities like Refrigerator, Hot water, Wifi are common but not universal. Offering these can provide a competitive edge.
- Warning: Wifi is not universally provided but is considered essential globally. Ensure reliable Wifi is offered.
Recommendations for Hosts
- Ensure your listing includes all essential amenities for Le Vivier-sur-Mer: Kitchen, TV.
- Prioritize adding missing essentials: TV.
- Consider adding popular differentiators like Refrigerator or Hot water to increase appeal.
- Highlight unique or less common amenities you offer (e.g., hot tub, dedicated workspace, EV charger) in your listing description and photos.
- Regularly check competitor amenities in Le Vivier-sur-Mer to stay competitive.
Le Vivier-sur-Mer Airbnb Guest Demographics & Profile Analysis (2025)
Guest Profile Summary for Le Vivier-sur-Mer
- The typical guest profile for Airbnb in Le Vivier-sur-Mer consists of primarily domestic travelers (73%), often arriving from nearby Paris, typically belonging to the Post-2000s (Gen Z/Alpha) group (50%), primarily speaking French or English.
- Domestic travelers account for 72.9% of guests.
- Key international markets include France (72.9%) and Germany (8%).
- Top languages spoken are French (37%) followed by English (33.7%).
- A significant demographic segment is the Post-2000s (Gen Z/Alpha) group, representing 50% of guests.
Recommendations for Hosts
- Target domestic marketing efforts towards travelers from Paris and Toulouse.
- Tailor amenities and listing descriptions to appeal to the dominant Post-2000s (Gen Z/Alpha) demographic (e.g., highlight fast WiFi, smart home features, local guides).
- Highlight unique local experiences or amenities relevant to the primary guest profile.
- Consider seasonal promotions aligned with peak travel times for key origin markets.
Nearby Short-Term Rental Market Comparison
How does the Le Vivier-sur-Mer Airbnb market stack up against its neighbors? Compare key performance metrics like average monthly revenue, ADR, and occupancy rates in surrounding areas to understand the broader regional STR landscape.
| Market | Active Properties | Monthly Revenue | Daily Rate | Avg. Occupancy |
|---|---|---|---|---|
| St Martin | 14 | $4,074 | $436.70 | 51% |
| Moulins-le-Carbonnel | 11 | $3,213 | $320.85 | 35% |
| Gonneville-en-Auge | 12 | $3,061 | $235.90 | 40% |
| Vallon-sur-Gée | 11 | $2,913 | $379.01 | 30% |
| Saint Lawrence | 11 | $2,911 | $317.86 | 52% |
| Auberville | 22 | $2,777 | $249.63 | 36% |
| St Ouen | 15 | $2,635 | $339.51 | 51% |
| Chambellay | 11 | $2,525 | $255.24 | 34% |
| St Clement | 14 | $2,522 | $219.76 | 51% |
| Grouville | 21 | $2,510 | $218.40 | 52% |