Lanildut Airbnb Market Analysis 2025: Short Term Rental Data & Vacation Rental Statistics in Brittany, France
Is Airbnb profitable in Lanildut in 2025? Explore comprehensive Airbnb analytics for Lanildut, Brittany, France to uncover income potential. This 2025 STR market report for Lanildut, based on AirROI data from April 2024 to March 2025, reveals key trends in the niche market of 27 active listings.
Whether you're considering an Airbnb investment in Lanildut, optimizing your existing vacation rental, or exploring rental arbitrage opportunities, understanding the Lanildut Airbnb data is crucial. Understanding the local regulations is key to maximizing your short term rental income potential. Let's dive into the specifics.
Key Lanildut Airbnb Performance Metrics Overview
Monthly Airbnb Revenue Variations & Income Potential in Lanildut (2025)
Understanding the monthly revenue variations for Airbnb listings in Lanildut is key to maximizing your short term rental income potential. Seasonality significantly impacts earnings. Our analysis, based on data from the past 12 months, shows that the peak revenue month for STRs in Lanildut is typically August, while March often presents the lowest earnings, highlighting opportunities for strategic pricing adjustments during shoulder and low seasons. Explore the typical Airbnb income in Lanildut across different performance tiers:
- Best-in-class properties (Top 10%) achieve $4,532+ monthly, often utilizing dynamic pricing and superior guest experiences.
- Strong performing properties (Top 25%) earn $2,530 or more, indicating effective management and desirable locations/amenities.
- Typical properties (Median) generate around $1,535 per month, representing the average market performance.
- Entry-level properties (Bottom 25%) see earnings around $922, often with potential for optimization.
Average Monthly Airbnb Earnings Trend in Lanildut
Lanildut Airbnb Occupancy Rate Trends (2025)
Maximize your bookings by understanding the Lanildut STR occupancy trends. Seasonal demand shifts significantly influence how often properties are booked. Typically, Augustsees the highest demand (peak season occupancy), while March experiences the lowest (low season). Effective strategies, like adjusting minimum stays or offering promotions, can boost occupancy during slower periods. Here's how different property tiers perform in Lanildut:
- Best-in-class properties (Top 10%) achieve 73%+ occupancy, indicating high desirability and potentially optimized availability.
- Strong performing properties (Top 25%) maintain 62% or higher occupancy, suggesting good market fit and guest satisfaction.
- Typical properties (Median) have an occupancy rate around 38%.
- Entry-level properties (Bottom 25%) average 22% occupancy, potentially facing higher vacancy.
Average Monthly Occupancy Rate Trend in Lanildut
Average Daily Rate (ADR) Airbnb Trends in Lanildut (2025)
Effective short term rental pricing strategy in Lanildut involves understanding monthly ADR fluctuations. The Average Daily Rate (ADR) for Airbnb in Lanildut typically peaks in April and dips lowest during March. Leveraging Airbnb dynamic pricing tools or strategies based on this seasonality can significantly boost revenue. Here's a look at the typical nightly rates achieved:
- Best-in-class properties (Top 10%) command rates of $443+ per night, often due to premium features or locations.
- Strong performing properties (Top 25%) achieve nightly rates of $185 or more.
- Typical properties (Median) charge around $124 per night.
- Entry-level properties (Bottom 25%) earn around $102 per night.
Average Daily Rate (ADR) Trend by Month in Lanildut
Get Live Lanildut Market Intelligence 👇

Explore Real-time Analytics
Airbnb Seasonality Analysis & Trends in Lanildut (2025)
Peak Season (August, July, June)
- Revenue averages $3,281 per month
- Occupancy rates average 59.1%
- Daily rates average $391
Shoulder Season
- Revenue averages $1,904 per month
- Occupancy maintains around 41.1%
- Daily rates hold near $304
Low Season (February, March, November)
- Revenue drops to average $1,000 per month
- Occupancy decreases to average 24.9%
- Daily rates adjust to average $135
Seasonality Insights for Lanildut
- The Airbnb seasonality in Lanildut shows highly seasonal trends requiring careful strategy. While the sections above show seasonal averages, it's also insightful to look at the extremes:
- During the high season, the absolute peak month showcases Lanildut's highest earning potential, with monthly revenues capable of climbing to $3,898, occupancy reaching a high of 75.9%, and ADRs peaking at $404.
- Conversely, the slowest single month of the year, typically falling within the low season, marks the market's lowest point. In this month, revenue might dip to $979, occupancy could drop to 23.2%, and ADRs may adjust down to $134.
- Understanding both the seasonal averages and these monthly peaks and troughs in revenue, occupancy, and ADR is crucial for maximizing your Airbnb profit potential in Lanildut.
Seasonal Strategies for Maximizing Profit
- Peak Season: Maximize revenue through premium pricing and potentially longer minimum stays. Ensure high availability.
- Low Season: Offer competitive pricing, special promotions (e.g., extended stay discounts), and flexible cancellation policies. Target off-season travelers like remote workers or budget-conscious guests.
- Shoulder Seasons: Implement dynamic pricing that balances peak and low rates. Target weekend travelers or specific events. Offer slightly more flexible terms than peak season.
- Regularly analyze your own performance against these Lanildut seasonality benchmarks and adjust your pricing and availability strategy accordingly.
Best Areas for Airbnb Investment in Lanildut (2025)
Exploring the top neighborhoods for short-term rentals in Lanildut? This section highlights key areas, outlining why they are attractive for hosts and guests, along with notable local attractions. Consider these locations based on your target guest profile and investment strategy.
| Neighborhood / Area | Why Host Here? (Target Guests & Appeal) | Key Attractions & Landmarks |
|---|---|---|
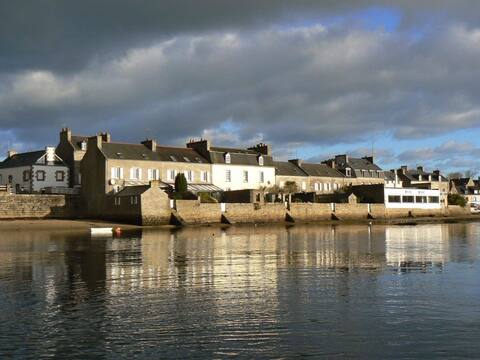
| Lanildut Harbor | Charming harbor area popular for its scenic views and maritime activities. Ideal for guests looking for a peaceful retreat close to the seaside. | Lanildut Marina, Fishing Port, Local seafood restaurants, Coastal walking paths, Les Abers, Beach access |
| Saint Anne's Church | Historic church area that attracts visitors for its stunning architecture and community events. Great for those interested in culture and history. | Saint Anne's Church, Historic town center, Cultural festivals, Artisan shops, Photography opportunities, Local markets |
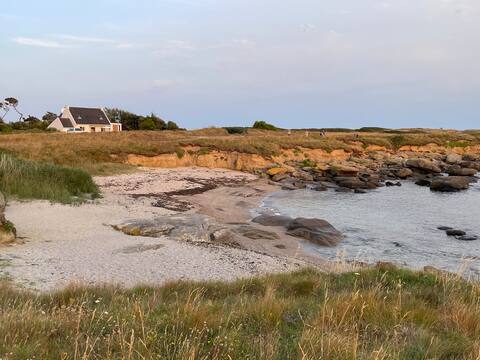
| Coastal Walks | Renowned for its breathtaking coastal paths and natural beauty. Perfect for outdoor enthusiasts and nature lovers. | GR34 Coastal Path, Scenic viewpoints, Natural parks, Bird watching, Sea kayaking, Cycling routes |
| Café District | Lively area filled with cafes and local eateries, providing a taste of Brittany's culinary delights. Attracts food lovers and social travelers. | Local cafés, Bakeries, Brittany crepes, Market square, Social nightlife, Art exhibitions |
| Plouarzel | Nearby commune popular for its beaches and family-friendly atmosphere. Suitable for those looking for a longer stay in a quieter environment. | Plouarzel Beach, Nature reserves, Water sports, Local crafts, Community events, Family activities |
| Historical Landmarks | The rich history of the region draws history buffs and tourists alike, with multiple landmarks showcasing Brittany's heritage. | Château de Kergroadez, Museum of Brittany, Traditional markets, Ancient ruins, Historic walks, Culture-focused events |
| Water Sports Haven | Ideal for guests interested in water activities like sailing and windsurfing, this area appeals to the active holidaymaker. | Sailing schools, Wind surfing spots, Boat rentals, Beach clubs, Waterfront activities, Seafood shacks |
| Nature Reserves | Thriving with biodiversity, the nature reserves near Lanildut are perfect for eco-tourists and wildlife enthusiasts. | Armorique Regional Park, Wildlife observation, Nature trails, Picnic areas, Guided tours, Educational centers |
Understanding Airbnb License Requirements & STR Laws in Lanildut (2025)
With 11% of listings showing registration in 2025, understanding potential Airbnb license requirements is crucial in Lanildut. Always verify the latest short term rental regulations and Airbnb license requirements directly with local government authorities for Lanildut to ensure full compliance before hosting.
(Source: AirROI data, 2025, based on 11% licensed listings)
Top Performing Airbnb Properties in Lanildut (2025)
Benchmark your potential! Explore examples of top-performing Airbnb properties in Lanildutbased on Trailing Twelve Month (TTM) revenue. Analyze their characteristics, revenue, occupancy rate, and ADR to understand what drives success in this market.

Bretagne New villa 4ch direct access to the sea...
Entire Place • 4 bedrooms
La Maison sur l 'Aber Ildut
Entire Place • 6 bedrooms
House by the sea with exceptional views
Entire Place • 2 bedrooms
House for 8, sea view, 4 bedrooms 3 bathrooms
Entire Place • 4 bedrooms

Pool & Saltum Penthouse
Entire Place • 2 bedrooms
Villa with sea view
Entire Place • 4 bedrooms
Note: Performance varies based on location, size, amenities, seasonality, and management quality. Data reflects the past 12 months.
Top Performing Airbnb Hosts in Lanildut (2025)
Learn from the best! This table showcases top-performing Airbnb hosts in Lanildut based on the number of properties managed and estimated total revenue over the past year. Analyze their scale and performance metrics.
| Host Name | Properties | Grossing Revenue | Stay Reviews | Avg Rating |
|---|---|---|---|---|
| Vanessa | 1 | $70,494 | 60 | 4.98/5.0 |
| Elisabeth | 1 | $51,192 | 34 | 4.91/5.0 |
| Claire | 1 | $34,042 | 22 | 4.59/5.0 |
| Nicolas | 1 | $33,761 | 42 | 4.90/5.0 |
| Miguel | 2 | $33,410 | 11 | 2.50/5.0 |
| Christophe | 3 | $31,493 | 58 | 4.98/5.0 |
| Margot | 1 | $29,364 | 67 | 4.91/5.0 |
| Audrey | 1 | $23,411 | 285 | 4.89/5.0 |
| Yann | 1 | $20,280 | 10 | 4.90/5.0 |
| Josselin | 1 | $18,345 | 7 | 4.57/5.0 |
Analyzing the strategies of top hosts, such as their property selection, pricing, and guest communication, can offer valuable lessons for optimizing your own Airbnb operations in Lanildut.
Dive Deeper: Advanced Lanildut STR Market Data (2025)
Ready to unlock more insights? AirROI provides access to advanced metrics and comprehensive Airbnb data for Lanildut. Explore detailed analytics beyond this report to refine your investment strategy, optimize pricing, and maximize your vacation rental profits.
Explore Advanced MetricsLanildut Short-Term Rental Market Composition (2025): Property & Room Types
Room Type Distribution
Property Type Distribution
Market Composition Insights for Lanildut
- The Lanildut Airbnb market composition is heavily skewed towards Entire Home/Apt listings, which make up 92.6% of the 27 active rentals. This indicates strong guest preference for privacy and space.
- Looking at the property type distribution in Lanildut, House properties are the most common (81.5%), reflecting the local real estate landscape.
- Houses represent a significant 81.5% portion, catering likely to families or larger groups.
- The presence of 14.8% Hotel/Boutique listings indicates integration with traditional hospitality.
- Smaller segments like apartment/condo (combined 3.7%) offer potential for unique stay experiences.
Lanildut Airbnb Room Capacity Analysis (2025): Bedroom Distribution
Distribution of Listings by Number of Bedrooms
Room Capacity Insights for Lanildut
- The dominant room capacity in Lanildut is 2 bedrooms listings, making up 37% of the market. This suggests a strong demand for properties suitable for couples or solo travelers.
- Together, 2 bedrooms and 3 bedrooms properties represent 66.6% of the active Airbnb listings in Lanildut, indicating a high concentration in these sizes.
- A significant 55.5% of listings offer 3+ bedrooms, catering to larger groups and families seeking more space in Lanildut.
Lanildut Vacation Rental Guest Capacity Trends (2025)
Distribution of Listings by Guest Capacity
Guest Capacity Insights for Lanildut
- The most common guest capacity trend in Lanildut vacation rentals is listings accommodating 6 guests (25.9%). This suggests the primary traveler segment is likely larger groups.
- Properties designed for 6 guests and 8+ guests dominate the Lanildut STR market, accounting for 51.8% of listings.
- 51.8% of properties accommodate 6+ guests, serving the market segment for larger families or group travel in Lanildut.
- On average, properties in Lanildut are equipped to host 5.2 guests.
Lanildut Airbnb Booking Patterns (2025): Available vs. Booked Days
Available Days Distribution
Booked Days Distribution
Booking Pattern Insights for Lanildut
- The most common availability pattern in Lanildut falls within the 271-366 days range, representing 51.9% of listings. This suggests many properties have significant open periods on their calendars.
- Approximately 70.4% of listings show high availability (181+ days open annually), indicating potential for increased bookings or specific owner usage patterns.
- For booked days, the 31-90 days range is most frequent in Lanildut (44.4%), reflecting common guest stay durations or potential owner blocking patterns.
- A notable 29.6% of properties secure long booking periods (181+ days booked per year), highlighting successful long-term rental strategies or significant owner usage.
Lanildut Airbnb Minimum Stay Requirements Analysis
Distribution of Listings by Minimum Night Requirement
1 Night
4 listings
16% of total
2 Nights
8 listings
32% of total
3 Nights
3 listings
12% of total
4-6 Nights
4 listings
16% of total
7-29 Nights
6 listings
24% of total
Key Insights
- The most prevalent minimum stay requirement in Lanildut is 2 Nights, adopted by 32% of listings. This highlights the market's preference for shorter, flexible bookings.
Recommendations
- Align with the market by considering a 2 Nights minimum stay, as 32% of Lanildut hosts use this setting.
- If feasible, allowing 1-night stays, especially midweek or during low season, could capture last-minute bookings, as only 16% currently do.
- A 2-night minimum appears standard (32%). Consider this for weekends or peak periods.
- Adjust minimum nights based on seasonality – potentially shorter during low season and longer during peak demand periods in Lanildut.
Lanildut Airbnb Cancellation Policy Trends Analysis (2025)
Flexible
4 listings
18.2% of total
Moderate
7 listings
31.8% of total
Firm
7 listings
31.8% of total
Strict
4 listings
18.2% of total
Cancellation Policy Insights for Lanildut
- The prevailing Airbnb cancellation policy trend in Lanildut is Moderate, used by 31.8% of listings.
- There's a relatively balanced mix between guest-friendly (50.0%) and stricter (50.0%) policies, offering choices for different guest needs.
Recommendations for Hosts
- Consider adopting a Moderate policy to align with the 31.8% market standard in Lanildut.
- Regularly review your cancellation policy against competitors and market demand shifts in Lanildut.
Lanildut STR Booking Lead Time Analysis (2025)
Average Booking Lead Time by Month
Booking Lead Time Insights for Lanildut
- The overall average booking lead time for vacation rentals in Lanildut is 70 days.
- Guests book furthest in advance for stays during July (average 129 days), likely coinciding with peak travel demand or local events.
- The shortest booking windows occur for stays in March (average 36 days), indicating more last-minute travel plans during this time.
- Seasonally, Summer (121 days avg.) sees the longest lead times, while Winter (51 days avg.) has the shortest, reflecting typical travel planning cycles.
Recommendations for Hosts
- Use the overall average lead time (70 days) as a baseline for your pricing and availability strategy in Lanildut.
- For July stays, consider implementing length-of-stay discounts or slightly higher rates for bookings made less than 129 days out to capitalize on advance planning.
- Target marketing efforts for the Summer season well in advance (at least 121 days) to capture early planners.
- Monitor your own booking lead times against these Lanildut averages to identify opportunities for dynamic pricing adjustments.
Popular & Essential Airbnb Amenities in Lanildut (2025)
Amenity Prevalence
Amenity Insights for Lanildut
- Essential amenities in Lanildut that guests expect include: Heating. Lacking these (this) could significantly impact bookings.
- Popular amenities like TV, Kitchen, Free parking on premises are common but not universal. Offering these can provide a competitive edge.
Recommendations for Hosts
- Ensure your listing includes all essential amenities for Lanildut: Heating.
- Consider adding popular differentiators like TV or Kitchen to increase appeal.
- Highlight unique or less common amenities you offer (e.g., hot tub, dedicated workspace, EV charger) in your listing description and photos.
- Regularly check competitor amenities in Lanildut to stay competitive.
Lanildut Airbnb Guest Demographics & Profile Analysis (2025)
Guest Profile Summary for Lanildut
- The typical guest profile for Airbnb in Lanildut consists of primarily domestic travelers (78%), often arriving from nearby Paris, typically belonging to the Post-2000s (Gen Z/Alpha) group (50%), primarily speaking French or English.
- Domestic travelers account for 77.7% of guests.
- Key international markets include France (77.7%) and Germany (7.8%).
- Top languages spoken are French (44%) followed by English (32.4%).
- A significant demographic segment is the Post-2000s (Gen Z/Alpha) group, representing 50% of guests.
Recommendations for Hosts
- Target domestic marketing efforts towards travelers from Paris and Rennes.
- Tailor amenities and listing descriptions to appeal to the dominant Post-2000s (Gen Z/Alpha) demographic (e.g., highlight fast WiFi, smart home features, local guides).
- Highlight unique local experiences or amenities relevant to the primary guest profile.
- Consider seasonal promotions aligned with peak travel times for key origin markets.
Nearby Short-Term Rental Market Comparison
How does the Lanildut Airbnb market stack up against its neighbors? Compare key performance metrics like average monthly revenue, ADR, and occupancy rates in surrounding areas to understand the broader regional STR landscape.
| Market | Active Properties | Monthly Revenue | Daily Rate | Avg. Occupancy |
|---|---|---|---|---|
| Île-de-Bréhat | 46 | $2,254 | $221.52 | 45% |
| Ushant | 64 | $2,087 | $152.83 | 54% |
| Lanmodez | 19 | $2,050 | $219.93 | 42% |
| Guern | 13 | $1,802 | $102.72 | 42% |
| Landaul | 17 | $1,697 | $148.36 | 45% |
| Plourin | 16 | $1,686 | $176.47 | 45% |
| Sainte-Brigitte | 11 | $1,652 | $164.87 | 39% |
| Langoat | 10 | $1,645 | $105.20 | 58% |
| Plounéour-Brignogan-Plages | 170 | $1,596 | $192.20 | 39% |
| Sibiril | 43 | $1,568 | $162.58 | 44% |