Landivisiau Airbnb Market Analysis 2025: Short Term Rental Data & Vacation Rental Statistics in Brittany, France
Is Airbnb profitable in Landivisiau in 2025? Explore comprehensive Airbnb analytics for Landivisiau, Brittany, France to uncover income potential. This 2025 STR market report for Landivisiau, based on AirROI data from April 2024 to March 2025, reveals key trends in the niche market of 28 active listings.
Whether you're considering an Airbnb investment in Landivisiau, optimizing your existing vacation rental, or exploring rental arbitrage opportunities, understanding the Landivisiau Airbnb data is crucial. Understanding the local regulations is key to maximizing your short term rental income potential. Let's dive into the specifics.
Key Landivisiau Airbnb Performance Metrics Overview
Monthly Airbnb Revenue Variations & Income Potential in Landivisiau (2025)
Understanding the monthly revenue variations for Airbnb listings in Landivisiau is key to maximizing your short term rental income potential. Seasonality significantly impacts earnings. Our analysis, based on data from the past 12 months, shows that the peak revenue month for STRs in Landivisiau is typically August, while March often presents the lowest earnings, highlighting opportunities for strategic pricing adjustments during shoulder and low seasons. Explore the typical Airbnb income in Landivisiau across different performance tiers:
- Best-in-class properties (Top 10%) achieve $2,305+ monthly, often utilizing dynamic pricing and superior guest experiences.
- Strong performing properties (Top 25%) earn $1,581 or more, indicating effective management and desirable locations/amenities.
- Typical properties (Median) generate around $858 per month, representing the average market performance.
- Entry-level properties (Bottom 25%) see earnings around $483, often with potential for optimization.
Average Monthly Airbnb Earnings Trend in Landivisiau
Landivisiau Airbnb Occupancy Rate Trends (2025)
Maximize your bookings by understanding the Landivisiau STR occupancy trends. Seasonal demand shifts significantly influence how often properties are booked. Typically, Augustsees the highest demand (peak season occupancy), while March experiences the lowest (low season). Effective strategies, like adjusting minimum stays or offering promotions, can boost occupancy during slower periods. Here's how different property tiers perform in Landivisiau:
- Best-in-class properties (Top 10%) achieve 74%+ occupancy, indicating high desirability and potentially optimized availability.
- Strong performing properties (Top 25%) maintain 59% or higher occupancy, suggesting good market fit and guest satisfaction.
- Typical properties (Median) have an occupancy rate around 41%.
- Entry-level properties (Bottom 25%) average 28% occupancy, potentially facing higher vacancy.
Average Monthly Occupancy Rate Trend in Landivisiau
Average Daily Rate (ADR) Airbnb Trends in Landivisiau (2025)
Effective short term rental pricing strategy in Landivisiau involves understanding monthly ADR fluctuations. The Average Daily Rate (ADR) for Airbnb in Landivisiau typically peaks in July and dips lowest during February. Leveraging Airbnb dynamic pricing tools or strategies based on this seasonality can significantly boost revenue. Here's a look at the typical nightly rates achieved:
- Best-in-class properties (Top 10%) command rates of $161+ per night, often due to premium features or locations.
- Strong performing properties (Top 25%) achieve nightly rates of $121 or more.
- Typical properties (Median) charge around $74 per night.
- Entry-level properties (Bottom 25%) earn around $42 per night.
Average Daily Rate (ADR) Trend by Month in Landivisiau
Get Live Landivisiau Market Intelligence 👇

Explore Real-time Analytics
Airbnb Seasonality Analysis & Trends in Landivisiau (2025)
Peak Season (August, July, May)
- Revenue averages $1,869 per month
- Occupancy rates average 61.2%
- Daily rates average $98
Shoulder Season
- Revenue averages $1,100 per month
- Occupancy maintains around 43.8%
- Daily rates hold near $95
Low Season (January, February, March)
- Revenue drops to average $596 per month
- Occupancy decreases to average 28.1%
- Daily rates adjust to average $90
Seasonality Insights for Landivisiau
- The Airbnb seasonality in Landivisiau shows highly seasonal trends requiring careful strategy. While the sections above show seasonal averages, it's also insightful to look at the extremes:
- During the high season, the absolute peak month showcases Landivisiau's highest earning potential, with monthly revenues capable of climbing to $2,112, occupancy reaching a high of 63.0%, and ADRs peaking at $101.
- Conversely, the slowest single month of the year, typically falling within the low season, marks the market's lowest point. In this month, revenue might dip to $493, occupancy could drop to 24.4%, and ADRs may adjust down to $89.
- Understanding both the seasonal averages and these monthly peaks and troughs in revenue, occupancy, and ADR is crucial for maximizing your Airbnb profit potential in Landivisiau.
Seasonal Strategies for Maximizing Profit
- Peak Season: Maximize revenue through premium pricing and potentially longer minimum stays. Ensure high availability.
- Low Season: Offer competitive pricing, special promotions (e.g., extended stay discounts), and flexible cancellation policies. Target off-season travelers like remote workers or budget-conscious guests.
- Shoulder Seasons: Implement dynamic pricing that balances peak and low rates. Target weekend travelers or specific events. Offer slightly more flexible terms than peak season.
- Regularly analyze your own performance against these Landivisiau seasonality benchmarks and adjust your pricing and availability strategy accordingly.
Best Areas for Airbnb Investment in Landivisiau (2025)
Exploring the top neighborhoods for short-term rentals in Landivisiau? This section highlights key areas, outlining why they are attractive for hosts and guests, along with notable local attractions. Consider these locations based on your target guest profile and investment strategy.
| Neighborhood / Area | Why Host Here? (Target Guests & Appeal) | Key Attractions & Landmarks |
|---|---|---|
| Centre-ville de Landivisiau | Le centre-ville historique est le cœur de la ville, parfait pour les visiteurs souhaitant explorer les commerces locaux, les restaurants et les traditions bretonnes. Il offre une véritable expérience culturele avec des événements locaux. | L'église Saint-Thurien, Le musée de la ville, Les cafés bretons, Marché local, Jardins publics |
| Les abords du Canal de Nantes à Brest | Un cadre naturel agréable ideal pour des activités en plein air. Attire les amateurs de nature et de randonnée, avec une tranquillité appréciée des familles et des couples. | Canal de Nantes à Brest, Pistes cyclables, Aire de pique-nique, Randonnées, Observation des oiseaux |
| Parc des expositions de Landivisiau | Accueil de divers événements, foires et salons. Idéal pour les groupes ou les individus voyageant pour des affaires ou des événements. | Événements locaux, Salons gastronomiques, Foires artisanales |
| Les villages environnants (comme Lanhouarneau) | Ces charmants villages bretons offrent une ambiance paisible et authentique, attirant ceux qui recherchent un hébergement typique. | Châteaux et manoirs, Églises historiques, Sentiers de randonnée, Gastronomie bretonne locale |
| Les plages de la Côte des Légendes | À quelques kilomètres de Landivisiau, ces plages sont un atout majeur pour les touristes, surtout pendant l'été, offrant des activités balnéaires. | Plage de Kernic, Activités nautiques, Sentiers côtiers, Café de plage |
| La ville de Morlaix (à proximité) | Une ville portuaire pittoresque avec des attractions historiques. Idéal pour les visiteurs intéressés par l'histoire et la culture. | Le viaduc de Morlaix, Les maisons à pans de bois, Le château de Kerduel, Les boutiques artisanales |
| Réserve naturelle de la baie de Goulven | Parfait pour les amoureux de la nature et les photographes, offrant des paysages extraordinaires et une biodiversité riche. | Observation des oiseaux, Balades en bord de mer, Photographie de paysages, Marais salants à proximité |
| Les marchés locaux | Les marchés hebdomadaires de Landivisiau sont un grand attrait pour les visiteurs. Ils permettent de découvrir la gastronomie locale et l'artisanat. | Marché du dimanche, Produits locaux, Artisans bretons, Attractions culturelles autour des marchés |
Understanding Airbnb License Requirements & STR Laws in Landivisiau (2025)
With 14% of listings showing registration in 2025, understanding potential Airbnb license requirements is crucial in Landivisiau. Always verify the latest short term rental regulations and Airbnb license requirements directly with local government authorities for Landivisiau to ensure full compliance before hosting.
(Source: AirROI data, 2025, based on 14% licensed listings)
Top Performing Airbnb Properties in Landivisiau (2025)
Benchmark your potential! Explore examples of top-performing Airbnb properties in Landivisiaubased on Trailing Twelve Month (TTM) revenue. Analyze their characteristics, revenue, occupancy rate, and ADR to understand what drives success in this market.
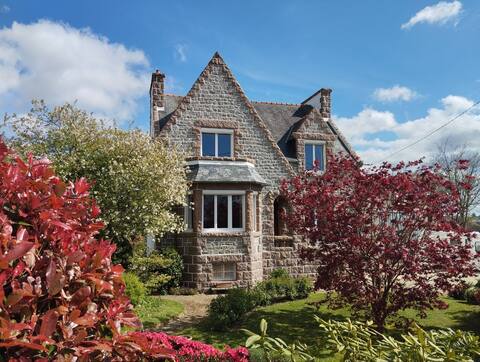
Pink granite villa in Brittany
Entire Place • 4 bedrooms
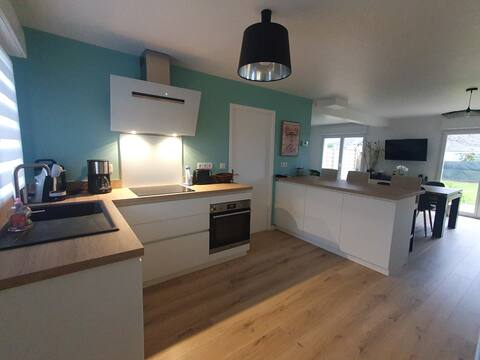
Cozy house between land and sea
Entire Place • 2 bedrooms
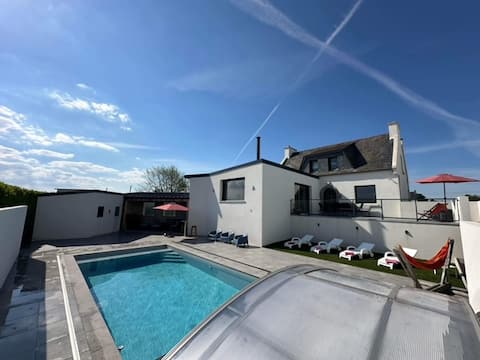
Between Land and Sea 12 people Pool area
Entire Place • 6 bedrooms

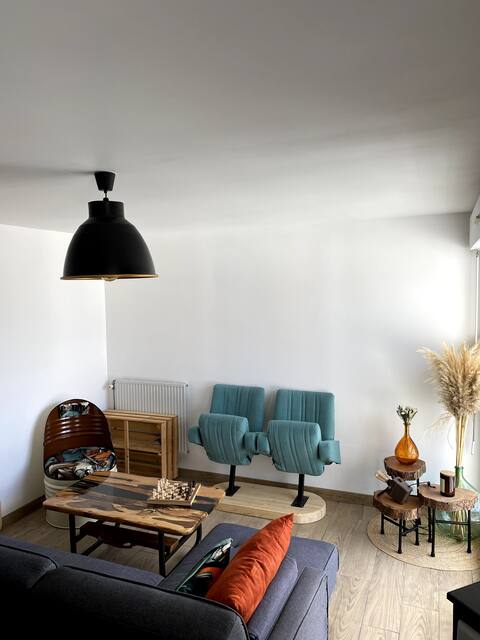
Large country house 2 min from the expressway
Entire Place • 6 bedrooms
Appart' Landi
Entire Place • 1 bedroom

RJ - Concierge BnB - Lodging in the middle of the forest
Entire Place • 4 bedrooms
Note: Performance varies based on location, size, amenities, seasonality, and management quality. Data reflects the past 12 months.
Top Performing Airbnb Hosts in Landivisiau (2025)
Learn from the best! This table showcases top-performing Airbnb hosts in Landivisiau based on the number of properties managed and estimated total revenue over the past year. Analyze their scale and performance metrics.
| Host Name | Properties | Grossing Revenue | Stay Reviews | Avg Rating |
|---|---|---|---|---|
| Emmanuel | 1 | $24,321 | 55 | 4.78/5.0 |
| Aurelie | 1 | $22,729 | 17 | 5.00/5.0 |
| Myriam | 1 | $22,179 | 6 | 4.83/5.0 |
| Michel | 2 | $21,150 | 237 | 5.00/5.0 |
| Ludivine | 1 | $18,201 | 8 | 4.88/5.0 |
| Fanny | 1 | $15,370 | 11 | 4.91/5.0 |
| Concierge Bb | 1 | $14,863 | 3 | 4.67/5.0 |
| Lydie | 3 | $14,330 | 168 | 4.83/5.0 |
| Johanna | 1 | $13,791 | 21 | 4.86/5.0 |
| Marion | 3 | $13,039 | 47 | 4.68/5.0 |
Analyzing the strategies of top hosts, such as their property selection, pricing, and guest communication, can offer valuable lessons for optimizing your own Airbnb operations in Landivisiau.
Dive Deeper: Advanced Landivisiau STR Market Data (2025)
Ready to unlock more insights? AirROI provides access to advanced metrics and comprehensive Airbnb data for Landivisiau. Explore detailed analytics beyond this report to refine your investment strategy, optimize pricing, and maximize your vacation rental profits.
Explore Advanced MetricsLandivisiau Short-Term Rental Market Composition (2025): Property & Room Types
Room Type Distribution
Property Type Distribution
Market Composition Insights for Landivisiau
- The Landivisiau Airbnb market composition is heavily skewed towards Entire Home/Apt listings, which make up 57.1% of the 28 active rentals. This indicates strong guest preference for privacy and space.
- However, a notable 42.9% share for Private Rooms suggests opportunities for budget-conscious travelers or hosts renting out spare rooms.
- Looking at the property type distribution in Landivisiau, House properties are the most common (71.4%), reflecting the local real estate landscape.
- Houses represent a significant 71.4% portion, catering likely to families or larger groups.
- The presence of 10.7% Hotel/Boutique listings indicates integration with traditional hospitality.
Landivisiau Airbnb Room Capacity Analysis (2025): Bedroom Distribution
Distribution of Listings by Number of Bedrooms
Room Capacity Insights for Landivisiau
- The dominant room capacity in Landivisiau is 1 bedroom listings, making up 28.6% of the market. This suggests a strong demand for properties suitable for couples or solo travelers.
- Together, 1 bedroom and 2 bedrooms properties represent 42.9% of the active Airbnb listings in Landivisiau, indicating a high concentration in these sizes.
- A significant 28.5% of listings offer 3+ bedrooms, catering to larger groups and families seeking more space in Landivisiau.
Landivisiau Vacation Rental Guest Capacity Trends (2025)
Distribution of Listings by Guest Capacity
Guest Capacity Insights for Landivisiau
- The most common guest capacity trend in Landivisiau vacation rentals is listings accommodating 2 guests (21.4%). This suggests the primary traveler segment is likely couples or solo travelers.
- Properties designed for 2 guests and 8+ guests dominate the Landivisiau STR market, accounting for 39.3% of listings.
- 25.0% of properties accommodate 6+ guests, serving the market segment for larger families or group travel in Landivisiau.
- On average, properties in Landivisiau are equipped to host 2.9 guests.
Landivisiau Airbnb Booking Patterns (2025): Available vs. Booked Days
Available Days Distribution
Booked Days Distribution
Booking Pattern Insights for Landivisiau
- The most common availability pattern in Landivisiau falls within the 271-366 days range, representing 42.9% of listings. This suggests many properties have significant open periods on their calendars.
- Approximately 75.0% of listings show high availability (181+ days open annually), indicating potential for increased bookings or specific owner usage patterns.
- For booked days, the 31-90 days range is most frequent in Landivisiau (32.1%), reflecting common guest stay durations or potential owner blocking patterns.
- A notable 28.6% of properties secure long booking periods (181+ days booked per year), highlighting successful long-term rental strategies or significant owner usage.
Landivisiau Airbnb Minimum Stay Requirements Analysis
Distribution of Listings by Minimum Night Requirement
1 Night
12 listings
48% of total
2 Nights
9 listings
36% of total
3 Nights
2 listings
8% of total
7-29 Nights
1 listings
4% of total
30+ Nights
1 listings
4% of total
Key Insights
- The most prevalent minimum stay requirement in Landivisiau is 1 Night, adopted by 48% of listings. This highlights the market's preference for shorter, flexible bookings.
- A strong majority (84.0%) of the Landivisiau Airbnb data shows acceptance of very short stays (1-2 nights), indicating a dynamic, high-turnover market.
Recommendations
- Align with the market by considering a 1 Night minimum stay, as 48% of Landivisiau hosts use this setting.
- Adjust minimum nights based on seasonality – potentially shorter during low season and longer during peak demand periods in Landivisiau.
Landivisiau Airbnb Cancellation Policy Trends Analysis (2025)
Flexible
12 listings
54.5% of total
Moderate
7 listings
31.8% of total
Firm
2 listings
9.1% of total
Strict
1 listings
4.5% of total
Cancellation Policy Insights for Landivisiau
- The prevailing Airbnb cancellation policy trend in Landivisiau is Flexible, used by 54.5% of listings.
- The market strongly favors guest-friendly terms, with 86.3% of listings offering Flexible or Moderate policies. This suggests guests in Landivisiau may expect booking flexibility.
- Strict cancellation policies are quite rare (4.5%), potentially making listings with this policy less competitive unless justified by high demand or property type.
Recommendations for Hosts
- Consider adopting a Flexible policy to align with the 54.5% market standard in Landivisiau.
- Given the high prevalence of Flexible policies (54.5%), offering this can enhance booking appeal, especially during shoulder seasons.
- Using a Strict policy might deter some guests, as only 4.5% of listings use it. Evaluate if potential revenue protection outweighs possible lower booking rates.
- Regularly review your cancellation policy against competitors and market demand shifts in Landivisiau.
Landivisiau STR Booking Lead Time Analysis (2025)
Average Booking Lead Time by Month
Booking Lead Time Insights for Landivisiau
- The overall average booking lead time for vacation rentals in Landivisiau is 39 days.
- Guests book furthest in advance for stays during May (average 68 days), likely coinciding with peak travel demand or local events.
- The shortest booking windows occur for stays in March (average 15 days), indicating more last-minute travel plans during this time.
- Seasonally, Winter (62 days avg.) sees the longest lead times, while Fall (35 days avg.) has the shortest, reflecting typical travel planning cycles.
Recommendations for Hosts
- Use the overall average lead time (39 days) as a baseline for your pricing and availability strategy in Landivisiau.
- For May stays, consider implementing length-of-stay discounts or slightly higher rates for bookings made less than 68 days out to capitalize on advance planning.
- Target marketing efforts for the Winter season well in advance (at least 62 days) to capture early planners.
- Monitor your own booking lead times against these Landivisiau averages to identify opportunities for dynamic pricing adjustments.
Popular & Essential Airbnb Amenities in Landivisiau (2025)
Amenity Prevalence
Amenity Insights for Landivisiau
- Essential amenities in Landivisiau that guests expect include: Smoke alarm, Hot water. Lacking these (any) could significantly impact bookings.
- Popular amenities like Wifi, Kitchen, TV are common but not universal. Offering these can provide a competitive edge.
- Warning: Wifi is not universally provided but is considered essential globally. Ensure reliable Wifi is offered.
Recommendations for Hosts
- Ensure your listing includes all essential amenities for Landivisiau: Smoke alarm, Hot water.
- Prioritize adding missing essentials: Smoke alarm, Hot water.
- Consider adding popular differentiators like Wifi or Kitchen to increase appeal.
- Highlight unique or less common amenities you offer (e.g., hot tub, dedicated workspace, EV charger) in your listing description and photos.
- Regularly check competitor amenities in Landivisiau to stay competitive.
Landivisiau Airbnb Guest Demographics & Profile Analysis (2025)
Guest Profile Summary for Landivisiau
- The typical guest profile for Airbnb in Landivisiau consists of primarily domestic travelers (88%), often arriving from nearby Paris, typically belonging to the Post-2000s (Gen Z/Alpha) group (50%), primarily speaking French or English.
- Domestic travelers account for 88.3% of guests.
- Key international markets include France (88.3%) and United Kingdom (3.9%).
- Top languages spoken are French (44.4%) followed by English (33.3%).
- A significant demographic segment is the Post-2000s (Gen Z/Alpha) group, representing 50% of guests.
Recommendations for Hosts
- Target domestic marketing efforts towards travelers from Paris and Rennes.
- Tailor amenities and listing descriptions to appeal to the dominant Post-2000s (Gen Z/Alpha) demographic (e.g., highlight fast WiFi, smart home features, local guides).
- Highlight unique local experiences or amenities relevant to the primary guest profile.
- Consider seasonal promotions aligned with peak travel times for key origin markets.
Nearby Short-Term Rental Market Comparison
How does the Landivisiau Airbnb market stack up against its neighbors? Compare key performance metrics like average monthly revenue, ADR, and occupancy rates in surrounding areas to understand the broader regional STR landscape.
| Market | Active Properties | Monthly Revenue | Daily Rate | Avg. Occupancy |
|---|---|---|---|---|
| Île-de-Bréhat | 46 | $2,254 | $221.52 | 45% |
| Ushant | 64 | $2,087 | $152.83 | 54% |
| Lanmodez | 19 | $2,050 | $219.93 | 42% |
| Guern | 13 | $1,802 | $102.72 | 42% |
| Landaul | 17 | $1,697 | $148.36 | 45% |
| Plourin | 16 | $1,686 | $176.47 | 45% |
| Sainte-Brigitte | 11 | $1,652 | $164.87 | 39% |
| Langoat | 10 | $1,645 | $105.20 | 58% |
| Plounéour-Brignogan-Plages | 170 | $1,596 | $192.20 | 39% |
| Sibiril | 43 | $1,568 | $162.58 | 44% |