La Richardais Airbnb Market Analysis 2025: Short Term Rental Data & Vacation Rental Statistics in Brittany, France
Is Airbnb profitable in La Richardais in 2025? Explore comprehensive Airbnb analytics for La Richardais, Brittany, France to uncover income potential. This 2025 STR market report for La Richardais, based on AirROI data from April 2024 to March 2025, reveals key trends in the niche market of 67 active listings.
Whether you're considering an Airbnb investment in La Richardais, optimizing your existing vacation rental, or exploring rental arbitrage opportunities, understanding the La Richardais Airbnb data is crucial. Understanding the local regulations is key to maximizing your short term rental income potential. Let's dive into the specifics.
Key La Richardais Airbnb Performance Metrics Overview
Monthly Airbnb Revenue Variations & Income Potential in La Richardais (2025)
Understanding the monthly revenue variations for Airbnb listings in La Richardais is key to maximizing your short term rental income potential. Seasonality significantly impacts earnings. Our analysis, based on data from the past 12 months, shows that the peak revenue month for STRs in La Richardais is typically August, while March often presents the lowest earnings, highlighting opportunities for strategic pricing adjustments during shoulder and low seasons. Explore the typical Airbnb income in La Richardais across different performance tiers:
- Best-in-class properties (Top 10%) achieve $4,873+ monthly, often utilizing dynamic pricing and superior guest experiences.
- Strong performing properties (Top 25%) earn $2,560 or more, indicating effective management and desirable locations/amenities.
- Typical properties (Median) generate around $1,410 per month, representing the average market performance.
- Entry-level properties (Bottom 25%) see earnings around $705, often with potential for optimization.
Average Monthly Airbnb Earnings Trend in La Richardais
La Richardais Airbnb Occupancy Rate Trends (2025)
Maximize your bookings by understanding the La Richardais STR occupancy trends. Seasonal demand shifts significantly influence how often properties are booked. Typically, Augustsees the highest demand (peak season occupancy), while January experiences the lowest (low season). Effective strategies, like adjusting minimum stays or offering promotions, can boost occupancy during slower periods. Here's how different property tiers perform in La Richardais:
- Best-in-class properties (Top 10%) achieve 78%+ occupancy, indicating high desirability and potentially optimized availability.
- Strong performing properties (Top 25%) maintain 56% or higher occupancy, suggesting good market fit and guest satisfaction.
- Typical properties (Median) have an occupancy rate around 37%.
- Entry-level properties (Bottom 25%) average 19% occupancy, potentially facing higher vacancy.
Average Monthly Occupancy Rate Trend in La Richardais
Average Daily Rate (ADR) Airbnb Trends in La Richardais (2025)
Effective short term rental pricing strategy in La Richardais involves understanding monthly ADR fluctuations. The Average Daily Rate (ADR) for Airbnb in La Richardais typically peaks in November and dips lowest during October. Leveraging Airbnb dynamic pricing tools or strategies based on this seasonality can significantly boost revenue. Here's a look at the typical nightly rates achieved:
- Best-in-class properties (Top 10%) command rates of $247+ per night, often due to premium features or locations.
- Strong performing properties (Top 25%) achieve nightly rates of $188 or more.
- Typical properties (Median) charge around $117 per night.
- Entry-level properties (Bottom 25%) earn around $81 per night.
Average Daily Rate (ADR) Trend by Month in La Richardais
Get Live La Richardais Market Intelligence 👇

Explore Real-time Analytics
Airbnb Seasonality Analysis & Trends in La Richardais (2025)
Peak Season (August, July, April)
- Revenue averages $2,934 per month
- Occupancy rates average 55.9%
- Daily rates average $154
Shoulder Season
- Revenue averages $2,014 per month
- Occupancy maintains around 38.4%
- Daily rates hold near $153
Low Season (January, February, March)
- Revenue drops to average $1,240 per month
- Occupancy decreases to average 27.1%
- Daily rates adjust to average $160
Seasonality Insights for La Richardais
- The Airbnb seasonality in La Richardais shows highly seasonal trends requiring careful strategy. While the sections above show seasonal averages, it's also insightful to look at the extremes:
- During the high season, the absolute peak month showcases La Richardais's highest earning potential, with monthly revenues capable of climbing to $3,603, occupancy reaching a high of 72.1%, and ADRs peaking at $165.
- Conversely, the slowest single month of the year, typically falling within the low season, marks the market's lowest point. In this month, revenue might dip to $1,069, occupancy could drop to 25.4%, and ADRs may adjust down to $147.
- Understanding both the seasonal averages and these monthly peaks and troughs in revenue, occupancy, and ADR is crucial for maximizing your Airbnb profit potential in La Richardais.
Seasonal Strategies for Maximizing Profit
- Peak Season: Maximize revenue through premium pricing and potentially longer minimum stays. Ensure high availability.
- Low Season: Offer competitive pricing, special promotions (e.g., extended stay discounts), and flexible cancellation policies. Target off-season travelers like remote workers or budget-conscious guests.
- Shoulder Seasons: Implement dynamic pricing that balances peak and low rates. Target weekend travelers or specific events. Offer slightly more flexible terms than peak season.
- Regularly analyze your own performance against these La Richardais seasonality benchmarks and adjust your pricing and availability strategy accordingly.
Best Areas for Airbnb Investment in La Richardais (2025)
Exploring the top neighborhoods for short-term rentals in La Richardais? This section highlights key areas, outlining why they are attractive for hosts and guests, along with notable local attractions. Consider these locations based on your target guest profile and investment strategy.
| Neighborhood / Area | Why Host Here? (Target Guests & Appeal) | Key Attractions & Landmarks |
|---|---|---|
| Port de la Richardais | A picturesque harbor area that offers scenic views and a tranquil atmosphere. It's popular with families and tourists looking to enjoy water activities and local cuisine. | Harbour walks, Boat rentals, Local seafood restaurants, Cycle paths along the coast |
| Saint-Malo Beach | World-famous for its stunning beaches and historic architecture, attracting beach-goers and history buffs alike. It's a short drive away and draws visitors throughout the summer. | Intra-Muros, Grand Bé, Saint-Malo Cathedral, Beach activities, Historical museums |
| Dinard | A charming coastal town across from Saint-Malo, known for its beautiful villas and beaches. A popular getaway for those looking to relax by the sea and enjoy local culture. | Plage de la Malouine, Dinard market, Villa Les Roches Brunes, Walks along the coastline, Dinard's arts festival |
| Rance River | The scenic river area provides a serene backdrop for outdoor activities such as kayaking and hiking, appealing to nature lovers and individuals looking for peace and tranquility. | Kayaking on the Rance, Hiking trails, Local flora and fauna, Fishing spots |
| Combourg | A historical town known for its medieval castle and romantic lakes, making it a unique destination for guests interested in culture and history, just a short drive from La Richardais. | Château de Combourg, Lac Tranquille, St. Stephen's Church, Cultural festivals |
| Cancale | Home to some of the finest oysters in France, Cancale is a seafood haven and attracts gourmets and tourists looking to indulge in local cuisine near the coast. | Oyster farms, Tides and the Ocean, Cancale Market, Restaurants with sea views |
| Dinan | An enchanting medieval town with cobbled streets and historic buildings, a draw for guests who appreciate rich history and stunning architecture, less than an hour's drive away. | Dinan Castle, Rance river views, Art galleries, Local artisan shops |
| Saint-Cast-le-Guildo | A lovely seaside resort known for its beaches and water sports, perfect for families and sun-seekers looking for a beach holiday experience in Brittany. | Plage de la Mare, Water sports, Coastal paths, Relaxation and wellness centers |
Understanding Airbnb License Requirements & STR Laws in La Richardais (2025)
With 10% of listings showing registration in 2025, understanding potential Airbnb license requirements is crucial in La Richardais. Always verify the latest short term rental regulations and Airbnb license requirements directly with local government authorities for La Richardais to ensure full compliance before hosting.
(Source: AirROI data, 2025, based on 10% licensed listings)
Top Performing Airbnb Properties in La Richardais (2025)
Benchmark your potential! Explore examples of top-performing Airbnb properties in La Richardaisbased on Trailing Twelve Month (TTM) revenue. Analyze their characteristics, revenue, occupancy rate, and ADR to understand what drives success in this market.
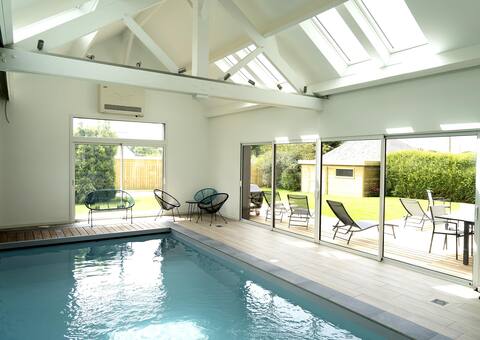
Architect villa with indoor pool
Entire Place • 4 bedrooms
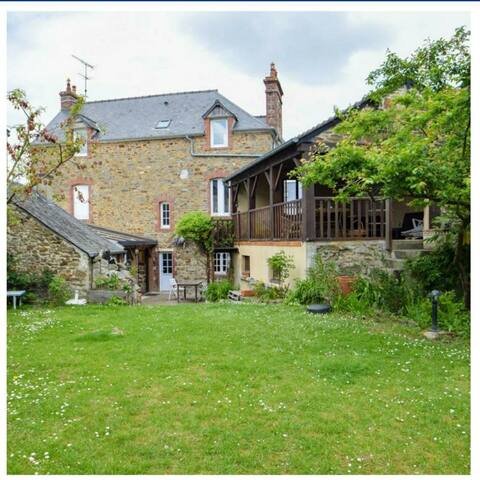
"La Colline" Family house 100 m from the Rance
Entire Place • 5 bedrooms
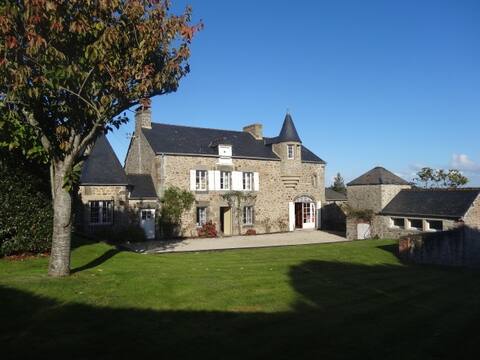
House of character Dinard, 10 pers., beach access
Entire Place • 6 bedrooms
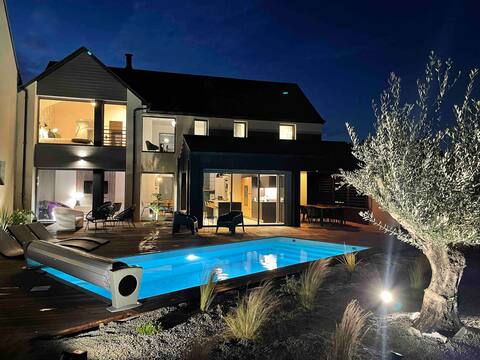
5* architect house near Dinard LA VILLA SWEET
Entire Place • 4 bedrooms
Cozy house 8 people 10 min from the banks of the Rance
Entire Place • 4 bedrooms
"Petit French Cottage" next to the water
Entire Place • 3 bedrooms
Note: Performance varies based on location, size, amenities, seasonality, and management quality. Data reflects the past 12 months.
Top Performing Airbnb Hosts in La Richardais (2025)
Learn from the best! This table showcases top-performing Airbnb hosts in La Richardais based on the number of properties managed and estimated total revenue over the past year. Analyze their scale and performance metrics.
| Host Name | Properties | Grossing Revenue | Stay Reviews | Avg Rating |
|---|---|---|---|---|
| Karen | 1 | $97,861 | 79 | 4.99/5.0 |
| Sandrine | 2 | $83,301 | 168 | 4.99/5.0 |
| Anne-Sophie - Interhome Group | 10 | $66,514 | 58 | 2.67/5.0 |
| Jean-Christophe | 1 | $63,779 | 22 | 4.45/5.0 |
| Béatrice | 1 | $54,476 | 38 | 4.95/5.0 |
| Mathilde | 1 | $49,250 | 27 | 4.78/5.0 |
| Lilli Et Edouard | 1 | $48,812 | 52 | 4.98/5.0 |
| Valerie | 1 | $48,698 | 20 | 5.00/5.0 |
| Host #183762669 | 2 | $46,736 | 607 | 4.92/5.0 |
| Valérie | 1 | $38,481 | 42 | 4.98/5.0 |
Analyzing the strategies of top hosts, such as their property selection, pricing, and guest communication, can offer valuable lessons for optimizing your own Airbnb operations in La Richardais.
Dive Deeper: Advanced La Richardais STR Market Data (2025)
Ready to unlock more insights? AirROI provides access to advanced metrics and comprehensive Airbnb data for La Richardais. Explore detailed analytics beyond this report to refine your investment strategy, optimize pricing, and maximize your vacation rental profits.
Explore Advanced MetricsLa Richardais Short-Term Rental Market Composition (2025): Property & Room Types
Room Type Distribution
Property Type Distribution
Market Composition Insights for La Richardais
- The La Richardais Airbnb market composition is heavily skewed towards Entire Home/Apt listings, which make up 95.5% of the 67 active rentals. This indicates strong guest preference for privacy and space.
- Looking at the property type distribution in La Richardais, House properties are the most common (64.2%), reflecting the local real estate landscape.
- Houses represent a significant 64.2% portion, catering likely to families or larger groups.
- Smaller segments like hotel/boutique, others (combined 4.5%) offer potential for unique stay experiences.
La Richardais Airbnb Room Capacity Analysis (2025): Bedroom Distribution
Distribution of Listings by Number of Bedrooms
Room Capacity Insights for La Richardais
- The dominant room capacity in La Richardais is 2 bedrooms listings, making up 25.4% of the market. This suggests a strong demand for properties suitable for couples or solo travelers.
- Together, 2 bedrooms and 4 bedrooms properties represent 49.3% of the active Airbnb listings in La Richardais, indicating a high concentration in these sizes.
- A significant 43.3% of listings offer 3+ bedrooms, catering to larger groups and families seeking more space in La Richardais.
La Richardais Vacation Rental Guest Capacity Trends (2025)
Distribution of Listings by Guest Capacity
Guest Capacity Insights for La Richardais
- The most common guest capacity trend in La Richardais vacation rentals is listings accommodating 8+ guests (23.9%). This suggests the primary traveler segment is likely larger groups.
- Properties designed for 8+ guests and 6 guests dominate the La Richardais STR market, accounting for 44.8% of listings.
- 49.3% of properties accommodate 6+ guests, serving the market segment for larger families or group travel in La Richardais.
- On average, properties in La Richardais are equipped to host 5.0 guests.
La Richardais Airbnb Booking Patterns (2025): Available vs. Booked Days
Available Days Distribution
Booked Days Distribution
Booking Pattern Insights for La Richardais
- The most common availability pattern in La Richardais falls within the 271-366 days range, representing 46.3% of listings. This suggests many properties have significant open periods on their calendars.
- Approximately 85.1% of listings show high availability (181+ days open annually), indicating potential for increased bookings or specific owner usage patterns.
- For booked days, the 91-180 days range is most frequent in La Richardais (38.8%), reflecting common guest stay durations or potential owner blocking patterns.
- A notable 16.4% of properties secure long booking periods (181+ days booked per year), highlighting successful long-term rental strategies or significant owner usage.
La Richardais Airbnb Minimum Stay Requirements Analysis
Distribution of Listings by Minimum Night Requirement
1 Night
9 listings
14.8% of total
2 Nights
14 listings
23% of total
3 Nights
14 listings
23% of total
4-6 Nights
11 listings
18% of total
7-29 Nights
5 listings
8.2% of total
30+ Nights
8 listings
13.1% of total
Key Insights
- The most prevalent minimum stay requirement in La Richardais is 2 Nights, adopted by 23% of listings. This highlights the market's preference for shorter, flexible bookings.
- A significant segment (13.1%) caters to monthly stays (30+ nights) in La Richardais, pointing to opportunities in the extended-stay market.
Recommendations
- Align with the market by considering a 2 Nights minimum stay, as 23% of La Richardais hosts use this setting.
- If feasible, allowing 1-night stays, especially midweek or during low season, could capture last-minute bookings, as only 14.8% currently do.
- Explore offering discounts for stays of 30+ nights to attract the 13.1% of the market seeking extended stays.
- Adjust minimum nights based on seasonality – potentially shorter during low season and longer during peak demand periods in La Richardais.
La Richardais Airbnb Cancellation Policy Trends Analysis (2025)
Super Strict 30 Days
1 listings
1.7% of total
Flexible
11 listings
19% of total
Moderate
14 listings
24.1% of total
Firm
21 listings
36.2% of total
Strict
11 listings
19% of total
Cancellation Policy Insights for La Richardais
- The prevailing Airbnb cancellation policy trend in La Richardais is Firm, used by 36.2% of listings.
- A majority (55.2%) of hosts in La Richardais utilize Firm or Strict policies, indicating a market where hosts prioritize booking security.
Recommendations for Hosts
- Consider adopting a Firm policy to align with the 36.2% market standard in La Richardais.
- Regularly review your cancellation policy against competitors and market demand shifts in La Richardais.
La Richardais STR Booking Lead Time Analysis (2025)
Average Booking Lead Time by Month
Booking Lead Time Insights for La Richardais
- The overall average booking lead time for vacation rentals in La Richardais is 61 days.
- Guests book furthest in advance for stays during July (average 92 days), likely coinciding with peak travel demand or local events.
- The shortest booking windows occur for stays in February (average 23 days), indicating more last-minute travel plans during this time.
- Seasonally, Summer (83 days avg.) sees the longest lead times, while Winter (37 days avg.) has the shortest, reflecting typical travel planning cycles.
Recommendations for Hosts
- Use the overall average lead time (61 days) as a baseline for your pricing and availability strategy in La Richardais.
- For July stays, consider implementing length-of-stay discounts or slightly higher rates for bookings made less than 92 days out to capitalize on advance planning.
- Target marketing efforts for the Summer season well in advance (at least 83 days) to capture early planners.
- Monitor your own booking lead times against these La Richardais averages to identify opportunities for dynamic pricing adjustments.
Popular & Essential Airbnb Amenities in La Richardais (2025)
Amenity Prevalence
Amenity Insights for La Richardais
- Popular amenities like TV, Hot water, Kitchen are common but not universal. Offering these can provide a competitive edge.
Recommendations for Hosts
- Consider adding popular differentiators like TV or Hot water to increase appeal.
- Highlight unique or less common amenities you offer (e.g., hot tub, dedicated workspace, EV charger) in your listing description and photos.
- Regularly check competitor amenities in La Richardais to stay competitive.
La Richardais Airbnb Guest Demographics & Profile Analysis (2025)
Guest Profile Summary for La Richardais
- The typical guest profile for Airbnb in La Richardais consists of primarily domestic travelers (83%), often arriving from nearby Paris, typically belonging to the Post-2000s (Gen Z/Alpha) group (50%), primarily speaking French or English.
- Domestic travelers account for 82.7% of guests.
- Key international markets include France (82.7%) and Germany (4.7%).
- Top languages spoken are French (45%) followed by English (32%).
- A significant demographic segment is the Post-2000s (Gen Z/Alpha) group, representing 50% of guests.
Recommendations for Hosts
- Target domestic marketing efforts towards travelers from Paris and Rennes.
- Tailor amenities and listing descriptions to appeal to the dominant Post-2000s (Gen Z/Alpha) demographic (e.g., highlight fast WiFi, smart home features, local guides).
- Highlight unique local experiences or amenities relevant to the primary guest profile.
- Consider seasonal promotions aligned with peak travel times for key origin markets.
Nearby Short-Term Rental Market Comparison
How does the La Richardais Airbnb market stack up against its neighbors? Compare key performance metrics like average monthly revenue, ADR, and occupancy rates in surrounding areas to understand the broader regional STR landscape.
| Market | Active Properties | Monthly Revenue | Daily Rate | Avg. Occupancy |
|---|---|---|---|---|
| St Martin | 14 | $4,074 | $436.70 | 51% |
| Saint Lawrence | 11 | $2,911 | $317.86 | 52% |
| St Ouen | 15 | $2,635 | $339.51 | 51% |
| St Clement | 14 | $2,522 | $219.76 | 51% |
| Grouville | 21 | $2,510 | $218.40 | 52% |
| St Helier | 66 | $2,497 | $216.70 | 56% |
| St Saviour | 20 | $2,432 | $199.42 | 54% |
| Tamerville | 10 | $2,338 | $333.77 | 26% |
| Île-de-Bréhat | 46 | $2,254 | $221.52 | 45% |
| Trinity | 12 | $2,208 | $156.98 | 61% |