Caden Airbnb Market Analysis 2025: Short Term Rental Data & Vacation Rental Statistics in Brittany, France
Is Airbnb profitable in Caden in 2025? Explore comprehensive Airbnb analytics for Caden, Brittany, France to uncover income potential. This 2025 STR market report for Caden, based on AirROI data from April 2024 to March 2025, reveals key trends in the niche market of 22 active listings.
Whether you're considering an Airbnb investment in Caden, optimizing your existing vacation rental, or exploring rental arbitrage opportunities, understanding the Caden Airbnb data is crucial. Leveraging the low regulation environment is key to maximizing your short term rental income potential. Let's dive into the specifics.
Key Caden Airbnb Performance Metrics Overview
Monthly Airbnb Revenue Variations & Income Potential in Caden (2025)
Understanding the monthly revenue variations for Airbnb listings in Caden is key to maximizing your short term rental income potential. Seasonality significantly impacts earnings. Our analysis, based on data from the past 12 months, shows that the peak revenue month for STRs in Caden is typically December, while November often presents the lowest earnings, highlighting opportunities for strategic pricing adjustments during shoulder and low seasons. Explore the typical Airbnb income in Caden across different performance tiers:
- Best-in-class properties (Top 10%) achieve $4,417+ monthly, often utilizing dynamic pricing and superior guest experiences.
- Strong performing properties (Top 25%) earn $2,809 or more, indicating effective management and desirable locations/amenities.
- Typical properties (Median) generate around $1,325 per month, representing the average market performance.
- Entry-level properties (Bottom 25%) see earnings around $655, often with potential for optimization.
Average Monthly Airbnb Earnings Trend in Caden
Caden Airbnb Occupancy Rate Trends (2025)
Maximize your bookings by understanding the Caden STR occupancy trends. Seasonal demand shifts significantly influence how often properties are booked. Typically, Augustsees the highest demand (peak season occupancy), while February experiences the lowest (low season). Effective strategies, like adjusting minimum stays or offering promotions, can boost occupancy during slower periods. Here's how different property tiers perform in Caden:
- Best-in-class properties (Top 10%) achieve 70%+ occupancy, indicating high desirability and potentially optimized availability.
- Strong performing properties (Top 25%) maintain 56% or higher occupancy, suggesting good market fit and guest satisfaction.
- Typical properties (Median) have an occupancy rate around 37%.
- Entry-level properties (Bottom 25%) average 18% occupancy, potentially facing higher vacancy.
Average Monthly Occupancy Rate Trend in Caden
Average Daily Rate (ADR) Airbnb Trends in Caden (2025)
Effective short term rental pricing strategy in Caden involves understanding monthly ADR fluctuations. The Average Daily Rate (ADR) for Airbnb in Caden typically peaks in December and dips lowest during November. Leveraging Airbnb dynamic pricing tools or strategies based on this seasonality can significantly boost revenue. Here's a look at the typical nightly rates achieved:
- Best-in-class properties (Top 10%) command rates of $277+ per night, often due to premium features or locations.
- Strong performing properties (Top 25%) achieve nightly rates of $192 or more.
- Typical properties (Median) charge around $118 per night.
- Entry-level properties (Bottom 25%) earn around $68 per night.
Average Daily Rate (ADR) Trend by Month in Caden
Get Live Caden Market Intelligence 👇

Explore Real-time Analytics
Airbnb Seasonality Analysis & Trends in Caden (2025)
Peak Season (December, January, February)
- Revenue averages $3,971 per month
- Occupancy rates average 36.7%
- Daily rates average $206
Shoulder Season
- Revenue averages $2,806 per month
- Occupancy maintains around 42.9%
- Daily rates hold near $175
Low Season (September, October, November)
- Revenue drops to average $1,567 per month
- Occupancy decreases to average 32.3%
- Daily rates adjust to average $162
Seasonality Insights for Caden
- The Airbnb seasonality in Caden shows highly seasonal trends requiring careful strategy. While the sections above show seasonal averages, it's also insightful to look at the extremes:
- During the high season, the absolute peak month showcases Caden's highest earning potential, with monthly revenues capable of climbing to $4,547, occupancy reaching a high of 68.0%, and ADRs peaking at $213.
- Conversely, the slowest single month of the year, typically falling within the low season, marks the market's lowest point. In this month, revenue might dip to $1,345, occupancy could drop to 26.4%, and ADRs may adjust down to $151.
- Understanding both the seasonal averages and these monthly peaks and troughs in revenue, occupancy, and ADR is crucial for maximizing your Airbnb profit potential in Caden.
Seasonal Strategies for Maximizing Profit
- Peak Season: Maximize revenue through premium pricing and potentially longer minimum stays. Ensure high availability.
- Low Season: Offer competitive pricing, special promotions (e.g., extended stay discounts), and flexible cancellation policies. Target off-season travelers like remote workers or budget-conscious guests.
- Shoulder Seasons: Implement dynamic pricing that balances peak and low rates. Target weekend travelers or specific events. Offer slightly more flexible terms than peak season.
- Regularly analyze your own performance against these Caden seasonality benchmarks and adjust your pricing and availability strategy accordingly.
Best Areas for Airbnb Investment in Caden (2025)
Exploring the top neighborhoods for short-term rentals in Caden? This section highlights key areas, outlining why they are attractive for hosts and guests, along with notable local attractions. Consider these locations based on your target guest profile and investment strategy.
| Neighborhood / Area | Why Host Here? (Target Guests & Appeal) | Key Attractions & Landmarks |
|---|---|---|
| Quimper | Charming historical city known for its medieval architecture and vibrant cultural scene. Quimper is a popular destination for those looking to explore Brittany's heritage, making it a great spot for hosting Airbnb. | Saint-Corentin Cathedral, Quimper Museum of Fine Arts, Les Halles de Quimper, Breton Cultural Centre, The River Odet |
| Brest | A major port city with a rich maritime history and a strong naval presence. Brest attracts business travelers and tourists interested in marine activities, making it appealing for Airbnb hosting. | National Maritime Museum, Brest Castle, Océanopolis Aquarium, Cours Dajot, The Botanical Garden of Brest |
| Concarneau | Known for its beautiful walled town and scenic beaches, Concarneau is a popular tourist destination perfect for seaside visitors looking for charm and relaxation. | Ville Close, Concarneau's beaches, Fishing port, Marinarium, The Art Museum |
| Douarnenez | A picturesque fishing town with stunning views and a rich maritime history. It's popular among tourists and can be a great place for hosting unique stays. | Douarnenez Harbour, Port Museum, Plage des Sables Blancs, The Crozon Peninsula, The Locronan Village |
| Pont-Aven | Famous for its art scene and as the home of the Pont-Aven School, this small town attracts artists and tourists looking for tranquility and artistic inspiration. | Pont-Aven Museum, Aven River, The Old Mill, Cremet de Bretagnes, Local art galleries |
| Saint-Malo | Known for its fortified walls and stunning beaches, Saint-Malo is a hot tourist destination that offers a blend of historical significance and beach leisure. | Saint-Malo Citadel, The Great Beach, Jacques Cartier Museum, Tomb of Chateaubriand, Saint-Malo's Aquarium |
| Rennes | The capital of Brittany, Rennes offers a mix of modern urban life and historical architecture, making it an attractive destination for both leisure and business travelers. | Parlement de Bretagne, Thabor Park, Musée des Beaux-Arts, Rennes Cathedral, Les Champs Libres |
| Locronan | A beautiful medieval village, Locronan is famous for its stone houses and artistic charm. A great spot for tourists looking for authenticity and picturesque landscapes. | Locronan Church, Quimperle River, Craft shops, Local festivals, Scenic walking paths |
Understanding Airbnb License Requirements & STR Laws in Caden (2025)
While Caden, Brittany, France currently shows low STR regulations, specific Airbnb license requirements might still exist or change. Always verify the latest short term rental regulations and Airbnb license requirements directly with local government authorities for Caden to ensure full compliance before hosting.
(Source: AirROI data, 2025, based on 5% licensed listings)
Top Performing Airbnb Properties in Caden (2025)
Benchmark your potential! Explore examples of top-performing Airbnb properties in Cadenbased on Trailing Twelve Month (TTM) revenue. Analyze their characteristics, revenue, occupancy rate, and ADR to understand what drives success in this market.

Domaine du Kelenn, Charming Longère with swimming pool
Entire Place • 6 bedrooms
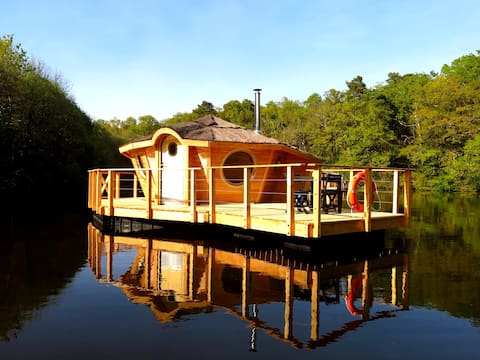
The unusual in a floating cabin, Moulin de Trévelo
Private Room • 1 bedroom

Charming longhouse at the Moulin de Trévelo, Morbihan
Entire Place • 3 bedrooms

Gîte du moulin de Trévelo, spa, Morbihan
Entire Place • 2 bedrooms
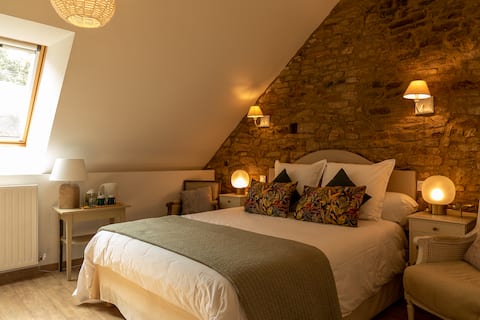
Family suite in bed and breakfast with pool
Private Room • 2 bedrooms

Bohemian stay at Trévelo Mill
Private Room • N/A
Note: Performance varies based on location, size, amenities, seasonality, and management quality. Data reflects the past 12 months.
Top Performing Airbnb Hosts in Caden (2025)
Learn from the best! This table showcases top-performing Airbnb hosts in Caden based on the number of properties managed and estimated total revenue over the past year. Analyze their scale and performance metrics.
| Host Name | Properties | Grossing Revenue | Stay Reviews | Avg Rating |
|---|---|---|---|---|
| Fanny | 5 | $187,634 | 381 | 4.93/5.0 |
| Mylene | 3 | $154,055 | 14 | 3.33/5.0 |
| Maryvonne | 1 | $20,558 | 28 | 4.89/5.0 |
| Veronique | 2 | $17,849 | 57 | 4.80/5.0 |
| Sylvie | 1 | $17,536 | 68 | 4.88/5.0 |
| Laurane | 1 | $13,936 | 35 | 4.63/5.0 |
| France | 1 | $11,901 | 17 | 4.88/5.0 |
| Annie | 1 | $6,296 | 16 | 4.69/5.0 |
| Alexandre | 1 | $5,831 | 20 | 4.80/5.0 |
| Nathalie | 1 | $5,462 | 16 | 4.94/5.0 |
Analyzing the strategies of top hosts, such as their property selection, pricing, and guest communication, can offer valuable lessons for optimizing your own Airbnb operations in Caden.
Dive Deeper: Advanced Caden STR Market Data (2025)
Ready to unlock more insights? AirROI provides access to advanced metrics and comprehensive Airbnb data for Caden. Explore detailed analytics beyond this report to refine your investment strategy, optimize pricing, and maximize your vacation rental profits.
Explore Advanced MetricsCaden Short-Term Rental Market Composition (2025): Property & Room Types
Room Type Distribution
Property Type Distribution
Market Composition Insights for Caden
- The Caden Airbnb market composition is heavily skewed towards Entire Home/Apt listings, which make up 77.3% of the 22 active rentals. This indicates strong guest preference for privacy and space.
- Looking at the property type distribution in Caden, House properties are the most common (59.1%), reflecting the local real estate landscape.
- Houses represent a significant 59.1% portion, catering likely to families or larger groups.
- The presence of 27.3% Hotel/Boutique listings indicates integration with traditional hospitality.
- Smaller segments like apartment/condo, outdoor/unique, others (combined 13.5%) offer potential for unique stay experiences.
Caden Airbnb Room Capacity Analysis (2025): Bedroom Distribution
Distribution of Listings by Number of Bedrooms
Room Capacity Insights for Caden
- The dominant room capacity in Caden is 1 bedroom listings, making up 40.9% of the market. This suggests a strong demand for properties suitable for couples or solo travelers.
- Together, 1 bedroom and 2 bedrooms properties represent 63.6% of the active Airbnb listings in Caden, indicating a high concentration in these sizes.
- A significant 27.2% of listings offer 3+ bedrooms, catering to larger groups and families seeking more space in Caden.
Caden Vacation Rental Guest Capacity Trends (2025)
Distribution of Listings by Guest Capacity
Guest Capacity Insights for Caden
- The most common guest capacity trend in Caden vacation rentals is listings accommodating 2 guests (36.4%). This suggests the primary traveler segment is likely couples or solo travelers.
- Properties designed for 2 guests and 6 guests dominate the Caden STR market, accounting for 50.0% of listings.
- 27.2% of properties accommodate 6+ guests, serving the market segment for larger families or group travel in Caden.
- On average, properties in Caden are equipped to host 3.9 guests.
Caden Airbnb Booking Patterns (2025): Available vs. Booked Days
Available Days Distribution
Booked Days Distribution
Booking Pattern Insights for Caden
- The most common availability pattern in Caden falls within the 271-366 days range, representing 40.9% of listings. This suggests many properties have significant open periods on their calendars.
- Approximately 77.3% of listings show high availability (181+ days open annually), indicating potential for increased bookings or specific owner usage patterns.
- For booked days, the 31-90 days range is most frequent in Caden (40.9%), reflecting common guest stay durations or potential owner blocking patterns.
- A notable 22.7% of properties secure long booking periods (181+ days booked per year), highlighting successful long-term rental strategies or significant owner usage.
Caden Airbnb Minimum Stay Requirements Analysis
Distribution of Listings by Minimum Night Requirement
1 Night
7 listings
35% of total
2 Nights
5 listings
25% of total
3 Nights
2 listings
10% of total
4-6 Nights
4 listings
20% of total
7-29 Nights
1 listings
5% of total
30+ Nights
1 listings
5% of total
Key Insights
- The most prevalent minimum stay requirement in Caden is 1 Night, adopted by 35% of listings. This highlights the market's preference for shorter, flexible bookings.
Recommendations
- Align with the market by considering a 1 Night minimum stay, as 35% of Caden hosts use this setting.
- Adjust minimum nights based on seasonality – potentially shorter during low season and longer during peak demand periods in Caden.
Caden Airbnb Cancellation Policy Trends Analysis (2025)
Flexible
5 listings
25% of total
Moderate
4 listings
20% of total
Firm
6 listings
30% of total
Strict
5 listings
25% of total
Cancellation Policy Insights for Caden
- The prevailing Airbnb cancellation policy trend in Caden is Firm, used by 30% of listings.
- A majority (55.0%) of hosts in Caden utilize Firm or Strict policies, indicating a market where hosts prioritize booking security.
Recommendations for Hosts
- Consider adopting a Firm policy to align with the 30% market standard in Caden.
- Regularly review your cancellation policy against competitors and market demand shifts in Caden.
Caden STR Booking Lead Time Analysis (2025)
Average Booking Lead Time by Month
Booking Lead Time Insights for Caden
- The overall average booking lead time for vacation rentals in Caden is 67 days.
- Guests book furthest in advance for stays during July (average 112 days), likely coinciding with peak travel demand or local events.
- The shortest booking windows occur for stays in February (average 33 days), indicating more last-minute travel plans during this time.
- Seasonally, Summer (109 days avg.) sees the longest lead times, while Winter (39 days avg.) has the shortest, reflecting typical travel planning cycles.
Recommendations for Hosts
- Use the overall average lead time (67 days) as a baseline for your pricing and availability strategy in Caden.
- For July stays, consider implementing length-of-stay discounts or slightly higher rates for bookings made less than 112 days out to capitalize on advance planning.
- Target marketing efforts for the Summer season well in advance (at least 109 days) to capture early planners.
- Monitor your own booking lead times against these Caden averages to identify opportunities for dynamic pricing adjustments.
Popular & Essential Airbnb Amenities in Caden (2025)
Amenity Prevalence
Amenity Insights for Caden
- Essential amenities in Caden that guests expect include: Free parking on premises, Hot water. Lacking these (any) could significantly impact bookings.
- Popular amenities like Heating, Essentials, Smoke alarm are common but not universal. Offering these can provide a competitive edge.
- Warning: Wifi is not universally provided but is considered essential globally. Ensure reliable Wifi is offered.
Recommendations for Hosts
- Ensure your listing includes all essential amenities for Caden: Free parking on premises, Hot water.
- Prioritize adding missing essentials: Free parking on premises, Hot water.
- Consider adding popular differentiators like Heating or Essentials to increase appeal.
- Highlight unique or less common amenities you offer (e.g., hot tub, dedicated workspace, EV charger) in your listing description and photos.
- Regularly check competitor amenities in Caden to stay competitive.
Caden Airbnb Guest Demographics & Profile Analysis (2025)
Guest Profile Summary for Caden
- The typical guest profile for Airbnb in Caden consists of primarily domestic travelers (86%), often arriving from nearby Nantes, typically belonging to the Post-2000s (Gen Z/Alpha) group (50%), primarily speaking French or English.
- Domestic travelers account for 86.2% of guests.
- Key international markets include France (86.2%) and Netherlands (2.4%).
- Top languages spoken are French (44.6%) followed by English (37.2%).
- A significant demographic segment is the Post-2000s (Gen Z/Alpha) group, representing 50% of guests.
Recommendations for Hosts
- Target domestic marketing efforts towards travelers from Nantes and Paris.
- Tailor amenities and listing descriptions to appeal to the dominant Post-2000s (Gen Z/Alpha) demographic (e.g., highlight fast WiFi, smart home features, local guides).
- Highlight unique local experiences or amenities relevant to the primary guest profile.
- Consider seasonal promotions aligned with peak travel times for key origin markets.
Nearby Short-Term Rental Market Comparison
How does the Caden Airbnb market stack up against its neighbors? Compare key performance metrics like average monthly revenue, ADR, and occupancy rates in surrounding areas to understand the broader regional STR landscape.
| Market | Active Properties | Monthly Revenue | Daily Rate | Avg. Occupancy |
|---|---|---|---|---|
| Le Bois-Plage-en-Ré | 303 | $2,528 | $284.63 | 45% |
| Sainte-Florence | 10 | $2,445 | $233.78 | 46% |
| La Flotte | 396 | $2,382 | $236.53 | 46% |
| Île-de-Bréhat | 46 | $2,254 | $221.52 | 45% |
| La Couarde-sur-Mer | 218 | $2,188 | $259.23 | 41% |
| Le Parc | 13 | $2,138 | $173.31 | 43% |
| Ombrée d'Anjou | 21 | $2,063 | $213.63 | 35% |
| Lanmodez | 19 | $2,050 | $219.93 | 42% |
| Île-aux-Moines | 98 | $2,048 | $236.18 | 42% |
| Laillé | 12 | $2,046 | $116.65 | 37% |