Bruz Airbnb Market Analysis 2025: Short Term Rental Data & Vacation Rental Statistics in Brittany, France
Is Airbnb profitable in Bruz in 2025? Explore comprehensive Airbnb analytics for Bruz, Brittany, France to uncover income potential. This 2025 STR market report for Bruz, based on AirROI data from April 2024 to March 2025, reveals key trends in the niche market of 94 active listings.
Whether you're considering an Airbnb investment in Bruz, optimizing your existing vacation rental, or exploring rental arbitrage opportunities, understanding the Bruz Airbnb data is crucial. Leveraging the low regulation environment is key to maximizing your short term rental income potential. Let's dive into the specifics.
Key Bruz Airbnb Performance Metrics Overview
Monthly Airbnb Revenue Variations & Income Potential in Bruz (2025)
Understanding the monthly revenue variations for Airbnb listings in Bruz is key to maximizing your short term rental income potential. Seasonality significantly impacts earnings. Our analysis, based on data from the past 12 months, shows that the peak revenue month for STRs in Bruz is typically May, while January often presents the lowest earnings, highlighting opportunities for strategic pricing adjustments during shoulder and low seasons. Explore the typical Airbnb income in Bruz across different performance tiers:
- Best-in-class properties (Top 10%) achieve $3,044+ monthly, often utilizing dynamic pricing and superior guest experiences.
- Strong performing properties (Top 25%) earn $2,064 or more, indicating effective management and desirable locations/amenities.
- Typical properties (Median) generate around $1,091 per month, representing the average market performance.
- Entry-level properties (Bottom 25%) see earnings around $589, often with potential for optimization.
Average Monthly Airbnb Earnings Trend in Bruz
Bruz Airbnb Occupancy Rate Trends (2025)
Maximize your bookings by understanding the Bruz STR occupancy trends. Seasonal demand shifts significantly influence how often properties are booked. Typically, Augustsees the highest demand (peak season occupancy), while January experiences the lowest (low season). Effective strategies, like adjusting minimum stays or offering promotions, can boost occupancy during slower periods. Here's how different property tiers perform in Bruz:
- Best-in-class properties (Top 10%) achieve 84%+ occupancy, indicating high desirability and potentially optimized availability.
- Strong performing properties (Top 25%) maintain 71% or higher occupancy, suggesting good market fit and guest satisfaction.
- Typical properties (Median) have an occupancy rate around 51%.
- Entry-level properties (Bottom 25%) average 30% occupancy, potentially facing higher vacancy.
Average Monthly Occupancy Rate Trend in Bruz
Average Daily Rate (ADR) Airbnb Trends in Bruz (2025)
Effective short term rental pricing strategy in Bruz involves understanding monthly ADR fluctuations. The Average Daily Rate (ADR) for Airbnb in Bruz typically peaks in December and dips lowest during February. Leveraging Airbnb dynamic pricing tools or strategies based on this seasonality can significantly boost revenue. Here's a look at the typical nightly rates achieved:
- Best-in-class properties (Top 10%) command rates of $160+ per night, often due to premium features or locations.
- Strong performing properties (Top 25%) achieve nightly rates of $112 or more.
- Typical properties (Median) charge around $58 per night.
- Entry-level properties (Bottom 25%) earn around $42 per night.
Average Daily Rate (ADR) Trend by Month in Bruz
Get Live Bruz Market Intelligence 👇

Explore Real-time Analytics
Airbnb Seasonality Analysis & Trends in Bruz (2025)
Peak Season (May, August, June)
- Revenue averages $1,907 per month
- Occupancy rates average 53.4%
- Daily rates average $88
Shoulder Season
- Revenue averages $1,512 per month
- Occupancy maintains around 50.0%
- Daily rates hold near $90
Low Season (January, February, March)
- Revenue drops to average $1,226 per month
- Occupancy decreases to average 47.6%
- Daily rates adjust to average $87
Seasonality Insights for Bruz
- The Airbnb seasonality in Bruz shows moderate seasonality with distinct peak and low periods. While the sections above show seasonal averages, it's also insightful to look at the extremes:
- During the high season, the absolute peak month showcases Bruz's highest earning potential, with monthly revenues capable of climbing to $1,939, occupancy reaching a high of 61.2%, and ADRs peaking at $94.
- Conversely, the slowest single month of the year, typically falling within the low season, marks the market's lowest point. In this month, revenue might dip to $1,119, occupancy could drop to 43.6%, and ADRs may adjust down to $85.
- Understanding both the seasonal averages and these monthly peaks and troughs in revenue, occupancy, and ADR is crucial for maximizing your Airbnb profit potential in Bruz.
Seasonal Strategies for Maximizing Profit
- Peak Season: Maximize revenue through premium pricing and potentially longer minimum stays. Ensure high availability.
- Low Season: Offer competitive pricing, special promotions (e.g., extended stay discounts), and flexible cancellation policies. Target off-season travelers like remote workers or budget-conscious guests.
- Shoulder Seasons: Implement dynamic pricing that balances peak and low rates. Target weekend travelers or specific events. Offer slightly more flexible terms than peak season.
- Regularly analyze your own performance against these Bruz seasonality benchmarks and adjust your pricing and availability strategy accordingly.
Best Areas for Airbnb Investment in Bruz (2025)
Exploring the top neighborhoods for short-term rentals in Bruz? This section highlights key areas, outlining why they are attractive for hosts and guests, along with notable local attractions. Consider these locations based on your target guest profile and investment strategy.
| Neighborhood / Area | Why Host Here? (Target Guests & Appeal) | Key Attractions & Landmarks |
|---|---|---|
| Centre de Bruz | The heart of Bruz with charming streets and a local atmosphere. It's close to shops and restaurants, making it ideal for visitors wanting to experience authentic French culture. | Bruz Castle, Church of Saint-Étienne, Local markets, Parks and gardens, Café culture |
| Parc des Gayeulles | A beautiful park area that's perfect for outdoor enthusiasts. The proximity to nature and recreational activities attracts families and nature lovers. | Lakes, Walking trails, Picnic areas, Playgrounds, Water sports |
| L'Etang de la Gueule aux Loups | A serene area ideal for those who seek tranquility and nature's beauty. It's great for hosting retreats and relaxing getaways. | Fishing spots, Scenic views, Nature trails, Bird watching, Outdoor activities |
| Zone d'Activités de Bruz | The business hub in Bruz, attracting corporate travelers and professionals who might need accommodation for work-related visits. | Business parks, Corporate offices, Meeting venues, Restaurants catering to business professionals |
| Bruz Railway Station area | Convenient access to public transport makes this area appealing for travelers needing to visit Rennes and other nearby regions. | Train services to Rennes, Cafés, Local shops, Connections to Brittany's travel routes |
| Rives du Meu | Offers a peaceful riverside experience, appealing for those looking for outdoor activities along the river and picturesque landscapes. | Riverfront paths, Cycling routes, Fishing areas, Covered benches and picnic sites |
| Aéroport Rennes Bretagne | Close proximity to the airport makes this area a key location for travelers looking for easy access when arriving or departing from Bruz. | Airport services, Transportation links to Rennes, Cafés, Short-term parking |
| Historical Bruz | Explore Bruz's rich history with its beautiful, historical buildings and cultural sites, perfect for tourists interested in history and architecture. | Ancient buildings, Local museums, Historical tours, Traditional restaurants, Cultural events |
Understanding Airbnb License Requirements & STR Laws in Bruz (2025)
While Bruz, Brittany, France currently shows low STR regulations, specific Airbnb license requirements might still exist or change. Always verify the latest short term rental regulations and Airbnb license requirements directly with local government authorities for Bruz to ensure full compliance before hosting.
(Source: AirROI data, 2025, based on 2% licensed listings)
Top Performing Airbnb Properties in Bruz (2025)
Benchmark your potential! Explore examples of top-performing Airbnb properties in Bruzbased on Trailing Twelve Month (TTM) revenue. Analyze their characteristics, revenue, occupancy rate, and ADR to understand what drives success in this market.
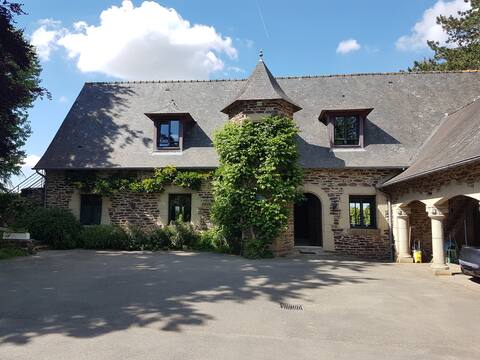
Farm cottage, 3 bedrooms, sauna and jacuzzi
Entire Place • 3 bedrooms
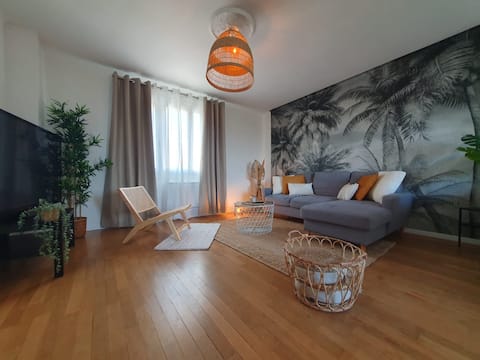
Le Cosy Paradis By Madame Conciergerie
Entire Place • 2 bedrooms

Chez Mamie Aline By Madame Conciergerie
Entire Place • 4 bedrooms
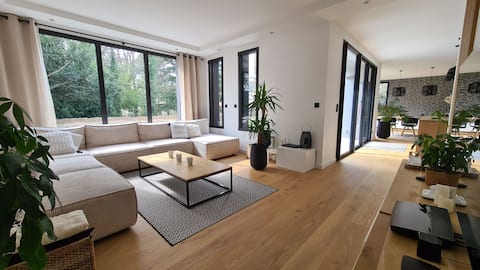
Contemporary and bright house in Brittany
Entire Place • 4 bedrooms

Loft with XXL SPA + year-round heated pool
Entire Place • 1 bedroom
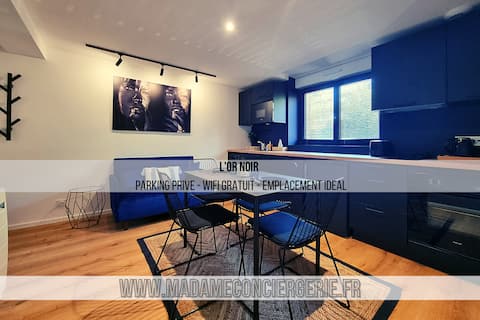
L'Or Noir By Madame Conciergerie
Entire Place • 1 bedroom
Note: Performance varies based on location, size, amenities, seasonality, and management quality. Data reflects the past 12 months.
Top Performing Airbnb Hosts in Bruz (2025)
Learn from the best! This table showcases top-performing Airbnb hosts in Bruz based on the number of properties managed and estimated total revenue over the past year. Analyze their scale and performance metrics.
| Host Name | Properties | Grossing Revenue | Stay Reviews | Avg Rating |
|---|---|---|---|---|
| Alizee | 14 | $459,021 | 622 | 4.88/5.0 |
| Eric | 4 | $124,659 | 188 | 4.97/5.0 |
| Angèle | 6 | $99,612 | 947 | 4.78/5.0 |
| Marie-Laure | 1 | $54,256 | 3 | 5.00/5.0 |
| Didier | 1 | $49,493 | 98 | 4.95/5.0 |
| Fabien | 4 | $44,094 | 166 | 4.91/5.0 |
| Hélène | 2 | $38,980 | 717 | 4.95/5.0 |
| Marie | 2 | $35,298 | 18 | 5.00/5.0 |
| Thamdi | 7 | $32,789 | 175 | 3.44/5.0 |
| Jean-Luc | 1 | $30,886 | 36 | 4.94/5.0 |
Analyzing the strategies of top hosts, such as their property selection, pricing, and guest communication, can offer valuable lessons for optimizing your own Airbnb operations in Bruz.
Dive Deeper: Advanced Bruz STR Market Data (2025)
Ready to unlock more insights? AirROI provides access to advanced metrics and comprehensive Airbnb data for Bruz. Explore detailed analytics beyond this report to refine your investment strategy, optimize pricing, and maximize your vacation rental profits.
Explore Advanced MetricsBruz Short-Term Rental Market Composition (2025): Property & Room Types
Room Type Distribution
Property Type Distribution
Market Composition Insights for Bruz
- The Bruz Airbnb market composition is heavily skewed towards Entire Home/Apt listings, which make up 68.1% of the 94 active rentals. This indicates strong guest preference for privacy and space.
- However, a notable 31.9% share for Private Rooms suggests opportunities for budget-conscious travelers or hosts renting out spare rooms.
- Looking at the property type distribution in Bruz, Apartment/Condo properties are the most common (57.4%), reflecting the local real estate landscape.
- Houses represent a significant 39.4% portion, catering likely to families or larger groups.
- Smaller segments like hotel/boutique (combined 3.2%) offer potential for unique stay experiences.
Bruz Airbnb Room Capacity Analysis (2025): Bedroom Distribution
Distribution of Listings by Number of Bedrooms
Room Capacity Insights for Bruz
- The dominant room capacity in Bruz is 1 bedroom listings, making up 43.6% of the market. This suggests a strong demand for properties suitable for couples or solo travelers.
- Together, 1 bedroom and 2 bedrooms properties represent 50.0% of the active Airbnb listings in Bruz, indicating a high concentration in these sizes.
Bruz Vacation Rental Guest Capacity Trends (2025)
Distribution of Listings by Guest Capacity
Guest Capacity Insights for Bruz
- The most common guest capacity trend in Bruz vacation rentals is listings accommodating 2 guests (45.7%). This suggests the primary traveler segment is likely couples or solo travelers.
- Properties designed for 2 guests and 4 guests dominate the Bruz STR market, accounting for 53.1% of listings.
- A significant 46.8% of listings cater specifically to 1-2 guests, highlighting strong demand from couples and solo travelers in Bruz.
- 10.7% of properties accommodate 6+ guests, serving the market segment for larger families or group travel in Bruz.
- On average, properties in Bruz are equipped to host 2.3 guests.
Bruz Airbnb Booking Patterns (2025): Available vs. Booked Days
Available Days Distribution
Booked Days Distribution
Booking Pattern Insights for Bruz
- The most common availability pattern in Bruz falls within the 91-180 days range, representing 38.3% of listings. This suggests many properties have significant open periods on their calendars.
- Approximately 52.2% of listings show high availability (181+ days open annually), indicating potential for increased bookings or specific owner usage patterns.
- For booked days, the 181-270 days range is most frequent in Bruz (38.3%), reflecting common guest stay durations or potential owner blocking patterns.
- A notable 48.9% of properties secure long booking periods (181+ days booked per year), highlighting successful long-term rental strategies or significant owner usage.
Bruz Airbnb Minimum Stay Requirements Analysis
Distribution of Listings by Minimum Night Requirement
1 Night
37 listings
41.1% of total
2 Nights
35 listings
38.9% of total
3 Nights
7 listings
7.8% of total
4-6 Nights
6 listings
6.7% of total
7-29 Nights
1 listings
1.1% of total
30+ Nights
4 listings
4.4% of total
Key Insights
- The most prevalent minimum stay requirement in Bruz is 1 Night, adopted by 41.1% of listings. This highlights the market's preference for shorter, flexible bookings.
- A strong majority (80.0%) of the Bruz Airbnb data shows acceptance of very short stays (1-2 nights), indicating a dynamic, high-turnover market.
Recommendations
- Align with the market by considering a 1 Night minimum stay, as 41.1% of Bruz hosts use this setting.
- Adjust minimum nights based on seasonality – potentially shorter during low season and longer during peak demand periods in Bruz.
Bruz Airbnb Cancellation Policy Trends Analysis (2025)
Flexible
43 listings
50% of total
Moderate
21 listings
24.4% of total
Firm
6 listings
7% of total
Strict
16 listings
18.6% of total
Cancellation Policy Insights for Bruz
- The prevailing Airbnb cancellation policy trend in Bruz is Flexible, used by 50% of listings.
- The market strongly favors guest-friendly terms, with 74.4% of listings offering Flexible or Moderate policies. This suggests guests in Bruz may expect booking flexibility.
Recommendations for Hosts
- Consider adopting a Flexible policy to align with the 50% market standard in Bruz.
- Regularly review your cancellation policy against competitors and market demand shifts in Bruz.
Bruz STR Booking Lead Time Analysis (2025)
Average Booking Lead Time by Month
Booking Lead Time Insights for Bruz
- The overall average booking lead time for vacation rentals in Bruz is 51 days.
- Guests book furthest in advance for stays during June (average 91 days), likely coinciding with peak travel demand or local events.
- The shortest booking windows occur for stays in October (average 40 days), indicating more last-minute travel plans during this time.
- Seasonally, Summer (74 days avg.) sees the longest lead times, while Winter (49 days avg.) has the shortest, reflecting typical travel planning cycles.
Recommendations for Hosts
- Use the overall average lead time (51 days) as a baseline for your pricing and availability strategy in Bruz.
- For June stays, consider implementing length-of-stay discounts or slightly higher rates for bookings made less than 91 days out to capitalize on advance planning.
- Target marketing efforts for the Summer season well in advance (at least 74 days) to capture early planners.
- Monitor your own booking lead times against these Bruz averages to identify opportunities for dynamic pricing adjustments.
Popular & Essential Airbnb Amenities in Bruz (2025)
Amenity Prevalence
Amenity Insights for Bruz
- Popular amenities like Wifi, Kitchen, Heating are common but not universal. Offering these can provide a competitive edge.
- Warning: Wifi is not universally provided but is considered essential globally. Ensure reliable Wifi is offered.
Recommendations for Hosts
- Consider adding popular differentiators like Wifi or Kitchen to increase appeal.
- Highlight unique or less common amenities you offer (e.g., hot tub, dedicated workspace, EV charger) in your listing description and photos.
- Regularly check competitor amenities in Bruz to stay competitive.
Bruz Airbnb Guest Demographics & Profile Analysis (2025)
Guest Profile Summary for Bruz
- The typical guest profile for Airbnb in Bruz consists of primarily domestic travelers (94%), often arriving from nearby Nantes, typically belonging to the Post-2000s (Gen Z/Alpha) group (50%), primarily speaking French or English.
- Domestic travelers account for 93.7% of guests.
- Key international markets include France (93.7%) and United Kingdom (1.7%).
- Top languages spoken are French (50.9%) followed by English (30.8%).
- A significant demographic segment is the Post-2000s (Gen Z/Alpha) group, representing 50% of guests.
Recommendations for Hosts
- Target domestic marketing efforts towards travelers from Nantes and Rennes.
- Tailor amenities and listing descriptions to appeal to the dominant Post-2000s (Gen Z/Alpha) demographic (e.g., highlight fast WiFi, smart home features, local guides).
- Highlight unique local experiences or amenities relevant to the primary guest profile.
- Consider seasonal promotions aligned with peak travel times for key origin markets.
Nearby Short-Term Rental Market Comparison
How does the Bruz Airbnb market stack up against its neighbors? Compare key performance metrics like average monthly revenue, ADR, and occupancy rates in surrounding areas to understand the broader regional STR landscape.
| Market | Active Properties | Monthly Revenue | Daily Rate | Avg. Occupancy |
|---|---|---|---|---|
| St Martin | 14 | $4,074 | $436.70 | 51% |
| Moulins-le-Carbonnel | 11 | $3,213 | $320.85 | 35% |
| Gonneville-en-Auge | 12 | $3,061 | $235.90 | 40% |
| Vallon-sur-Gée | 11 | $2,913 | $379.01 | 30% |
| Saint Lawrence | 11 | $2,911 | $317.86 | 52% |
| Auberville | 22 | $2,777 | $249.63 | 36% |
| St Ouen | 15 | $2,635 | $339.51 | 51% |
| Chambellay | 11 | $2,525 | $255.24 | 34% |
| St Clement | 14 | $2,522 | $219.76 | 51% |
| Grouville | 21 | $2,510 | $218.40 | 52% |