Bon Repos sur Blavet Airbnb Market Analysis 2025: Short Term Rental Data & Vacation Rental Statistics in Brittany, France
Is Airbnb profitable in Bon Repos sur Blavet in 2025? Explore comprehensive Airbnb analytics for Bon Repos sur Blavet, Brittany, France to uncover income potential. This 2025 STR market report for Bon Repos sur Blavet, based on AirROI data from April 2024 to March 2025, reveals key trends in the niche market of 40 active listings.
Whether you're considering an Airbnb investment in Bon Repos sur Blavet, optimizing your existing vacation rental, or exploring rental arbitrage opportunities, understanding the Bon Repos sur Blavet Airbnb data is crucial. Leveraging the low regulation environment is key to maximizing your short term rental income potential. Let's dive into the specifics.
Key Bon Repos sur Blavet Airbnb Performance Metrics Overview
Monthly Airbnb Revenue Variations & Income Potential in Bon Repos sur Blavet (2025)
Understanding the monthly revenue variations for Airbnb listings in Bon Repos sur Blavet is key to maximizing your short term rental income potential. Seasonality significantly impacts earnings. Our analysis, based on data from the past 12 months, shows that the peak revenue month for STRs in Bon Repos sur Blavet is typically August, while March often presents the lowest earnings, highlighting opportunities for strategic pricing adjustments during shoulder and low seasons. Explore the typical Airbnb income in Bon Repos sur Blavet across different performance tiers:
- Best-in-class properties (Top 10%) achieve $1,858+ monthly, often utilizing dynamic pricing and superior guest experiences.
- Strong performing properties (Top 25%) earn $1,250 or more, indicating effective management and desirable locations/amenities.
- Typical properties (Median) generate around $802 per month, representing the average market performance.
- Entry-level properties (Bottom 25%) see earnings around $489, often with potential for optimization.
Average Monthly Airbnb Earnings Trend in Bon Repos sur Blavet
Bon Repos sur Blavet Airbnb Occupancy Rate Trends (2025)
Maximize your bookings by understanding the Bon Repos sur Blavet STR occupancy trends. Seasonal demand shifts significantly influence how often properties are booked. Typically, Augustsees the highest demand (peak season occupancy), while November experiences the lowest (low season). Effective strategies, like adjusting minimum stays or offering promotions, can boost occupancy during slower periods. Here's how different property tiers perform in Bon Repos sur Blavet:
- Best-in-class properties (Top 10%) achieve 64%+ occupancy, indicating high desirability and potentially optimized availability.
- Strong performing properties (Top 25%) maintain 45% or higher occupancy, suggesting good market fit and guest satisfaction.
- Typical properties (Median) have an occupancy rate around 28%.
- Entry-level properties (Bottom 25%) average 16% occupancy, potentially facing higher vacancy.
Average Monthly Occupancy Rate Trend in Bon Repos sur Blavet
Average Daily Rate (ADR) Airbnb Trends in Bon Repos sur Blavet (2025)
Effective short term rental pricing strategy in Bon Repos sur Blavet involves understanding monthly ADR fluctuations. The Average Daily Rate (ADR) for Airbnb in Bon Repos sur Blavet typically peaks in October and dips lowest during March. Leveraging Airbnb dynamic pricing tools or strategies based on this seasonality can significantly boost revenue. Here's a look at the typical nightly rates achieved:
- Best-in-class properties (Top 10%) command rates of $195+ per night, often due to premium features or locations.
- Strong performing properties (Top 25%) achieve nightly rates of $155 or more.
- Typical properties (Median) charge around $94 per night.
- Entry-level properties (Bottom 25%) earn around $65 per night.
Average Daily Rate (ADR) Trend by Month in Bon Repos sur Blavet
Get Live Bon Repos sur Blavet Market Intelligence 👇

Explore Real-time Analytics
Airbnb Seasonality Analysis & Trends in Bon Repos sur Blavet (2025)
Peak Season (August, July, May)
- Revenue averages $1,559 per month
- Occupancy rates average 44.6%
- Daily rates average $133
Shoulder Season
- Revenue averages $943 per month
- Occupancy maintains around 30.1%
- Daily rates hold near $126
Low Season (February, March, November)
- Revenue drops to average $595 per month
- Occupancy decreases to average 24.0%
- Daily rates adjust to average $116
Seasonality Insights for Bon Repos sur Blavet
- The Airbnb seasonality in Bon Repos sur Blavet shows highly seasonal trends requiring careful strategy. While the sections above show seasonal averages, it's also insightful to look at the extremes:
- During the high season, the absolute peak month showcases Bon Repos sur Blavet's highest earning potential, with monthly revenues capable of climbing to $1,908, occupancy reaching a high of 55.0%, and ADRs peaking at $134.
- Conversely, the slowest single month of the year, typically falling within the low season, marks the market's lowest point. In this month, revenue might dip to $526, occupancy could drop to 21.2%, and ADRs may adjust down to $114.
- Understanding both the seasonal averages and these monthly peaks and troughs in revenue, occupancy, and ADR is crucial for maximizing your Airbnb profit potential in Bon Repos sur Blavet.
Seasonal Strategies for Maximizing Profit
- Peak Season: Maximize revenue through premium pricing and potentially longer minimum stays. Ensure high availability.
- Low Season: Offer competitive pricing, special promotions (e.g., extended stay discounts), and flexible cancellation policies. Target off-season travelers like remote workers or budget-conscious guests.
- Shoulder Seasons: Implement dynamic pricing that balances peak and low rates. Target weekend travelers or specific events. Offer slightly more flexible terms than peak season.
- Regularly analyze your own performance against these Bon Repos sur Blavet seasonality benchmarks and adjust your pricing and availability strategy accordingly.
Best Areas for Airbnb Investment in Bon Repos sur Blavet (2025)
Exploring the top neighborhoods for short-term rentals in Bon Repos sur Blavet? This section highlights key areas, outlining why they are attractive for hosts and guests, along with notable local attractions. Consider these locations based on your target guest profile and investment strategy.
| Neighborhood / Area | Why Host Here? (Target Guests & Appeal) | Key Attractions & Landmarks |
|---|---|---|
| Village Center | The heart of Bon Repos sur Blavet, with its charming streets and local shops. A great spot for visitors to enjoy a taste of local culture and easy access to amenities. | Local shops, Café de la Place, Église de Bon Repos, Ballon de l'Essor, Local markets |
| Blavet River | A scenic area along the Blavet River, perfect for nature lovers and outdoor activities. Popular for hiking, canoeing, and relaxation by the water. | Blavet River trails, Canoeing activities, Picnic spots, Fishing locations, Beautiful viewpoints |
| Historic Sites | Home to several historical points of interest, attracting tourists who appreciate heritage and history. Ideal for guests interested in cultural exploration. | Château de Bon Repos, Abbaye de Bon Repos, Historic walking tours, Local museums, Cultural festivals |
| Nature Reserves | Surrounding natural parks and reserves, ideal for eco-tourists and families looking for a peaceful getaway amidst nature. | La Forêt de Quénécan, Biodiversity trails, Birdwatching spots, Nature photography, Camping facilities |
| Art and Culture District | A hub for local artists and cultural events, appealing to those interested in the arts and community activities. | Art exhibitions, Local craft fairs, Workshops, Concerts in the park, Theater performances |
| Cycling Routes | Well-known for its cycling paths and routes, attracting sports enthusiasts and those enjoying active vacations. | Cycling trails, Bike rental shops, Cycle tours, Scenic overlooks, Cycle-friendly cafés |
| Food and Cuisine | Renowned for its local cuisine and gastronomy, a fantastic draw for foodies and culinary tourists. | Local restaurants, Food festivals, Farmers markets, Culinary workshops, Wine tastings |
| Family Activities | Family-friendly area with a variety of activities suitable for children and parents alike, ensuring a fun stay for families. | Amusement parks, Children's museums, Family-friendly events, Outdoor activities, Playgrounds |
Understanding Airbnb License Requirements & STR Laws in Bon Repos sur Blavet (2025)
While Bon Repos sur Blavet, Brittany, France currently shows low STR regulations, specific Airbnb license requirements might still exist or change. Always verify the latest short term rental regulations and Airbnb license requirements directly with local government authorities for Bon Repos sur Blavet to ensure full compliance before hosting.
(Source: AirROI data, 2025, based on 3% licensed listings)
Top Performing Airbnb Properties in Bon Repos sur Blavet (2025)
Benchmark your potential! Explore examples of top-performing Airbnb properties in Bon Repos sur Blavetbased on Trailing Twelve Month (TTM) revenue. Analyze their characteristics, revenue, occupancy rate, and ADR to understand what drives success in this market.
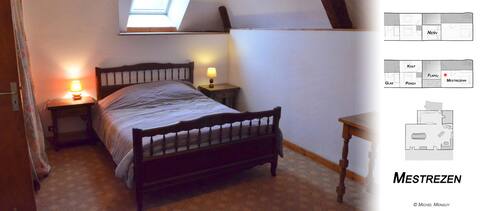
Manoir du Liscuis: Birthdays Family Weddings
Entire Place • 12 bedrooms
Avel Blade
Entire Place • 3 bedrooms

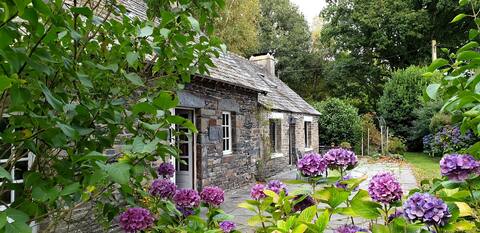
CLOSET CABIN - IN THE TREES
Entire Place • 1 bedroom
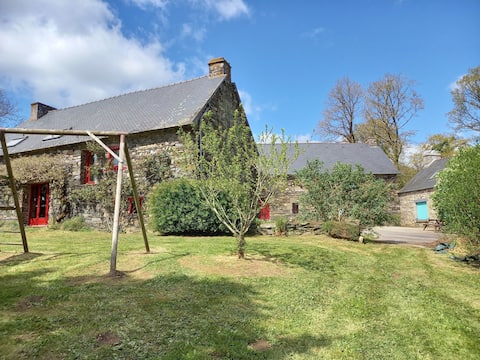
Homes/gite in the countryside
Entire Place • 5 bedrooms
Gite du presbytère
Entire Place • 3 bedrooms

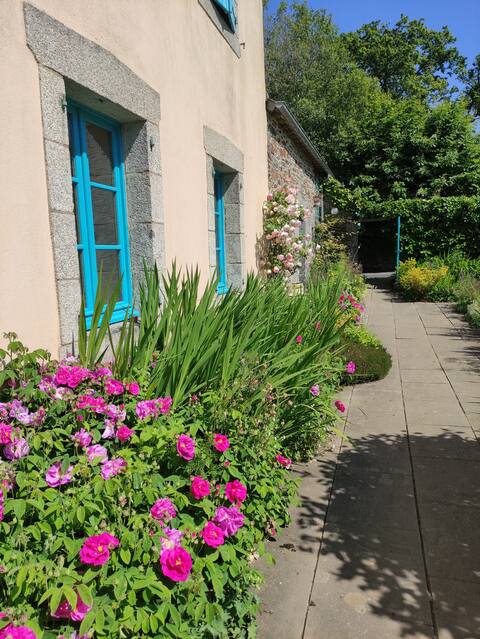
Rustic holiday home in central Brittany
Entire Place • 3 bedrooms
Note: Performance varies based on location, size, amenities, seasonality, and management quality. Data reflects the past 12 months.
Top Performing Airbnb Hosts in Bon Repos sur Blavet (2025)
Learn from the best! This table showcases top-performing Airbnb hosts in Bon Repos sur Blavet based on the number of properties managed and estimated total revenue over the past year. Analyze their scale and performance metrics.
| Host Name | Properties | Grossing Revenue | Stay Reviews | Avg Rating |
|---|---|---|---|---|
| Thierry | 12 | $125,010 | 241 | 4.10/5.0 |
| Hébergements Insolites | 6 | $65,506 | 204 | 4.63/5.0 |
| Marie-Thérèse | 2 | $30,716 | 74 | 4.86/5.0 |
| Anne-Marie | 1 | $19,551 | 154 | 4.88/5.0 |
| Nicole | 1 | $17,044 | 6 | 4.83/5.0 |
| Brigitte | 2 | $16,936 | 59 | 4.88/5.0 |
| Weena | 1 | $16,023 | 5 | 4.80/5.0 |
| Bruno Et Martine | 1 | $12,103 | 25 | 4.84/5.0 |
| Richard | 1 | $10,741 | 233 | 4.70/5.0 |
| Elodie | 1 | $10,607 | 10 | 4.70/5.0 |
Analyzing the strategies of top hosts, such as their property selection, pricing, and guest communication, can offer valuable lessons for optimizing your own Airbnb operations in Bon Repos sur Blavet.
Dive Deeper: Advanced Bon Repos sur Blavet STR Market Data (2025)
Ready to unlock more insights? AirROI provides access to advanced metrics and comprehensive Airbnb data for Bon Repos sur Blavet. Explore detailed analytics beyond this report to refine your investment strategy, optimize pricing, and maximize your vacation rental profits.
Explore Advanced MetricsBon Repos sur Blavet Short-Term Rental Market Composition (2025): Property & Room Types
Room Type Distribution
Property Type Distribution
Market Composition Insights for Bon Repos sur Blavet
- The Bon Repos sur Blavet Airbnb market composition is heavily skewed towards Entire Home/Apt listings, which make up 77.5% of the 40 active rentals. This indicates strong guest preference for privacy and space.
- Looking at the property type distribution in Bon Repos sur Blavet, House properties are the most common (47.5%), reflecting the local real estate landscape.
- Houses represent a significant 47.5% portion, catering likely to families or larger groups.
- The presence of 22.5% Hotel/Boutique listings indicates integration with traditional hospitality.
- Smaller segments like unique stays (combined 2.5%) offer potential for unique stay experiences.
Bon Repos sur Blavet Airbnb Room Capacity Analysis (2025): Bedroom Distribution
Distribution of Listings by Number of Bedrooms
Room Capacity Insights for Bon Repos sur Blavet
- The dominant room capacity in Bon Repos sur Blavet is 1 bedroom listings, making up 30% of the market. This suggests a strong demand for properties suitable for couples or solo travelers.
- Together, 1 bedroom and 3 bedrooms properties represent 50.0% of the active Airbnb listings in Bon Repos sur Blavet, indicating a high concentration in these sizes.
- A significant 32.5% of listings offer 3+ bedrooms, catering to larger groups and families seeking more space in Bon Repos sur Blavet.
Bon Repos sur Blavet Vacation Rental Guest Capacity Trends (2025)
Distribution of Listings by Guest Capacity
Guest Capacity Insights for Bon Repos sur Blavet
- The most common guest capacity trend in Bon Repos sur Blavet vacation rentals is listings accommodating 6 guests (20%). This suggests the primary traveler segment is likely larger groups.
- Properties designed for 6 guests and 2 guests dominate the Bon Repos sur Blavet STR market, accounting for 37.5% of listings.
- 37.5% of properties accommodate 6+ guests, serving the market segment for larger families or group travel in Bon Repos sur Blavet.
- On average, properties in Bon Repos sur Blavet are equipped to host 3.9 guests.
Bon Repos sur Blavet Airbnb Booking Patterns (2025): Available vs. Booked Days
Available Days Distribution
Booked Days Distribution
Booking Pattern Insights for Bon Repos sur Blavet
- The most common availability pattern in Bon Repos sur Blavet falls within the 271-366 days range, representing 50% of listings. This suggests many properties have significant open periods on their calendars.
- Approximately 87.5% of listings show high availability (181+ days open annually), indicating potential for increased bookings or specific owner usage patterns.
- For booked days, the 31-90 days range is most frequent in Bon Repos sur Blavet (40%), reflecting common guest stay durations or potential owner blocking patterns.
- A notable 12.5% of properties secure long booking periods (181+ days booked per year), highlighting successful long-term rental strategies or significant owner usage.
Bon Repos sur Blavet Airbnb Minimum Stay Requirements Analysis
Distribution of Listings by Minimum Night Requirement
1 Night
22 listings
61.1% of total
2 Nights
5 listings
13.9% of total
3 Nights
6 listings
16.7% of total
4-6 Nights
3 listings
8.3% of total
Key Insights
- The most prevalent minimum stay requirement in Bon Repos sur Blavet is 1 Night, adopted by 61.1% of listings. This highlights the market's preference for shorter, flexible bookings.
- A strong majority (75.0%) of the Bon Repos sur Blavet Airbnb data shows acceptance of very short stays (1-2 nights), indicating a dynamic, high-turnover market.
Recommendations
- Align with the market by considering a 1 Night minimum stay, as 61.1% of Bon Repos sur Blavet hosts use this setting.
- Adjust minimum nights based on seasonality – potentially shorter during low season and longer during peak demand periods in Bon Repos sur Blavet.
Bon Repos sur Blavet Airbnb Cancellation Policy Trends Analysis (2025)
Super Strict 60 Days
1 listings
2.8% of total
Flexible
15 listings
41.7% of total
Moderate
2 listings
5.6% of total
Firm
7 listings
19.4% of total
Strict
11 listings
30.6% of total
Cancellation Policy Insights for Bon Repos sur Blavet
- The prevailing Airbnb cancellation policy trend in Bon Repos sur Blavet is Flexible, used by 41.7% of listings.
- There's a relatively balanced mix between guest-friendly (47.3%) and stricter (50.0%) policies, offering choices for different guest needs.
Recommendations for Hosts
- Consider adopting a Flexible policy to align with the 41.7% market standard in Bon Repos sur Blavet.
- With 30.6% using Strict terms, this is a viable option in Bon Repos sur Blavet, particularly for high-value properties or during peak demand periods.
- Regularly review your cancellation policy against competitors and market demand shifts in Bon Repos sur Blavet.
Bon Repos sur Blavet STR Booking Lead Time Analysis (2025)
Average Booking Lead Time by Month
Booking Lead Time Insights for Bon Repos sur Blavet
- The overall average booking lead time for vacation rentals in Bon Repos sur Blavet is 72 days.
- Guests book furthest in advance for stays during July (average 92 days), likely coinciding with peak travel demand or local events.
- The shortest booking windows occur for stays in February (average 34 days), indicating more last-minute travel plans during this time.
- Seasonally, Summer (89 days avg.) sees the longest lead times, while Winter (53 days avg.) has the shortest, reflecting typical travel planning cycles.
Recommendations for Hosts
- Use the overall average lead time (72 days) as a baseline for your pricing and availability strategy in Bon Repos sur Blavet.
- For July stays, consider implementing length-of-stay discounts or slightly higher rates for bookings made less than 92 days out to capitalize on advance planning.
- Target marketing efforts for the Summer season well in advance (at least 89 days) to capture early planners.
- Monitor your own booking lead times against these Bon Repos sur Blavet averages to identify opportunities for dynamic pricing adjustments.
Popular & Essential Airbnb Amenities in Bon Repos sur Blavet (2025)
Amenity Prevalence
Amenity Insights for Bon Repos sur Blavet
- Essential amenities in Bon Repos sur Blavet that guests expect include: Smoke alarm, Free parking on premises. Lacking these (any) could significantly impact bookings.
- Popular amenities like Heating, Kitchen, Wifi are common but not universal. Offering these can provide a competitive edge.
- Warning: Wifi is not universally provided but is considered essential globally. Ensure reliable Wifi is offered.
Recommendations for Hosts
- Ensure your listing includes all essential amenities for Bon Repos sur Blavet: Smoke alarm, Free parking on premises.
- Prioritize adding missing essentials: Smoke alarm, Free parking on premises.
- Consider adding popular differentiators like Heating or Kitchen to increase appeal.
- Highlight unique or less common amenities you offer (e.g., hot tub, dedicated workspace, EV charger) in your listing description and photos.
- Regularly check competitor amenities in Bon Repos sur Blavet to stay competitive.
Bon Repos sur Blavet Airbnb Guest Demographics & Profile Analysis (2025)
Guest Profile Summary for Bon Repos sur Blavet
- The typical guest profile for Airbnb in Bon Repos sur Blavet consists of primarily domestic travelers (89%), often arriving from nearby Rennes, typically belonging to the Post-2000s (Gen Z/Alpha) group (50%), primarily speaking French or English.
- Domestic travelers account for 89.0% of guests.
- Key international markets include France (89%) and United Kingdom (3.3%).
- Top languages spoken are French (47.2%) followed by English (31.2%).
- A significant demographic segment is the Post-2000s (Gen Z/Alpha) group, representing 50% of guests.
Recommendations for Hosts
- Target domestic marketing efforts towards travelers from Rennes and Paris.
- Tailor amenities and listing descriptions to appeal to the dominant Post-2000s (Gen Z/Alpha) demographic (e.g., highlight fast WiFi, smart home features, local guides).
- Highlight unique local experiences or amenities relevant to the primary guest profile.
- Consider seasonal promotions aligned with peak travel times for key origin markets.
Nearby Short-Term Rental Market Comparison
How does the Bon Repos sur Blavet Airbnb market stack up against its neighbors? Compare key performance metrics like average monthly revenue, ADR, and occupancy rates in surrounding areas to understand the broader regional STR landscape.
| Market | Active Properties | Monthly Revenue | Daily Rate | Avg. Occupancy |
|---|---|---|---|---|
| St Martin | 14 | $4,074 | $436.70 | 51% |
| Saint Lawrence | 11 | $2,911 | $317.86 | 52% |
| St Ouen | 15 | $2,635 | $339.51 | 51% |
| St Clement | 14 | $2,522 | $219.76 | 51% |
| Grouville | 21 | $2,510 | $218.40 | 52% |
| St Helier | 66 | $2,497 | $216.70 | 56% |
| St Saviour | 20 | $2,432 | $199.42 | 54% |
| Île-de-Bréhat | 46 | $2,254 | $221.52 | 45% |
| Trinity | 12 | $2,208 | $156.98 | 61% |
| St Brelade | 49 | $2,206 | $205.10 | 53% |