Billiers Airbnb Market Analysis 2025: Short Term Rental Data & Vacation Rental Statistics in Brittany, France
Is Airbnb profitable in Billiers in 2025? Explore comprehensive Airbnb analytics for Billiers, Brittany, France to uncover income potential. This 2025 STR market report for Billiers, based on AirROI data from April 2024 to March 2025, reveals key trends in the niche market of 31 active listings.
Whether you're considering an Airbnb investment in Billiers, optimizing your existing vacation rental, or exploring rental arbitrage opportunities, understanding the Billiers Airbnb data is crucial. Understanding the local regulations is key to maximizing your short term rental income potential. Let's dive into the specifics.
Key Billiers Airbnb Performance Metrics Overview
Monthly Airbnb Revenue Variations & Income Potential in Billiers (2025)
Understanding the monthly revenue variations for Airbnb listings in Billiers is key to maximizing your short term rental income potential. Seasonality significantly impacts earnings. Our analysis, based on data from the past 12 months, shows that the peak revenue month for STRs in Billiers is typically August, while January often presents the lowest earnings, highlighting opportunities for strategic pricing adjustments during shoulder and low seasons. Explore the typical Airbnb income in Billiers across different performance tiers:
- Best-in-class properties (Top 10%) achieve $3,888+ monthly, often utilizing dynamic pricing and superior guest experiences.
- Strong performing properties (Top 25%) earn $2,037 or more, indicating effective management and desirable locations/amenities.
- Typical properties (Median) generate around $1,138 per month, representing the average market performance.
- Entry-level properties (Bottom 25%) see earnings around $688, often with potential for optimization.
Average Monthly Airbnb Earnings Trend in Billiers
Billiers Airbnb Occupancy Rate Trends (2025)
Maximize your bookings by understanding the Billiers STR occupancy trends. Seasonal demand shifts significantly influence how often properties are booked. Typically, Augustsees the highest demand (peak season occupancy), while January experiences the lowest (low season). Effective strategies, like adjusting minimum stays or offering promotions, can boost occupancy during slower periods. Here's how different property tiers perform in Billiers:
- Best-in-class properties (Top 10%) achieve 72%+ occupancy, indicating high desirability and potentially optimized availability.
- Strong performing properties (Top 25%) maintain 57% or higher occupancy, suggesting good market fit and guest satisfaction.
- Typical properties (Median) have an occupancy rate around 37%.
- Entry-level properties (Bottom 25%) average 19% occupancy, potentially facing higher vacancy.
Average Monthly Occupancy Rate Trend in Billiers
Average Daily Rate (ADR) Airbnb Trends in Billiers (2025)
Effective short term rental pricing strategy in Billiers involves understanding monthly ADR fluctuations. The Average Daily Rate (ADR) for Airbnb in Billiers typically peaks in November and dips lowest during April. Leveraging Airbnb dynamic pricing tools or strategies based on this seasonality can significantly boost revenue. Here's a look at the typical nightly rates achieved:
- Best-in-class properties (Top 10%) command rates of $301+ per night, often due to premium features or locations.
- Strong performing properties (Top 25%) achieve nightly rates of $167 or more.
- Typical properties (Median) charge around $105 per night.
- Entry-level properties (Bottom 25%) earn around $73 per night.
Average Daily Rate (ADR) Trend by Month in Billiers
Get Live Billiers Market Intelligence 👇

Explore Real-time Analytics
Airbnb Seasonality Analysis & Trends in Billiers (2025)
Peak Season (August, July, April)
- Revenue averages $3,137 per month
- Occupancy rates average 63.4%
- Daily rates average $143
Shoulder Season
- Revenue averages $1,569 per month
- Occupancy maintains around 34.0%
- Daily rates hold near $144
Low Season (January, February, March)
- Revenue drops to average $803 per month
- Occupancy decreases to average 26.0%
- Daily rates adjust to average $147
Seasonality Insights for Billiers
- The Airbnb seasonality in Billiers shows highly seasonal trends requiring careful strategy. While the sections above show seasonal averages, it's also insightful to look at the extremes:
- During the high season, the absolute peak month showcases Billiers's highest earning potential, with monthly revenues capable of climbing to $3,864, occupancy reaching a high of 77.8%, and ADRs peaking at $153.
- Conversely, the slowest single month of the year, typically falling within the low season, marks the market's lowest point. In this month, revenue might dip to $596, occupancy could drop to 18.3%, and ADRs may adjust down to $139.
- Understanding both the seasonal averages and these monthly peaks and troughs in revenue, occupancy, and ADR is crucial for maximizing your Airbnb profit potential in Billiers.
Seasonal Strategies for Maximizing Profit
- Peak Season: Maximize revenue through premium pricing and potentially longer minimum stays. Ensure high availability.
- Low Season: Offer competitive pricing, special promotions (e.g., extended stay discounts), and flexible cancellation policies. Target off-season travelers like remote workers or budget-conscious guests.
- Shoulder Seasons: Implement dynamic pricing that balances peak and low rates. Target weekend travelers or specific events. Offer slightly more flexible terms than peak season.
- Regularly analyze your own performance against these Billiers seasonality benchmarks and adjust your pricing and availability strategy accordingly.
Best Areas for Airbnb Investment in Billiers (2025)
Exploring the top neighborhoods for short-term rentals in Billiers? This section highlights key areas, outlining why they are attractive for hosts and guests, along with notable local attractions. Consider these locations based on your target guest profile and investment strategy.
| Neighborhood / Area | Why Host Here? (Target Guests & Appeal) | Key Attractions & Landmarks |
|---|---|---|
| Saint-Malo | Historic fortified town known for its stunning architecture and rich maritime history. Popular with tourists for its beautiful beaches and vibrant city center filled with shops and restaurants. | St. Malo Citadel, Grand Bé Island, Fort National, Saint-Malo Cathedral, La Plage de l'Éventail |
| Dinard | Charming coastal town just across the river from Saint-Malo, renowned for its pleasant beaches and elegant villas. Great spot for families and those seeking a tranquil beach getaway. | Dinard Beach, Promenade Clair de Lune, Pointe de la Malouine, Casino Barrière de Dinard, Port de Dinard |
| Rennes | The capital of Brittany, offering a mix of historical and modern attractions. A vibrant university city with a lively cultural scene, making it attractive for both tourists and business travelers. | Parlement de Bretagne, Rennes Cathedral, Théâtre National de Bretagne, Les Champs Libres, Parc du Thabor |
| Liffré | A growing suburb of Rennes offering a quieter atmosphere while still being close to the city. Attractive to visitors looking for a peaceful retreat with easy access to urban amenities. | Château de Liffré, Les Jardins de l'Hôtel de Ville, Église Saint-Étienne de Liffré |
| Quimper | Historic town known for its medieval architecture and rich cultural heritage. Popular for its art galleries, festivals, and proximity to beautiful countryside and coastline. | Quimper Cathedral, Musee des Beaux-Arts, Anse de Benodet, Ceramics of Quimper |
| Vannes | Beautiful port town with a vibrant marina and medieval town center. It's a key location for tourists exploring the Gulf of Morbihan, making it great for short-term rentals. | Vannes Cathedral, Château de l'Hermine, Gulf of Morbihan, Les Remparts de Vannes |
| Pont-Aven | Charming village known as the artists' haunt, famous for its scenic river views and historic art schools. Attractive to visitors looking for artistic inspiration and natural beauty. | Museum of Pont-Aven, Chapelle de la Trinité, Port of Pont-Aven, Cité des Peintres |
| Camaret-sur-Mer | Seaside commune known for its stunning views of the ocean and coastal walks. A favorite among nature lovers and outdoor enthusiasts, ideal for vacation rentals. | Pointe de Pen-Hir, Camaret Beach, Église Saint-Rémy, Tour Vauban |
Understanding Airbnb License Requirements & STR Laws in Billiers (2025)
With 16% of listings showing registration in 2025, understanding potential Airbnb license requirements is crucial in Billiers. Always verify the latest short term rental regulations and Airbnb license requirements directly with local government authorities for Billiers to ensure full compliance before hosting.
(Source: AirROI data, 2025, based on 16% licensed listings)
Top Performing Airbnb Properties in Billiers (2025)
Benchmark your potential! Explore examples of top-performing Airbnb properties in Billiersbased on Trailing Twelve Month (TTM) revenue. Analyze their characteristics, revenue, occupancy rate, and ADR to understand what drives success in this market.
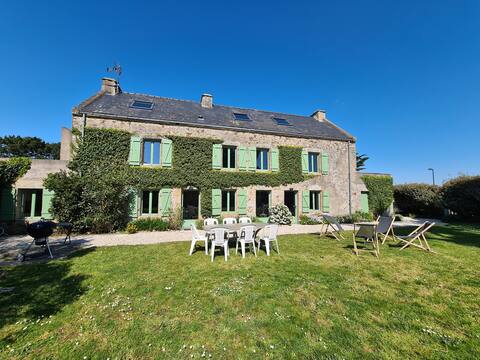
Family home by the sea
Entire Place • 6 bedrooms

Villa Vieilles Vignes sea view
Entire Place • 4 bedrooms

Beautiful villa with pool 1200m from the sea
Entire Place • 4 bedrooms

Manher
Entire Place • 4 bedrooms
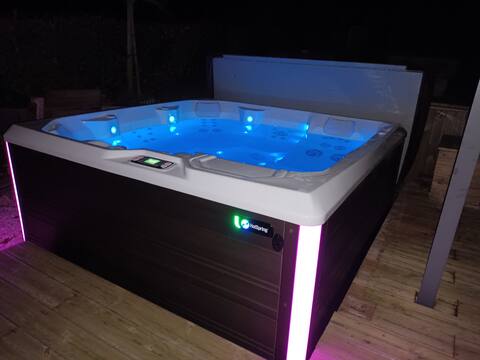
Family home, functional and jacuzzi
Entire Place • 4 bedrooms
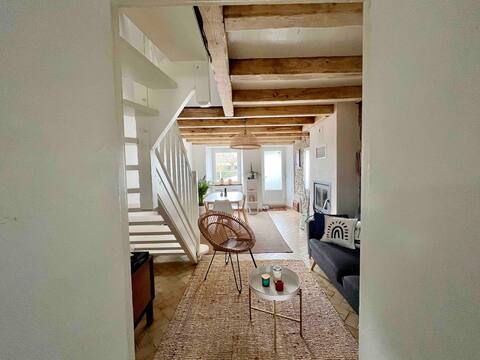
Typical Seaside Fishermen's House.
Entire Place • 3 bedrooms
Note: Performance varies based on location, size, amenities, seasonality, and management quality. Data reflects the past 12 months.
Top Performing Airbnb Hosts in Billiers (2025)
Learn from the best! This table showcases top-performing Airbnb hosts in Billiers based on the number of properties managed and estimated total revenue over the past year. Analyze their scale and performance metrics.
| Host Name | Properties | Grossing Revenue | Stay Reviews | Avg Rating |
|---|---|---|---|---|
| Guillaume | 1 | $56,994 | 40 | 4.83/5.0 |
| Céline Et Laurent | 1 | $53,390 | 13 | 4.85/5.0 |
| Lydie | 2 | $53,176 | 13 | 4.89/5.0 |
| Nicolas Et Cécile | 1 | $43,701 | 12 | 4.92/5.0 |
| Frédéric | 1 | $20,655 | 13 | 4.92/5.0 |
| Corentin | 1 | $19,107 | 122 | 4.70/5.0 |
| Agence COCOONR / BOOK&PAY | 1 | $17,847 | 5 | 4.60/5.0 |
| Marianne | 1 | $16,803 | 41 | 4.83/5.0 |
| Patricia | 1 | $15,621 | 8 | 5.00/5.0 |
| Jeff | 1 | $14,622 | 60 | 4.97/5.0 |
Analyzing the strategies of top hosts, such as their property selection, pricing, and guest communication, can offer valuable lessons for optimizing your own Airbnb operations in Billiers.
Dive Deeper: Advanced Billiers STR Market Data (2025)
Ready to unlock more insights? AirROI provides access to advanced metrics and comprehensive Airbnb data for Billiers. Explore detailed analytics beyond this report to refine your investment strategy, optimize pricing, and maximize your vacation rental profits.
Explore Advanced MetricsBilliers Short-Term Rental Market Composition (2025): Property & Room Types
Room Type Distribution
Property Type Distribution
Market Composition Insights for Billiers
- The Billiers Airbnb market composition is heavily skewed towards Entire Home/Apt listings, which make up 93.5% of the 31 active rentals. This indicates strong guest preference for privacy and space.
- Looking at the property type distribution in Billiers, House properties are the most common (74.2%), reflecting the local real estate landscape.
- Houses represent a significant 74.2% portion, catering likely to families or larger groups.
- Smaller segments like hotel/boutique, others (combined 6.4%) offer potential for unique stay experiences.
Billiers Airbnb Room Capacity Analysis (2025): Bedroom Distribution
Distribution of Listings by Number of Bedrooms
Room Capacity Insights for Billiers
- The dominant room capacity in Billiers is 1 bedroom listings, making up 29% of the market. This suggests a strong demand for properties suitable for couples or solo travelers.
- Together, 1 bedroom and 3 bedrooms properties represent 54.8% of the active Airbnb listings in Billiers, indicating a high concentration in these sizes.
- A significant 54.8% of listings offer 3+ bedrooms, catering to larger groups and families seeking more space in Billiers.
Billiers Vacation Rental Guest Capacity Trends (2025)
Distribution of Listings by Guest Capacity
Guest Capacity Insights for Billiers
- The most common guest capacity trend in Billiers vacation rentals is listings accommodating 8+ guests (29%). This suggests the primary traveler segment is likely larger groups.
- Properties designed for 8+ guests and 4 guests dominate the Billiers STR market, accounting for 51.6% of listings.
- 54.8% of properties accommodate 6+ guests, serving the market segment for larger families or group travel in Billiers.
- On average, properties in Billiers are equipped to host 5.5 guests.
Billiers Airbnb Booking Patterns (2025): Available vs. Booked Days
Available Days Distribution
Booked Days Distribution
Booking Pattern Insights for Billiers
- The most common availability pattern in Billiers falls within the 271-366 days range, representing 48.4% of listings. This suggests many properties have significant open periods on their calendars.
- Approximately 90.3% of listings show high availability (181+ days open annually), indicating potential for increased bookings or specific owner usage patterns.
- For booked days, the 91-180 days range is most frequent in Billiers (41.9%), reflecting common guest stay durations or potential owner blocking patterns.
- A notable 9.7% of properties secure long booking periods (181+ days booked per year), highlighting successful long-term rental strategies or significant owner usage.
Billiers Airbnb Minimum Stay Requirements Analysis
Distribution of Listings by Minimum Night Requirement
1 Night
4 listings
12.9% of total
2 Nights
14 listings
45.2% of total
3 Nights
4 listings
12.9% of total
4-6 Nights
3 listings
9.7% of total
7-29 Nights
5 listings
16.1% of total
30+ Nights
1 listings
3.2% of total
Key Insights
- The most prevalent minimum stay requirement in Billiers is 2 Nights, adopted by 45.2% of listings. This highlights the market's preference for shorter, flexible bookings.
Recommendations
- Align with the market by considering a 2 Nights minimum stay, as 45.2% of Billiers hosts use this setting.
- If feasible, allowing 1-night stays, especially midweek or during low season, could capture last-minute bookings, as only 12.9% currently do.
- A 2-night minimum appears standard (45.2%). Consider this for weekends or peak periods.
- Adjust minimum nights based on seasonality – potentially shorter during low season and longer during peak demand periods in Billiers.
Billiers Airbnb Cancellation Policy Trends Analysis (2025)
Flexible
9 listings
32.1% of total
Moderate
4 listings
14.3% of total
Firm
7 listings
25% of total
Strict
8 listings
28.6% of total
Cancellation Policy Insights for Billiers
- The prevailing Airbnb cancellation policy trend in Billiers is Flexible, used by 32.1% of listings.
- A majority (53.6%) of hosts in Billiers utilize Firm or Strict policies, indicating a market where hosts prioritize booking security.
Recommendations for Hosts
- Consider adopting a Flexible policy to align with the 32.1% market standard in Billiers.
- Regularly review your cancellation policy against competitors and market demand shifts in Billiers.
Billiers STR Booking Lead Time Analysis (2025)
Average Booking Lead Time by Month
Booking Lead Time Insights for Billiers
- The overall average booking lead time for vacation rentals in Billiers is 59 days.
- Guests book furthest in advance for stays during July (average 108 days), likely coinciding with peak travel demand or local events.
- The shortest booking windows occur for stays in February (average 19 days), indicating more last-minute travel plans during this time.
- Seasonally, Summer (90 days avg.) sees the longest lead times, while Fall (40 days avg.) has the shortest, reflecting typical travel planning cycles.
Recommendations for Hosts
- Use the overall average lead time (59 days) as a baseline for your pricing and availability strategy in Billiers.
- For July stays, consider implementing length-of-stay discounts or slightly higher rates for bookings made less than 108 days out to capitalize on advance planning.
- Target marketing efforts for the Summer season well in advance (at least 90 days) to capture early planners.
- Monitor your own booking lead times against these Billiers averages to identify opportunities for dynamic pricing adjustments.
Popular & Essential Airbnb Amenities in Billiers (2025)
Amenity Prevalence
Amenity Insights for Billiers
- Essential amenities in Billiers that guests expect include: Kitchen, Smoke alarm, Heating, Hot water. Lacking these (any) could significantly impact bookings.
- Popular amenities like Hair dryer, Refrigerator, Coffee maker are common but not universal. Offering these can provide a competitive edge.
- Warning: Wifi is not universally provided but is considered essential globally. Ensure reliable Wifi is offered.
Recommendations for Hosts
- Ensure your listing includes all essential amenities for Billiers: Kitchen, Smoke alarm, Heating, Hot water.
- Prioritize adding missing essentials: Heating, Hot water.
- Consider adding popular differentiators like Hair dryer or Refrigerator to increase appeal.
- Highlight unique or less common amenities you offer (e.g., hot tub, dedicated workspace, EV charger) in your listing description and photos.
- Regularly check competitor amenities in Billiers to stay competitive.
Billiers Airbnb Guest Demographics & Profile Analysis (2025)
Guest Profile Summary for Billiers
- The typical guest profile for Airbnb in Billiers consists of primarily domestic travelers (91%), often arriving from nearby Paris, typically belonging to the Post-2000s (Gen Z/Alpha) group (50%), primarily speaking French or English.
- Domestic travelers account for 90.6% of guests.
- Key international markets include France (90.6%) and United Kingdom (3.4%).
- Top languages spoken are French (49.4%) followed by English (31.5%).
- A significant demographic segment is the Post-2000s (Gen Z/Alpha) group, representing 50% of guests.
Recommendations for Hosts
- Target domestic marketing efforts towards travelers from Paris and Rennes.
- Tailor amenities and listing descriptions to appeal to the dominant Post-2000s (Gen Z/Alpha) demographic (e.g., highlight fast WiFi, smart home features, local guides).
- Highlight unique local experiences or amenities relevant to the primary guest profile.
- Consider seasonal promotions aligned with peak travel times for key origin markets.
Nearby Short-Term Rental Market Comparison
How does the Billiers Airbnb market stack up against its neighbors? Compare key performance metrics like average monthly revenue, ADR, and occupancy rates in surrounding areas to understand the broader regional STR landscape.
| Market | Active Properties | Monthly Revenue | Daily Rate | Avg. Occupancy |
|---|---|---|---|---|
| Le Bois-Plage-en-Ré | 303 | $2,528 | $284.63 | 45% |
| Sainte-Florence | 10 | $2,445 | $233.78 | 46% |
| La Flotte | 396 | $2,382 | $236.53 | 46% |
| Île-de-Bréhat | 46 | $2,254 | $221.52 | 45% |
| La Couarde-sur-Mer | 218 | $2,188 | $259.23 | 41% |
| Le Parc | 13 | $2,138 | $173.31 | 43% |
| Ombrée d'Anjou | 21 | $2,063 | $213.63 | 35% |
| Lanmodez | 19 | $2,050 | $219.93 | 42% |
| Île-aux-Moines | 98 | $2,048 | $236.18 | 42% |
| Laillé | 12 | $2,046 | $116.65 | 37% |