Ornans Airbnb Market Analysis 2025: Short Term Rental Data & Vacation Rental Statistics in Bourgogne – Franche-Comté, France
Is Airbnb profitable in Ornans in 2025? Explore comprehensive Airbnb analytics for Ornans, Bourgogne – Franche-Comté, France to uncover income potential. This 2025 STR market report for Ornans, based on AirROI data from April 2024 to March 2025, reveals key trends in the niche market of 54 active listings.
Whether you're considering an Airbnb investment in Ornans, optimizing your existing vacation rental, or exploring rental arbitrage opportunities, understanding the Ornans Airbnb data is crucial. Leveraging the low regulation environment is key to maximizing your short term rental income potential. Let's dive into the specifics.
Key Ornans Airbnb Performance Metrics Overview
Monthly Airbnb Revenue Variations & Income Potential in Ornans (2025)
Understanding the monthly revenue variations for Airbnb listings in Ornans is key to maximizing your short term rental income potential. Seasonality significantly impacts earnings. Our analysis, based on data from the past 12 months, shows that the peak revenue month for STRs in Ornans is typically August, while January often presents the lowest earnings, highlighting opportunities for strategic pricing adjustments during shoulder and low seasons. Explore the typical Airbnb income in Ornans across different performance tiers:
- Best-in-class properties (Top 10%) achieve $3,112+ monthly, often utilizing dynamic pricing and superior guest experiences.
- Strong performing properties (Top 25%) earn $1,999 or more, indicating effective management and desirable locations/amenities.
- Typical properties (Median) generate around $1,237 per month, representing the average market performance.
- Entry-level properties (Bottom 25%) see earnings around $662, often with potential for optimization.
Average Monthly Airbnb Earnings Trend in Ornans
Ornans Airbnb Occupancy Rate Trends (2025)
Maximize your bookings by understanding the Ornans STR occupancy trends. Seasonal demand shifts significantly influence how often properties are booked. Typically, Augustsees the highest demand (peak season occupancy), while March experiences the lowest (low season). Effective strategies, like adjusting minimum stays or offering promotions, can boost occupancy during slower periods. Here's how different property tiers perform in Ornans:
- Best-in-class properties (Top 10%) achieve 77%+ occupancy, indicating high desirability and potentially optimized availability.
- Strong performing properties (Top 25%) maintain 62% or higher occupancy, suggesting good market fit and guest satisfaction.
- Typical properties (Median) have an occupancy rate around 43%.
- Entry-level properties (Bottom 25%) average 22% occupancy, potentially facing higher vacancy.
Average Monthly Occupancy Rate Trend in Ornans
Average Daily Rate (ADR) Airbnb Trends in Ornans (2025)
Effective short term rental pricing strategy in Ornans involves understanding monthly ADR fluctuations. The Average Daily Rate (ADR) for Airbnb in Ornans typically peaks in November and dips lowest during September. Leveraging Airbnb dynamic pricing tools or strategies based on this seasonality can significantly boost revenue. Here's a look at the typical nightly rates achieved:
- Best-in-class properties (Top 10%) command rates of $190+ per night, often due to premium features or locations.
- Strong performing properties (Top 25%) achieve nightly rates of $119 or more.
- Typical properties (Median) charge around $88 per night.
- Entry-level properties (Bottom 25%) earn around $61 per night.
Average Daily Rate (ADR) Trend by Month in Ornans
Get Live Ornans Market Intelligence 👇

Explore Real-time Analytics
Airbnb Seasonality Analysis & Trends in Ornans (2025)
Peak Season (August, April, May)
- Revenue averages $2,147 per month
- Occupancy rates average 53.5%
- Daily rates average $110
Shoulder Season
- Revenue averages $1,670 per month
- Occupancy maintains around 45.2%
- Daily rates hold near $113
Low Season (January, February, March)
- Revenue drops to average $989 per month
- Occupancy decreases to average 30.8%
- Daily rates adjust to average $115
Seasonality Insights for Ornans
- The Airbnb seasonality in Ornans shows highly seasonal trends requiring careful strategy. While the sections above show seasonal averages, it's also insightful to look at the extremes:
- During the high season, the absolute peak month showcases Ornans's highest earning potential, with monthly revenues capable of climbing to $2,511, occupancy reaching a high of 67.3%, and ADRs peaking at $120.
- Conversely, the slowest single month of the year, typically falling within the low season, marks the market's lowest point. In this month, revenue might dip to $820, occupancy could drop to 28.3%, and ADRs may adjust down to $107.
- Understanding both the seasonal averages and these monthly peaks and troughs in revenue, occupancy, and ADR is crucial for maximizing your Airbnb profit potential in Ornans.
Seasonal Strategies for Maximizing Profit
- Peak Season: Maximize revenue through premium pricing and potentially longer minimum stays. Ensure high availability.
- Low Season: Offer competitive pricing, special promotions (e.g., extended stay discounts), and flexible cancellation policies. Target off-season travelers like remote workers or budget-conscious guests.
- Shoulder Seasons: Implement dynamic pricing that balances peak and low rates. Target weekend travelers or specific events. Offer slightly more flexible terms than peak season.
- Regularly analyze your own performance against these Ornans seasonality benchmarks and adjust your pricing and availability strategy accordingly.
Best Areas for Airbnb Investment in Ornans (2025)
Exploring the top neighborhoods for short-term rentals in Ornans? This section highlights key areas, outlining why they are attractive for hosts and guests, along with notable local attractions. Consider these locations based on your target guest profile and investment strategy.
| Neighborhood / Area | Why Host Here? (Target Guests & Appeal) | Key Attractions & Landmarks |
|---|---|---|
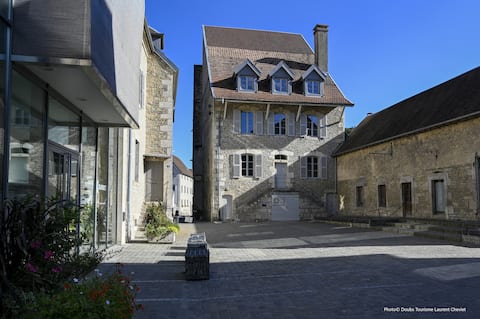
| Centre-Ville | The heart of Ornans, offering easy access to local shops and cafes. Ideal for travelers seeking a quaint French town experience with picturesque views and cultural heritage. | Museum of the Loue, Basilica of Saint John, Source of the Loue, Charles de Gaulle Square, Historic old town streets |
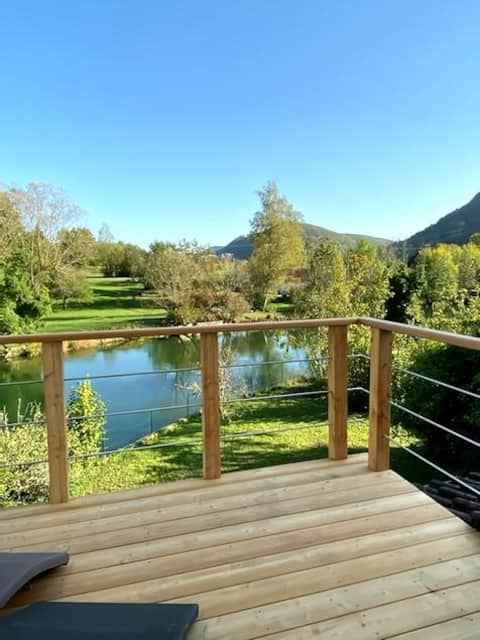
| La Vallée de la Loue | Beautiful natural area surrounding Ornans, perfect for visitors looking for outdoor activities and exploring nature. A serene escape with stunning landscapes. | Loue River, Hiking trails, Fishing spots, Canoeing and kayaking, Picnic areas amidst nature |
| Museum of Fine Arts | Cultural hotspot featuring works of local artists, visiting art exhibitions, and providing insight into the region's artistic heritage. Attracts art lovers and cultural tourists. | Paintings by Gustave Courbet, Local art exhibitions, Workshops and events, Library of arts |
| Chemin de la Petite Venise | Charming path along the river, lined with picturesque views and quaint spots to relax. A favorite among couples and nature enthusiasts. | Scenic walks, Photography opportunities, Cafés along the path, Fishing spots |
| The Bridge of Ornans | Iconic bridge in Ornans, offering beautiful views of the town and river. A great spot for photography and leisure walks, especially popular during sunset. | Panoramic views, Historic architecture, Photogenic spots |
| Grotte de la Poudrière | A unique natural site with cave tours and exploration opportunities. Appeals to adventure seekers and those interested in geology. | Guided cave tours, Geological exhibits, Nature walks |
| Canyoning and Adventure Sports Area | For thrill-seekers, this area offers canyoning, rock climbing, and other adventure sports. Popular among younger travelers and groups. | Canyoning experiences, Rock climbing, Outdoor adventure guides |
| Local Gastronomy Tours | Culinary experiences showcasing local cuisine and wine, attracting food lovers and those interested in French culinary traditions. | Wine tasting events, Cooking classes, Local markets |
Understanding Airbnb License Requirements & STR Laws in Ornans (2025)
While Ornans, Bourgogne – Franche-Comté, France currently shows low STR regulations, specific Airbnb license requirements might still exist or change. Always verify the latest short term rental regulations and Airbnb license requirements directly with local government authorities for Ornans to ensure full compliance before hosting.
(Source: AirROI data, 2025, based on 6% licensed listings)
Top Performing Airbnb Properties in Ornans (2025)
Benchmark your potential! Explore examples of top-performing Airbnb properties in Ornansbased on Trailing Twelve Month (TTM) revenue. Analyze their characteristics, revenue, occupancy rate, and ADR to understand what drives success in this market.

Les Muses, Old mansion with HOT TUB
Entire Place • 6 bedrooms
Les Muses, mi-gîte 6 avec SPA
Entire Place • 3 bedrooms

VILLA LA ROSA 4 ETOILES
Entire Place • 4 bedrooms
GITE LA BASTIDE/ TREND AND DESIGN
Entire Place • 3 bedrooms
La Plante, trendy and design
Entire Place • 3 bedrooms

A family cottage in the heart of the Doubs, near Ornans
Entire Place • 3 bedrooms
Note: Performance varies based on location, size, amenities, seasonality, and management quality. Data reflects the past 12 months.
Top Performing Airbnb Hosts in Ornans (2025)
Learn from the best! This table showcases top-performing Airbnb hosts in Ornans based on the number of properties managed and estimated total revenue over the past year. Analyze their scale and performance metrics.
| Host Name | Properties | Grossing Revenue | Stay Reviews | Avg Rating |
|---|---|---|---|---|
| Carole | 7 | $232,953 | 88 | 3.56/5.0 |
| Sonia | 6 | $160,890 | 418 | 4.96/5.0 |
| Grégory | 3 | $51,391 | 169 | 4.25/5.0 |
| Caroline | 3 | $35,886 | 601 | 4.89/5.0 |
| Emmanuelle | 1 | $29,757 | 89 | 4.64/5.0 |
| Julien | 2 | $28,265 | 211 | 4.56/5.0 |
| Sylviane | 1 | $27,794 | 26 | 5.00/5.0 |
| Carole | 2 | $24,934 | 150 | 4.91/5.0 |
| Christian | 1 | $22,611 | 125 | 4.88/5.0 |
| Delphine | 1 | $19,612 | 51 | 4.88/5.0 |
Analyzing the strategies of top hosts, such as their property selection, pricing, and guest communication, can offer valuable lessons for optimizing your own Airbnb operations in Ornans.
Dive Deeper: Advanced Ornans STR Market Data (2025)
Ready to unlock more insights? AirROI provides access to advanced metrics and comprehensive Airbnb data for Ornans. Explore detailed analytics beyond this report to refine your investment strategy, optimize pricing, and maximize your vacation rental profits.
Explore Advanced MetricsOrnans Short-Term Rental Market Composition (2025): Property & Room Types
Room Type Distribution
Property Type Distribution
Market Composition Insights for Ornans
- The Ornans Airbnb market composition is heavily skewed towards Entire Home/Apt listings, which make up 85.2% of the 54 active rentals. This indicates strong guest preference for privacy and space.
- Looking at the property type distribution in Ornans, Apartment/Condo properties are the most common (48.1%), reflecting the local real estate landscape.
- Houses represent a significant 38.9% portion, catering likely to families or larger groups.
- The presence of 11.1% Hotel/Boutique listings indicates integration with traditional hospitality.
- Smaller segments like others (combined 1.9%) offer potential for unique stay experiences.
Ornans Airbnb Room Capacity Analysis (2025): Bedroom Distribution
Distribution of Listings by Number of Bedrooms
Room Capacity Insights for Ornans
- The dominant room capacity in Ornans is 1 bedroom listings, making up 37% of the market. This suggests a strong demand for properties suitable for couples or solo travelers.
- Together, 1 bedroom and 2 bedrooms properties represent 68.5% of the active Airbnb listings in Ornans, indicating a high concentration in these sizes.
- A significant 27.9% of listings offer 3+ bedrooms, catering to larger groups and families seeking more space in Ornans.
Ornans Vacation Rental Guest Capacity Trends (2025)
Distribution of Listings by Guest Capacity
Guest Capacity Insights for Ornans
- The most common guest capacity trend in Ornans vacation rentals is listings accommodating 6 guests (18.5%). This suggests the primary traveler segment is likely larger groups.
- Properties designed for 6 guests and 3 guests dominate the Ornans STR market, accounting for 35.2% of listings.
- 42.6% of properties accommodate 6+ guests, serving the market segment for larger families or group travel in Ornans.
- On average, properties in Ornans are equipped to host 4.6 guests.
Ornans Airbnb Booking Patterns (2025): Available vs. Booked Days
Available Days Distribution
Booked Days Distribution
Booking Pattern Insights for Ornans
- The most common availability pattern in Ornans falls within the 181-270 days range, representing 42.6% of listings. This suggests many properties have significant open periods on their calendars.
- Approximately 68.5% of listings show high availability (181+ days open annually), indicating potential for increased bookings or specific owner usage patterns.
- For booked days, the 91-180 days range is most frequent in Ornans (44.4%), reflecting common guest stay durations or potential owner blocking patterns.
- A notable 31.5% of properties secure long booking periods (181+ days booked per year), highlighting successful long-term rental strategies or significant owner usage.
Ornans Airbnb Minimum Stay Requirements Analysis
Distribution of Listings by Minimum Night Requirement
1 Night
18 listings
35.3% of total
2 Nights
25 listings
49% of total
3 Nights
3 listings
5.9% of total
30+ Nights
5 listings
9.8% of total
Key Insights
- The most prevalent minimum stay requirement in Ornans is 2 Nights, adopted by 49% of listings. This highlights the market's preference for shorter, flexible bookings.
- A strong majority (84.3%) of the Ornans Airbnb data shows acceptance of very short stays (1-2 nights), indicating a dynamic, high-turnover market.
Recommendations
- Align with the market by considering a 2 Nights minimum stay, as 49% of Ornans hosts use this setting.
- Explore offering discounts for stays of 30+ nights to attract the 9.8% of the market seeking extended stays.
- Adjust minimum nights based on seasonality – potentially shorter during low season and longer during peak demand periods in Ornans.
Ornans Airbnb Cancellation Policy Trends Analysis (2025)
Flexible
18 listings
38.3% of total
Moderate
18 listings
38.3% of total
Firm
6 listings
12.8% of total
Strict
5 listings
10.6% of total
Cancellation Policy Insights for Ornans
- The prevailing Airbnb cancellation policy trend in Ornans is Flexible, used by 38.3% of listings.
- The market strongly favors guest-friendly terms, with 76.6% of listings offering Flexible or Moderate policies. This suggests guests in Ornans may expect booking flexibility.
Recommendations for Hosts
- Consider adopting a Flexible policy to align with the 38.3% market standard in Ornans.
- Using a Strict policy might deter some guests, as only 10.6% of listings use it. Evaluate if potential revenue protection outweighs possible lower booking rates.
- Regularly review your cancellation policy against competitors and market demand shifts in Ornans.
Ornans STR Booking Lead Time Analysis (2025)
Average Booking Lead Time by Month
Booking Lead Time Insights for Ornans
- The overall average booking lead time for vacation rentals in Ornans is 40 days.
- Guests book furthest in advance for stays during May (average 70 days), likely coinciding with peak travel demand or local events.
- The shortest booking windows occur for stays in February (average 22 days), indicating more last-minute travel plans during this time.
- Seasonally, Summer (61 days avg.) sees the longest lead times, while Winter (37 days avg.) has the shortest, reflecting typical travel planning cycles.
Recommendations for Hosts
- Use the overall average lead time (40 days) as a baseline for your pricing and availability strategy in Ornans.
- For May stays, consider implementing length-of-stay discounts or slightly higher rates for bookings made less than 70 days out to capitalize on advance planning.
- Target marketing efforts for the Summer season well in advance (at least 61 days) to capture early planners.
- Monitor your own booking lead times against these Ornans averages to identify opportunities for dynamic pricing adjustments.
Popular & Essential Airbnb Amenities in Ornans (2025)
Amenity Prevalence
Amenity Insights for Ornans
- Popular amenities like Kitchen, TV, Heating are common but not universal. Offering these can provide a competitive edge.
- Warning: Wifi is not universally provided but is considered essential globally. Ensure reliable Wifi is offered.
Recommendations for Hosts
- Consider adding popular differentiators like Kitchen or TV to increase appeal.
- Highlight unique or less common amenities you offer (e.g., hot tub, dedicated workspace, EV charger) in your listing description and photos.
- Regularly check competitor amenities in Ornans to stay competitive.
Ornans Airbnb Guest Demographics & Profile Analysis (2025)
Guest Profile Summary for Ornans
- The typical guest profile for Airbnb in Ornans consists of primarily domestic travelers (74%), often arriving from nearby Paris, typically belonging to the Post-2000s (Gen Z/Alpha) group (50%), primarily speaking French or English.
- Domestic travelers account for 74.3% of guests.
- Key international markets include France (74.3%) and Switzerland (8.7%).
- Top languages spoken are French (38.5%) followed by English (31.5%).
- A significant demographic segment is the Post-2000s (Gen Z/Alpha) group, representing 50% of guests.
Recommendations for Hosts
- Target domestic marketing efforts towards travelers from Paris and Dijon.
- Tailor amenities and listing descriptions to appeal to the dominant Post-2000s (Gen Z/Alpha) demographic (e.g., highlight fast WiFi, smart home features, local guides).
- Highlight unique local experiences or amenities relevant to the primary guest profile.
- Consider seasonal promotions aligned with peak travel times for key origin markets.
Nearby Short-Term Rental Market Comparison
How does the Ornans Airbnb market stack up against its neighbors? Compare key performance metrics like average monthly revenue, ADR, and occupancy rates in surrounding areas to understand the broader regional STR landscape.
| Market | Active Properties | Monthly Revenue | Daily Rate | Avg. Occupancy |
|---|---|---|---|---|
| Lauterbrunnen | 525 | $7,079 | $546.45 | 54% |
| La Rivière-Enverse | 17 | $5,972 | $624.02 | 41% |
| Matten bei Interlaken | 52 | $5,674 | $316.63 | 63% |
| Iseltwald | 14 | $5,491 | $331.95 | 58% |
| Habkern | 13 | $5,382 | $344.74 | 50% |
| Interlaken | 288 | $4,987 | $310.52 | 56% |
| Zermatt | 734 | $4,604 | $463.00 | 46% |
| Oberhofen am Thunersee | 24 | $4,572 | $265.94 | 55% |
| Sigriswil | 99 | $4,371 | $271.90 | 58% |
| Bönigen | 32 | $4,321 | $253.84 | 64% |