Montbéliard Airbnb Market Analysis 2025: Short Term Rental Data & Vacation Rental Statistics in Bourgogne – Franche-Comté, France
Is Airbnb profitable in Montbéliard in 2025? Explore comprehensive Airbnb analytics for Montbéliard, Bourgogne – Franche-Comté, France to uncover income potential. This 2025 STR market report for Montbéliard, based on AirROI data from April 2024 to March 2025, reveals key trends in the niche market of 148 active listings.
Whether you're considering an Airbnb investment in Montbéliard, optimizing your existing vacation rental, or exploring rental arbitrage opportunities, understanding the Montbéliard Airbnb data is crucial. Leveraging the low regulation environment is key to maximizing your short term rental income potential. Let's dive into the specifics.
Key Montbéliard Airbnb Performance Metrics Overview
Monthly Airbnb Revenue Variations & Income Potential in Montbéliard (2025)
Understanding the monthly revenue variations for Airbnb listings in Montbéliard is key to maximizing your short term rental income potential. Seasonality significantly impacts earnings. Our analysis, based on data from the past 12 months, shows that the peak revenue month for STRs in Montbéliard is typically May, while March often presents the lowest earnings, highlighting opportunities for strategic pricing adjustments during shoulder and low seasons. Explore the typical Airbnb income in Montbéliard across different performance tiers:
- Best-in-class properties (Top 10%) achieve $1,879+ monthly, often utilizing dynamic pricing and superior guest experiences.
- Strong performing properties (Top 25%) earn $1,286 or more, indicating effective management and desirable locations/amenities.
- Typical properties (Median) generate around $791 per month, representing the average market performance.
- Entry-level properties (Bottom 25%) see earnings around $335, often with potential for optimization.
Average Monthly Airbnb Earnings Trend in Montbéliard
Montbéliard Airbnb Occupancy Rate Trends (2025)
Maximize your bookings by understanding the Montbéliard STR occupancy trends. Seasonal demand shifts significantly influence how often properties are booked. Typically, Decembersees the highest demand (peak season occupancy), while March experiences the lowest (low season). Effective strategies, like adjusting minimum stays or offering promotions, can boost occupancy during slower periods. Here's how different property tiers perform in Montbéliard:
- Best-in-class properties (Top 10%) achieve 75%+ occupancy, indicating high desirability and potentially optimized availability.
- Strong performing properties (Top 25%) maintain 57% or higher occupancy, suggesting good market fit and guest satisfaction.
- Typical properties (Median) have an occupancy rate around 34%.
- Entry-level properties (Bottom 25%) average 17% occupancy, potentially facing higher vacancy.
Average Monthly Occupancy Rate Trend in Montbéliard
Average Daily Rate (ADR) Airbnb Trends in Montbéliard (2025)
Effective short term rental pricing strategy in Montbéliard involves understanding monthly ADR fluctuations. The Average Daily Rate (ADR) for Airbnb in Montbéliard typically peaks in December and dips lowest during September. Leveraging Airbnb dynamic pricing tools or strategies based on this seasonality can significantly boost revenue. Here's a look at the typical nightly rates achieved:
- Best-in-class properties (Top 10%) command rates of $99+ per night, often due to premium features or locations.
- Strong performing properties (Top 25%) achieve nightly rates of $78 or more.
- Typical properties (Median) charge around $53 per night.
- Entry-level properties (Bottom 25%) earn around $41 per night.
Average Daily Rate (ADR) Trend by Month in Montbéliard
Get Live Montbéliard Market Intelligence 👇

Explore Real-time Analytics
Airbnb Seasonality Analysis & Trends in Montbéliard (2025)
Peak Season (May, December, June)
- Revenue averages $1,307 per month
- Occupancy rates average 39.9%
- Daily rates average $65
Shoulder Season
- Revenue averages $933 per month
- Occupancy maintains around 40.4%
- Daily rates hold near $61
Low Season (January, February, March)
- Revenue drops to average $594 per month
- Occupancy decreases to average 30.7%
- Daily rates adjust to average $64
Seasonality Insights for Montbéliard
- The Airbnb seasonality in Montbéliard shows highly seasonal trends requiring careful strategy. While the sections above show seasonal averages, it's also insightful to look at the extremes:
- During the high season, the absolute peak month showcases Montbéliard's highest earning potential, with monthly revenues capable of climbing to $1,397, occupancy reaching a high of 49.9%, and ADRs peaking at $75.
- Conversely, the slowest single month of the year, typically falling within the low season, marks the market's lowest point. In this month, revenue might dip to $547, occupancy could drop to 28.0%, and ADRs may adjust down to $59.
- Understanding both the seasonal averages and these monthly peaks and troughs in revenue, occupancy, and ADR is crucial for maximizing your Airbnb profit potential in Montbéliard.
Seasonal Strategies for Maximizing Profit
- Peak Season: Maximize revenue through premium pricing and potentially longer minimum stays. Ensure high availability.
- Low Season: Offer competitive pricing, special promotions (e.g., extended stay discounts), and flexible cancellation policies. Target off-season travelers like remote workers or budget-conscious guests.
- Shoulder Seasons: Implement dynamic pricing that balances peak and low rates. Target weekend travelers or specific events. Offer slightly more flexible terms than peak season.
- Regularly analyze your own performance against these Montbéliard seasonality benchmarks and adjust your pricing and availability strategy accordingly.
Best Areas for Airbnb Investment in Montbéliard (2025)
Exploring the top neighborhoods for short-term rentals in Montbéliard? This section highlights key areas, outlining why they are attractive for hosts and guests, along with notable local attractions. Consider these locations based on your target guest profile and investment strategy.
| Neighborhood / Area | Why Host Here? (Target Guests & Appeal) | Key Attractions & Landmarks |
|---|---|---|
| Centre Ville | The city center of Montbéliard offers a mix of historical charm and modern amenities, making it attractive for tourists. Its proximity to shops, restaurants, and cultural landmarks makes it a prime location for short-term rentals. | Château de Montbéliard, Basilique du Sacré-Cœur, Parc de la D76, Musée de Montbéliard, Place Saint-Martin |
| Belfort | Located just outside Montbéliard, Belfort is known for its stunning architecture and historical significance, including the famous Lion of Belfort. It is a popular area for visitors who are exploring the wider Franche-Comté region. | Lion of Belfort, Citadel of Belfort, Belfort Cathedral, Place d'Armes, Château de la Miotte |
| Valentigney | A suburban area near Montbéliard that offers a quieter stay while still being close to the city's attractions. Ideal for families looking for a peaceful retreat with easy access to Montbéliard. | Port de Valentigney, Local parks, Historical sites, Walking trails |
| Audincourt | A small town located near Montbéliard, Audincourt boasts a friendly vibe and local charm, making it an appealing spot for those visiting the region. It’s a good choice for budget-conscious travelers. | Parc du Prélot, Local markets, Nearby restaurants, Cultural events |
| Sochaux | Home to the Peugeot company, Sochaux attracts business travelers and car enthusiasts alike. Its industrial heritage and nearby attractions make it a worthwhile place for short-term rental investments. | Musée de l'Aventure Peugeot, Parc des expositions, Cultural events, Local parks |
| Montbéliard's Old Town | The historic district offers a picturesque setting with narrow streets, quaint cafes, and local shops. Perfect for guests who want to experience the traditional culture of Montbéliard. | Rue de la République, Place des Halles, Old Town architecture, Local festivals |
| Bourgogne-Franche-Comté countryside | The surrounding countryside offers a peaceful retreat with natural beauty, attracting guests who enjoy outdoor activities such as hiking and biking. Ideal for nature lovers. | Natural parks, Scenic views, Hiking trails, Vineyards |
| Dole | Dole is a little further but famous for its beautiful architecture and vibrant cultural scene. It is also known for its artisan foods and markets, appealing to visitors looking for a taste of local life. | Musée des Beaux-Arts de Dole, Dole's Old City, Café culture, Markets, Local festivals |
Understanding Airbnb License Requirements & STR Laws in Montbéliard (2025)
While Montbéliard, Bourgogne – Franche-Comté, France currently shows low STR regulations, specific Airbnb license requirements might still exist or change. Always verify the latest short term rental regulations and Airbnb license requirements directly with local government authorities for Montbéliard to ensure full compliance before hosting.
(Source: AirROI data, 2025, based on 2% licensed listings)
Top Performing Airbnb Properties in Montbéliard (2025)
Benchmark your potential! Explore examples of top-performing Airbnb properties in Montbéliardbased on Trailing Twelve Month (TTM) revenue. Analyze their characteristics, revenue, occupancy rate, and ADR to understand what drives success in this market.
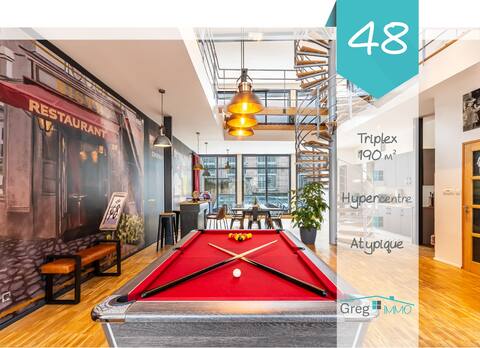
* Le 48 * GregIMMO * Appart 'Hôtel
Entire Place • 3 bedrooms
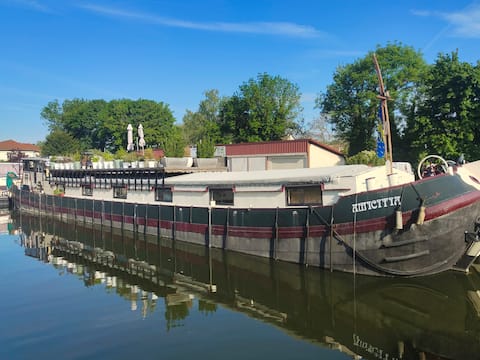
Houseboat accommodation at the dock unusual stay atypical
Entire Place • 2 bedrooms
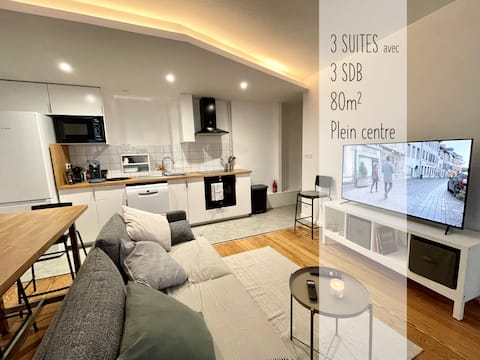
Unique - Aparthotel family
Entire Place • 3 bedrooms
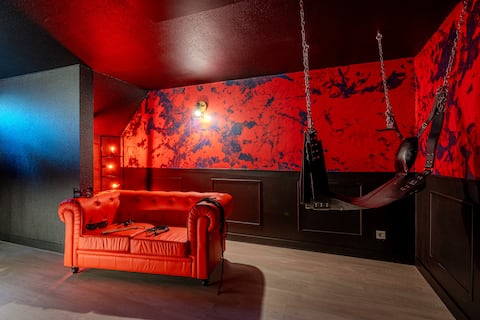
Cocon Sensuel - 50 Nuances - Les Cocons de Nath
Entire Place • 1 bedroom
Les Poutres de Cuvier
Entire Place • 1 bedroom
appartement duplex bon standing
Entire Place • 3 bedrooms
Note: Performance varies based on location, size, amenities, seasonality, and management quality. Data reflects the past 12 months.
Top Performing Airbnb Hosts in Montbéliard (2025)
Learn from the best! This table showcases top-performing Airbnb hosts in Montbéliard based on the number of properties managed and estimated total revenue over the past year. Analyze their scale and performance metrics.
| Host Name | Properties | Grossing Revenue | Stay Reviews | Avg Rating |
|---|---|---|---|---|
| Grégory | 12 | $146,193 | 402 | 4.38/5.0 |
| Nathanaël | 5 | $70,547 | 189 | 4.51/5.0 |
| Thibaut | 5 | $65,866 | 180 | 4.86/5.0 |
| Elvire | 1 | $34,425 | 88 | 4.99/5.0 |
| Jds | 4 | $33,249 | 528 | 4.64/5.0 |
| Stephanie | 3 | $32,840 | 23 | 4.71/5.0 |
| Félix | 2 | $32,710 | 71 | 4.80/5.0 |
| Aurélien | 1 | $28,330 | 91 | 4.99/5.0 |
| Pascal | 3 | $27,789 | 164 | 4.89/5.0 |
| Host #477111576 | 3 | $25,367 | 193 | 4.76/5.0 |
Analyzing the strategies of top hosts, such as their property selection, pricing, and guest communication, can offer valuable lessons for optimizing your own Airbnb operations in Montbéliard.
Dive Deeper: Advanced Montbéliard STR Market Data (2025)
Ready to unlock more insights? AirROI provides access to advanced metrics and comprehensive Airbnb data for Montbéliard. Explore detailed analytics beyond this report to refine your investment strategy, optimize pricing, and maximize your vacation rental profits.
Explore Advanced MetricsMontbéliard Short-Term Rental Market Composition (2025): Property & Room Types
Room Type Distribution
Property Type Distribution
Market Composition Insights for Montbéliard
- The Montbéliard Airbnb market composition is heavily skewed towards Entire Home/Apt listings, which make up 87.8% of the 148 active rentals. This indicates strong guest preference for privacy and space.
- Looking at the property type distribution in Montbéliard, Apartment/Condo properties are the most common (89.2%), reflecting the local real estate landscape.
- Smaller segments like hotel/boutique, outdoor/unique (combined 2.1%) offer potential for unique stay experiences.
Montbéliard Airbnb Room Capacity Analysis (2025): Bedroom Distribution
Distribution of Listings by Number of Bedrooms
Room Capacity Insights for Montbéliard
- The dominant room capacity in Montbéliard is 1 bedroom listings, making up 62.2% of the market. This suggests a strong demand for properties suitable for couples or solo travelers.
- Together, 1 bedroom and 2 bedrooms properties represent 81.1% of the active Airbnb listings in Montbéliard, indicating a high concentration in these sizes.
- With over half the market (62.2%) consisting of studios or 1-bedroom units, Montbéliard is particularly well-suited for individuals or couples.
- Listings with 3+ bedrooms (4.8%) represent a smaller niche, potentially indicating an underserved market for larger group accommodations in Montbéliard.
Montbéliard Vacation Rental Guest Capacity Trends (2025)
Distribution of Listings by Guest Capacity
Guest Capacity Insights for Montbéliard
- The most common guest capacity trend in Montbéliard vacation rentals is listings accommodating 2 guests (41.2%). This suggests the primary traveler segment is likely couples or solo travelers.
- Properties designed for 2 guests and 4 guests dominate the Montbéliard STR market, accounting for 68.9% of listings.
- A significant 45.9% of listings cater specifically to 1-2 guests, highlighting strong demand from couples and solo travelers in Montbéliard.
- On average, properties in Montbéliard are equipped to host 3.0 guests.
Montbéliard Airbnb Booking Patterns (2025): Available vs. Booked Days
Available Days Distribution
Booked Days Distribution
Booking Pattern Insights for Montbéliard
- The most common availability pattern in Montbéliard falls within the 271-366 days range, representing 42.6% of listings. This suggests many properties have significant open periods on their calendars.
- Approximately 79.1% of listings show high availability (181+ days open annually), indicating potential for increased bookings or specific owner usage patterns.
- For booked days, the 91-180 days range is most frequent in Montbéliard (39.9%), reflecting common guest stay durations or potential owner blocking patterns.
- A notable 21.6% of properties secure long booking periods (181+ days booked per year), highlighting successful long-term rental strategies or significant owner usage.
Montbéliard Airbnb Minimum Stay Requirements Analysis
Distribution of Listings by Minimum Night Requirement
1 Night
51 listings
40.2% of total
2 Nights
37 listings
29.1% of total
3 Nights
7 listings
5.5% of total
4-6 Nights
7 listings
5.5% of total
7-29 Nights
10 listings
7.9% of total
30+ Nights
15 listings
11.8% of total
Key Insights
- The most prevalent minimum stay requirement in Montbéliard is 1 Night, adopted by 40.2% of listings. This highlights the market's preference for shorter, flexible bookings.
- A strong majority (69.3%) of the Montbéliard Airbnb data shows acceptance of very short stays (1-2 nights), indicating a dynamic, high-turnover market.
- A significant segment (11.8%) caters to monthly stays (30+ nights) in Montbéliard, pointing to opportunities in the extended-stay market.
Recommendations
- Align with the market by considering a 1 Night minimum stay, as 40.2% of Montbéliard hosts use this setting.
- Explore offering discounts for stays of 30+ nights to attract the 11.8% of the market seeking extended stays.
- Adjust minimum nights based on seasonality – potentially shorter during low season and longer during peak demand periods in Montbéliard.
Montbéliard Airbnb Cancellation Policy Trends Analysis (2025)
Flexible
37 listings
32.7% of total
Moderate
48 listings
42.5% of total
Firm
18 listings
15.9% of total
Strict
10 listings
8.8% of total
Cancellation Policy Insights for Montbéliard
- The prevailing Airbnb cancellation policy trend in Montbéliard is Moderate, used by 42.5% of listings.
- The market strongly favors guest-friendly terms, with 75.2% of listings offering Flexible or Moderate policies. This suggests guests in Montbéliard may expect booking flexibility.
- Strict cancellation policies are quite rare (8.8%), potentially making listings with this policy less competitive unless justified by high demand or property type.
Recommendations for Hosts
- Consider adopting a Moderate policy to align with the 42.5% market standard in Montbéliard.
- Using a Strict policy might deter some guests, as only 8.8% of listings use it. Evaluate if potential revenue protection outweighs possible lower booking rates.
- Regularly review your cancellation policy against competitors and market demand shifts in Montbéliard.
Montbéliard STR Booking Lead Time Analysis (2025)
Average Booking Lead Time by Month
Booking Lead Time Insights for Montbéliard
- The overall average booking lead time for vacation rentals in Montbéliard is 32 days.
- Guests book furthest in advance for stays during November (average 47 days), likely coinciding with peak travel demand or local events.
- The shortest booking windows occur for stays in February (average 14 days), indicating more last-minute travel plans during this time.
- Seasonally, Fall (35 days avg.) sees the longest lead times, while Spring (27 days avg.) has the shortest, reflecting typical travel planning cycles.
Recommendations for Hosts
- Use the overall average lead time (32 days) as a baseline for your pricing and availability strategy in Montbéliard.
- For November stays, consider implementing length-of-stay discounts or slightly higher rates for bookings made less than 47 days out to capitalize on advance planning.
- During February, focus on last-minute booking availability and promotions, as guests book with very short notice (14 days avg.).
- Target marketing efforts for the Fall season well in advance (at least 35 days) to capture early planners.
- Monitor your own booking lead times against these Montbéliard averages to identify opportunities for dynamic pricing adjustments.
Popular & Essential Airbnb Amenities in Montbéliard (2025)
Amenity Prevalence
Amenity Insights for Montbéliard
- Essential amenities in Montbéliard that guests expect include: Heating, Wifi, Kitchen. Lacking these (any) could significantly impact bookings.
- Popular amenities like TV, Smoke alarm, Hot water are common but not universal. Offering these can provide a competitive edge.
Recommendations for Hosts
- Ensure your listing includes all essential amenities for Montbéliard: Heating, Wifi, Kitchen.
- Prioritize adding missing essentials: Heating, Wifi, Kitchen.
- Consider adding popular differentiators like TV or Smoke alarm to increase appeal.
- Highlight unique or less common amenities you offer (e.g., hot tub, dedicated workspace, EV charger) in your listing description and photos.
- Regularly check competitor amenities in Montbéliard to stay competitive.
Montbéliard Airbnb Guest Demographics & Profile Analysis (2025)
Guest Profile Summary for Montbéliard
- The typical guest profile for Airbnb in Montbéliard consists of primarily domestic travelers (74%), often arriving from nearby Paris, typically belonging to the Post-2000s (Gen Z/Alpha) group (50%), primarily speaking French or English.
- Domestic travelers account for 73.9% of guests.
- Key international markets include France (73.9%) and Germany (7.2%).
- Top languages spoken are French (38.4%) followed by English (30.2%).
- A significant demographic segment is the Post-2000s (Gen Z/Alpha) group, representing 50% of guests.
Recommendations for Hosts
- Target domestic marketing efforts towards travelers from Paris and Besançon.
- Tailor amenities and listing descriptions to appeal to the dominant Post-2000s (Gen Z/Alpha) demographic (e.g., highlight fast WiFi, smart home features, local guides).
- Highlight unique local experiences or amenities relevant to the primary guest profile.
- Consider seasonal promotions aligned with peak travel times for key origin markets.
Nearby Short-Term Rental Market Comparison
How does the Montbéliard Airbnb market stack up against its neighbors? Compare key performance metrics like average monthly revenue, ADR, and occupancy rates in surrounding areas to understand the broader regional STR landscape.
| Market | Active Properties | Monthly Revenue | Daily Rate | Avg. Occupancy |
|---|---|---|---|---|
| Lauterbrunnen | 525 | $7,079 | $546.45 | 54% |
| La Rivière-Enverse | 17 | $5,972 | $624.02 | 41% |
| Matten bei Interlaken | 52 | $5,674 | $316.63 | 63% |
| Iseltwald | 14 | $5,491 | $331.95 | 58% |
| Habkern | 13 | $5,382 | $344.74 | 50% |
| Interlaken | 288 | $4,987 | $310.52 | 56% |
| Zermatt | 734 | $4,604 | $463.00 | 46% |
| Oberhofen am Thunersee | 24 | $4,572 | $265.94 | 55% |
| Sigriswil | 99 | $4,371 | $271.90 | 58% |
| Bönigen | 32 | $4,321 | $253.84 | 64% |