Levernois Airbnb Market Analysis 2025: Short Term Rental Data & Vacation Rental Statistics in Bourgogne – Franche-Comté, France
Is Airbnb profitable in Levernois in 2025? Explore comprehensive Airbnb analytics for Levernois, Bourgogne – Franche-Comté, France to uncover income potential. This 2025 STR market report for Levernois, based on AirROI data from April 2024 to March 2025, reveals key trends in the niche market of 18 active listings.
Whether you're considering an Airbnb investment in Levernois, optimizing your existing vacation rental, or exploring rental arbitrage opportunities, understanding the Levernois Airbnb data is crucial. Leveraging the low regulation environment is key to maximizing your short term rental income potential. Let's dive into the specifics.
Key Levernois Airbnb Performance Metrics Overview
Monthly Airbnb Revenue Variations & Income Potential in Levernois (2025)
Understanding the monthly revenue variations for Airbnb listings in Levernois is key to maximizing your short term rental income potential. Seasonality significantly impacts earnings. Our analysis, based on data from the past 12 months, shows that the peak revenue month for STRs in Levernois is typically May, while March often presents the lowest earnings, highlighting opportunities for strategic pricing adjustments during shoulder and low seasons. Explore the typical Airbnb income in Levernois across different performance tiers:
- Best-in-class properties (Top 10%) achieve $4,523+ monthly, often utilizing dynamic pricing and superior guest experiences.
- Strong performing properties (Top 25%) earn $2,967 or more, indicating effective management and desirable locations/amenities.
- Typical properties (Median) generate around $1,670 per month, representing the average market performance.
- Entry-level properties (Bottom 25%) see earnings around $670, often with potential for optimization.
Average Monthly Airbnb Earnings Trend in Levernois
Levernois Airbnb Occupancy Rate Trends (2025)
Maximize your bookings by understanding the Levernois STR occupancy trends. Seasonal demand shifts significantly influence how often properties are booked. Typically, Augustsees the highest demand (peak season occupancy), while March experiences the lowest (low season). Effective strategies, like adjusting minimum stays or offering promotions, can boost occupancy during slower periods. Here's how different property tiers perform in Levernois:
- Best-in-class properties (Top 10%) achieve 60%+ occupancy, indicating high desirability and potentially optimized availability.
- Strong performing properties (Top 25%) maintain 43% or higher occupancy, suggesting good market fit and guest satisfaction.
- Typical properties (Median) have an occupancy rate around 22%.
- Entry-level properties (Bottom 25%) average 12% occupancy, potentially facing higher vacancy.
Average Monthly Occupancy Rate Trend in Levernois
Average Daily Rate (ADR) Airbnb Trends in Levernois (2025)
Effective short term rental pricing strategy in Levernois involves understanding monthly ADR fluctuations. The Average Daily Rate (ADR) for Airbnb in Levernois typically peaks in November and dips lowest during June. Leveraging Airbnb dynamic pricing tools or strategies based on this seasonality can significantly boost revenue. Here's a look at the typical nightly rates achieved:
- Best-in-class properties (Top 10%) command rates of $293+ per night, often due to premium features or locations.
- Strong performing properties (Top 25%) achieve nightly rates of $220 or more.
- Typical properties (Median) charge around $141 per night.
- Entry-level properties (Bottom 25%) earn around $116 per night.
Average Daily Rate (ADR) Trend by Month in Levernois
Get Live Levernois Market Intelligence 👇

Explore Real-time Analytics
Airbnb Seasonality Analysis & Trends in Levernois (2025)
Peak Season (May, July, August)
- Revenue averages $2,922 per month
- Occupancy rates average 39.6%
- Daily rates average $165
Shoulder Season
- Revenue averages $2,240 per month
- Occupancy maintains around 29.2%
- Daily rates hold near $169
Low Season (January, February, March)
- Revenue drops to average $964 per month
- Occupancy decreases to average 19.3%
- Daily rates adjust to average $172
Seasonality Insights for Levernois
- The Airbnb seasonality in Levernois shows highly seasonal trends requiring careful strategy. While the sections above show seasonal averages, it's also insightful to look at the extremes:
- During the high season, the absolute peak month showcases Levernois's highest earning potential, with monthly revenues capable of climbing to $3,053, occupancy reaching a high of 47.0%, and ADRs peaking at $193.
- Conversely, the slowest single month of the year, typically falling within the low season, marks the market's lowest point. In this month, revenue might dip to $553, occupancy could drop to 12.9%, and ADRs may adjust down to $158.
- Understanding both the seasonal averages and these monthly peaks and troughs in revenue, occupancy, and ADR is crucial for maximizing your Airbnb profit potential in Levernois.
Seasonal Strategies for Maximizing Profit
- Peak Season: Maximize revenue through premium pricing and potentially longer minimum stays. Ensure high availability.
- Low Season: Offer competitive pricing, special promotions (e.g., extended stay discounts), and flexible cancellation policies. Target off-season travelers like remote workers or budget-conscious guests.
- Shoulder Seasons: Implement dynamic pricing that balances peak and low rates. Target weekend travelers or specific events. Offer slightly more flexible terms than peak season.
- Regularly analyze your own performance against these Levernois seasonality benchmarks and adjust your pricing and availability strategy accordingly.
Best Areas for Airbnb Investment in Levernois (2025)
Exploring the top neighborhoods for short-term rentals in Levernois? This section highlights key areas, outlining why they are attractive for hosts and guests, along with notable local attractions. Consider these locations based on your target guest profile and investment strategy.
| Neighborhood / Area | Why Host Here? (Target Guests & Appeal) | Key Attractions & Landmarks |
|---|---|---|
| Levernois Village | A charming village close to Beaune, known for its picturesque landscapes and wine culture. Ideal for tourists exploring the Burgundy wine route and looking for a quaint countryside experience. | Basilica of Saint Mary Magdalen, Beaune Wine Museum, Les Hospices de Beaune, Parc de la Bouzaise, Caves Patriarche |
| Beaune | As the wine capital of Burgundy, Beaune attracts numerous visitors for its historical architecture and vineyards. A hotspot for wine enthusiasts and culture seekers alike, ensuring consistent tourist flow. | Hôtel-Dieu, Beaune Market, Cirque du Soleil, Côte de Beaune wine region, Wine tasting tours |
| Chalon-sur-Saône | A nearby city with a rich history and cultural offerings, providing access to historical sites and events. Its location along the Saône River provides beautiful views and outdoor activities. | Chalon Cathedral, Musée Nicéphore-Niépce, Saône River Promenade, annual theatre festival |
| Côte d'Or Region | Famous for its vineyards and stunning landscapes, attracting visitors for wine tours and outdoor activities. Perfect for nature lovers and those interested in authentic French culture. | Burgundy wine routes, Vézelay, Rully Chateau, Chagny, natural parks |
| Nuits-Saint-Georges | A renowned wine-producing area, drawing both wine lovers and tourists eager to explore the vineyards and wine cellars, making it a favorite spot for short-term rentals. | Nuits-Saint-Georges vineyards, Château du Clos de Vougeot, local wine festivals, hiking trails |
| Savigny-lès-Beaune | Known for its wine estates and proximity to Beaune, this village offers visitors a more quiet escape while still being close to local attractions and events. | local vineyards, Savigny-lès-Beaune castle, wine tasting experiences |
| Montagny-lès-Beaune | A small, peaceful village well-suited for those looking to unwind. Its location near Beaune makes it a desirable spot for visitors looking for a tranquil retreat with quick access to the attractions. | lovely countryside walks, historic buildings, wine tasting events |
| Meursault | Famous for its white wines, Meursault attracts wine enthusiasts and tourists enjoying the beautiful vineyards and charming village, making it a prime location for Airbnb hosting. | Meursault vineyards, wine tasting tours, historic estate visits |
Understanding Airbnb License Requirements & STR Laws in Levernois (2025)
While Levernois, Bourgogne – Franche-Comté, France currently shows low STR regulations, specific Airbnb license requirements might still exist or change. Always verify the latest short term rental regulations and Airbnb license requirements directly with local government authorities for Levernois to ensure full compliance before hosting.
(Source: AirROI data, 2025, based on 6% licensed listings)
Top Performing Airbnb Properties in Levernois (2025)
Benchmark your potential! Explore examples of top-performing Airbnb properties in Levernoisbased on Trailing Twelve Month (TTM) revenue. Analyze their characteristics, revenue, occupancy rate, and ADR to understand what drives success in this market.
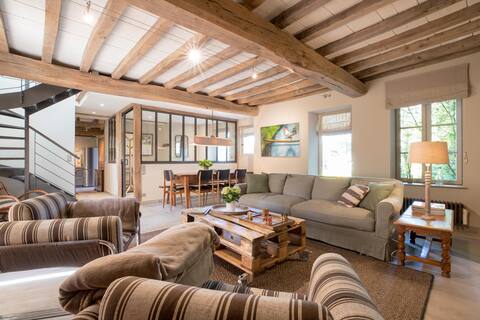
Le Clos du Verger Rated 5 stars, 5 stars
Entire Place • 2 bedrooms
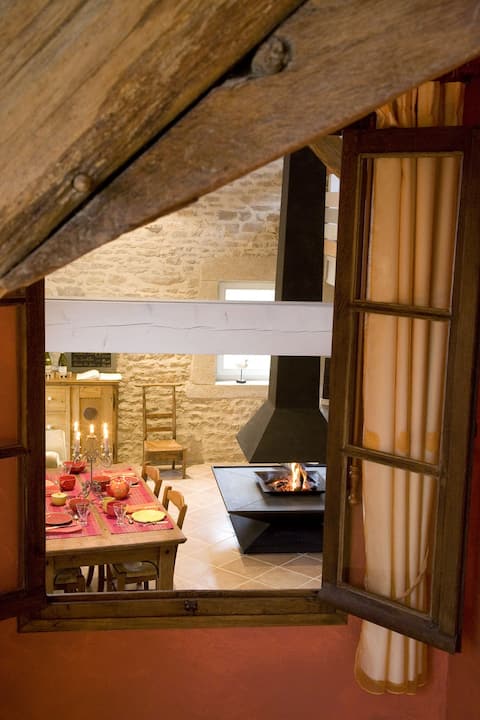
Charming house prox Beaune, 6 people, pool
Entire Place • 3 bedrooms
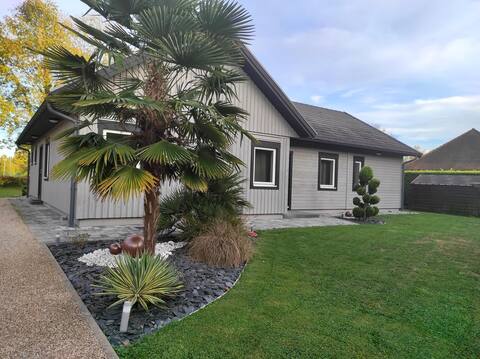
L'Escale au fil de l 'Eau
Entire Place • 3 bedrooms

Gîte 6 personnes Casse Noisette
Entire Place • 3 bedrooms
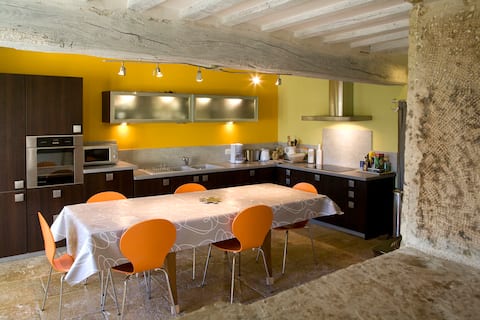
Charming cottage, 8 people + 1 bb Levernois/Beaune 150m2
Entire Place • 3 bedrooms

Jack-Résidence-Piscine-Sauna's Home
Entire Place • 1 bedroom
Note: Performance varies based on location, size, amenities, seasonality, and management quality. Data reflects the past 12 months.
Top Performing Airbnb Hosts in Levernois (2025)
Learn from the best! This table showcases top-performing Airbnb hosts in Levernois based on the number of properties managed and estimated total revenue over the past year. Analyze their scale and performance metrics.
| Host Name | Properties | Grossing Revenue | Stay Reviews | Avg Rating |
|---|---|---|---|---|
| Catherine | 2 | $77,956 | 145 | 4.86/5.0 |
| Sidorski | 1 | $67,165 | 41 | 4.93/5.0 |
| Delphine | 3 | $52,043 | 46 | 4.99/5.0 |
| Valentine | 2 | $45,251 | 21 | 4.51/5.0 |
| Elo'Théo | 1 | $45,147 | 39 | 5.00/5.0 |
| Conciergerie Beaunoise | 3 | $27,005 | 10 | 2.83/5.0 |
| Host #35208589 | 1 | $21,779 | 51 | 4.78/5.0 |
| Manuel | 1 | $17,806 | 11 | 4.73/5.0 |
| AndrÉ | 1 | $8,666 | 4 | 5.00/5.0 |
| Agnès | 2 | $8,622 | 28 | 3.93/5.0 |
Analyzing the strategies of top hosts, such as their property selection, pricing, and guest communication, can offer valuable lessons for optimizing your own Airbnb operations in Levernois.
Dive Deeper: Advanced Levernois STR Market Data (2025)
Ready to unlock more insights? AirROI provides access to advanced metrics and comprehensive Airbnb data for Levernois. Explore detailed analytics beyond this report to refine your investment strategy, optimize pricing, and maximize your vacation rental profits.
Explore Advanced MetricsLevernois Short-Term Rental Market Composition (2025): Property & Room Types
Room Type Distribution
Property Type Distribution
Market Composition Insights for Levernois
- The Levernois Airbnb market composition is heavily skewed towards Entire Home/Apt listings, which make up 94.4% of the 18 active rentals. This indicates strong guest preference for privacy and space.
- Looking at the property type distribution in Levernois, Apartment/Condo properties are the most common (55.6%), reflecting the local real estate landscape.
- Houses represent a significant 33.3% portion, catering likely to families or larger groups.
- The presence of 5.6% Hotel/Boutique listings indicates integration with traditional hospitality.
Levernois Airbnb Room Capacity Analysis (2025): Bedroom Distribution
Distribution of Listings by Number of Bedrooms
Room Capacity Insights for Levernois
- The dominant room capacity in Levernois is 1 bedroom listings, making up 38.9% of the market. This suggests a strong demand for properties suitable for couples or solo travelers.
- Together, 1 bedroom and 3 bedrooms properties represent 72.2% of the active Airbnb listings in Levernois, indicating a high concentration in these sizes.
- A significant 33.3% of listings offer 3+ bedrooms, catering to larger groups and families seeking more space in Levernois.
Levernois Vacation Rental Guest Capacity Trends (2025)
Distribution of Listings by Guest Capacity
Guest Capacity Insights for Levernois
- The most common guest capacity trend in Levernois vacation rentals is listings accommodating 4 guests (38.9%). This suggests the primary traveler segment is likely small families or groups.
- Properties designed for 4 guests and 6 guests dominate the Levernois STR market, accounting for 72.2% of listings.
- 38.9% of properties accommodate 6+ guests, serving the market segment for larger families or group travel in Levernois.
- On average, properties in Levernois are equipped to host 4.8 guests.
Levernois Airbnb Booking Patterns (2025): Available vs. Booked Days
Available Days Distribution
Booked Days Distribution
Booking Pattern Insights for Levernois
- The most common availability pattern in Levernois falls within the 271-366 days range, representing 55.6% of listings. This suggests many properties have significant open periods on their calendars.
- Approximately 94.5% of listings show high availability (181+ days open annually), indicating potential for increased bookings or specific owner usage patterns.
- For booked days, the 31-90 days range is most frequent in Levernois (44.4%), reflecting common guest stay durations or potential owner blocking patterns.
- A notable 5.6% of properties secure long booking periods (181+ days booked per year), highlighting successful long-term rental strategies or significant owner usage.
Levernois Airbnb Minimum Stay Requirements Analysis
Distribution of Listings by Minimum Night Requirement
1 Night
5 listings
31.3% of total
2 Nights
3 listings
18.8% of total
3 Nights
1 listings
6.3% of total
30+ Nights
7 listings
43.8% of total
Key Insights
- The most prevalent minimum stay requirement in Levernois is 30+ Nights, adopted by 43.8% of listings. This highlights the market's preference for longer commitments.
- A significant segment (43.8%) caters to monthly stays (30+ nights) in Levernois, pointing to opportunities in the extended-stay market.
Recommendations
- Align with the market by considering a 30+ Nights minimum stay, as 43.8% of Levernois hosts use this setting.
- Explore offering discounts for stays of 30+ nights to attract the 43.8% of the market seeking extended stays.
- Adjust minimum nights based on seasonality – potentially shorter during low season and longer during peak demand periods in Levernois.
Levernois Airbnb Cancellation Policy Trends Analysis (2025)
Non-refundable
2 listings
12.5% of total
Flexible
3 listings
18.8% of total
Moderate
6 listings
37.5% of total
Firm
4 listings
25% of total
Strict
1 listings
6.3% of total
Cancellation Policy Insights for Levernois
- The prevailing Airbnb cancellation policy trend in Levernois is Moderate, used by 37.5% of listings.
- There's a relatively balanced mix between guest-friendly (56.3%) and stricter (31.3%) policies, offering choices for different guest needs.
- Strict cancellation policies are quite rare (6.3%), potentially making listings with this policy less competitive unless justified by high demand or property type.
Recommendations for Hosts
- Consider adopting a Moderate policy to align with the 37.5% market standard in Levernois.
- Using a Strict policy might deter some guests, as only 6.3% of listings use it. Evaluate if potential revenue protection outweighs possible lower booking rates.
- Regularly review your cancellation policy against competitors and market demand shifts in Levernois.
Levernois STR Booking Lead Time Analysis (2025)
Average Booking Lead Time by Month
Booking Lead Time Insights for Levernois
- The overall average booking lead time for vacation rentals in Levernois is 44 days.
- Guests book furthest in advance for stays during May (average 111 days), likely coinciding with peak travel demand or local events.
- The shortest booking windows occur for stays in January (average 33 days), indicating more last-minute travel plans during this time.
- Seasonally, Summer (70 days avg.) sees the longest lead times, while Winter (43 days avg.) has the shortest, reflecting typical travel planning cycles.
Recommendations for Hosts
- Use the overall average lead time (44 days) as a baseline for your pricing and availability strategy in Levernois.
- For May stays, consider implementing length-of-stay discounts or slightly higher rates for bookings made less than 111 days out to capitalize on advance planning.
- Target marketing efforts for the Summer season well in advance (at least 70 days) to capture early planners.
- Monitor your own booking lead times against these Levernois averages to identify opportunities for dynamic pricing adjustments.
Popular & Essential Airbnb Amenities in Levernois (2025)
Amenity Prevalence
Amenity Insights for Levernois
- Essential amenities in Levernois that guests expect include: TV. Lacking these (this) could significantly impact bookings.
- Popular amenities like Free parking on premises, Kitchen, Wifi are common but not universal. Offering these can provide a competitive edge.
- Warning: Wifi is not universally provided but is considered essential globally. Ensure reliable Wifi is offered.
Recommendations for Hosts
- Ensure your listing includes all essential amenities for Levernois: TV.
- Consider adding popular differentiators like Free parking on premises or Kitchen to increase appeal.
- Highlight unique or less common amenities you offer (e.g., hot tub, dedicated workspace, EV charger) in your listing description and photos.
- Regularly check competitor amenities in Levernois to stay competitive.
Levernois Airbnb Guest Demographics & Profile Analysis (2025)
Guest Profile Summary for Levernois
- The typical guest profile for Airbnb in Levernois consists of a mix of domestic (63%) and international guests, often arriving from nearby Paris, typically belonging to the Post-2000s (Gen Z/Alpha) group (50%), primarily speaking English or French.
- Domestic travelers account for 63.3% of guests.
- Key international markets include France (63.3%) and Netherlands (7.1%).
- Top languages spoken are English (39.7%) followed by French (31%).
- A significant demographic segment is the Post-2000s (Gen Z/Alpha) group, representing 50% of guests.
Recommendations for Hosts
- Target domestic marketing efforts towards travelers from Paris and Lyon.
- Tailor amenities and listing descriptions to appeal to the dominant Post-2000s (Gen Z/Alpha) demographic (e.g., highlight fast WiFi, smart home features, local guides).
- Highlight unique local experiences or amenities relevant to the primary guest profile.
- Consider seasonal promotions aligned with peak travel times for key origin markets.
Nearby Short-Term Rental Market Comparison
How does the Levernois Airbnb market stack up against its neighbors? Compare key performance metrics like average monthly revenue, ADR, and occupancy rates in surrounding areas to understand the broader regional STR landscape.
| Market | Active Properties | Monthly Revenue | Daily Rate | Avg. Occupancy |
|---|---|---|---|---|
| Épinac | 14 | $5,147 | $333.01 | 37% |
| Saint-Germain-au-Mont-d'Or | 10 | $3,928 | $316.02 | 40% |
| Puligny-Montrachet | 11 | $3,908 | $398.00 | 44% |
| Dommartin | 11 | $3,905 | $327.00 | 36% |
| Juliénas | 11 | $3,378 | $292.32 | 46% |
| Corgoloin | 10 | $3,314 | $296.49 | 44% |
| Courzieu | 11 | $3,267 | $287.83 | 52% |
| Vanosc | 13 | $3,072 | $224.52 | 44% |
| Bligny-lès-Beaune | 24 | $2,930 | $233.89 | 44% |
| Romanèche-Thorins | 13 | $2,817 | $239.98 | 43% |