Hauts de Bienne Airbnb Market Analysis 2025: Short Term Rental Data & Vacation Rental Statistics in Bourgogne – Franche-Comté, France
Is Airbnb profitable in Hauts de Bienne in 2025? Explore comprehensive Airbnb analytics for Hauts de Bienne, Bourgogne – Franche-Comté, France to uncover income potential. This 2025 STR market report for Hauts de Bienne, based on AirROI data from April 2024 to March 2025, reveals key trends in the niche market of 41 active listings.
Whether you're considering an Airbnb investment in Hauts de Bienne, optimizing your existing vacation rental, or exploring rental arbitrage opportunities, understanding the Hauts de Bienne Airbnb data is crucial. Leveraging the low regulation environment is key to maximizing your short term rental income potential. Let's dive into the specifics.
Key Hauts de Bienne Airbnb Performance Metrics Overview
Monthly Airbnb Revenue Variations & Income Potential in Hauts de Bienne (2025)
Understanding the monthly revenue variations for Airbnb listings in Hauts de Bienne is key to maximizing your short term rental income potential. Seasonality significantly impacts earnings. Our analysis, based on data from the past 12 months, shows that the peak revenue month for STRs in Hauts de Bienne is typically August, while October often presents the lowest earnings, highlighting opportunities for strategic pricing adjustments during shoulder and low seasons. Explore the typical Airbnb income in Hauts de Bienne across different performance tiers:
- Best-in-class properties (Top 10%) achieve $2,282+ monthly, often utilizing dynamic pricing and superior guest experiences.
- Strong performing properties (Top 25%) earn $1,767 or more, indicating effective management and desirable locations/amenities.
- Typical properties (Median) generate around $1,251 per month, representing the average market performance.
- Entry-level properties (Bottom 25%) see earnings around $819, often with potential for optimization.
Average Monthly Airbnb Earnings Trend in Hauts de Bienne
Hauts de Bienne Airbnb Occupancy Rate Trends (2025)
Maximize your bookings by understanding the Hauts de Bienne STR occupancy trends. Seasonal demand shifts significantly influence how often properties are booked. Typically, Augustsees the highest demand (peak season occupancy), while April experiences the lowest (low season). Effective strategies, like adjusting minimum stays or offering promotions, can boost occupancy during slower periods. Here's how different property tiers perform in Hauts de Bienne:
- Best-in-class properties (Top 10%) achieve 78%+ occupancy, indicating high desirability and potentially optimized availability.
- Strong performing properties (Top 25%) maintain 63% or higher occupancy, suggesting good market fit and guest satisfaction.
- Typical properties (Median) have an occupancy rate around 46%.
- Entry-level properties (Bottom 25%) average 30% occupancy, potentially facing higher vacancy.
Average Monthly Occupancy Rate Trend in Hauts de Bienne
Average Daily Rate (ADR) Airbnb Trends in Hauts de Bienne (2025)
Effective short term rental pricing strategy in Hauts de Bienne involves understanding monthly ADR fluctuations. The Average Daily Rate (ADR) for Airbnb in Hauts de Bienne typically peaks in July and dips lowest during March. Leveraging Airbnb dynamic pricing tools or strategies based on this seasonality can significantly boost revenue. Here's a look at the typical nightly rates achieved:
- Best-in-class properties (Top 10%) command rates of $175+ per night, often due to premium features or locations.
- Strong performing properties (Top 25%) achieve nightly rates of $105 or more.
- Typical properties (Median) charge around $75 per night.
- Entry-level properties (Bottom 25%) earn around $63 per night.
Average Daily Rate (ADR) Trend by Month in Hauts de Bienne
Get Live Hauts de Bienne Market Intelligence 👇

Explore Real-time Analytics
Airbnb Seasonality Analysis & Trends in Hauts de Bienne (2025)
Peak Season (August, February, July)
- Revenue averages $1,812 per month
- Occupancy rates average 67.3%
- Daily rates average $102
Shoulder Season
- Revenue averages $1,390 per month
- Occupancy maintains around 40.2%
- Daily rates hold near $100
Low Season (March, September, October)
- Revenue drops to average $994 per month
- Occupancy decreases to average 40.5%
- Daily rates adjust to average $98
Seasonality Insights for Hauts de Bienne
- The Airbnb seasonality in Hauts de Bienne shows highly seasonal trends requiring careful strategy. While the sections above show seasonal averages, it's also insightful to look at the extremes:
- During the high season, the absolute peak month showcases Hauts de Bienne's highest earning potential, with monthly revenues capable of climbing to $1,946, occupancy reaching a high of 69.5%, and ADRs peaking at $102.
- Conversely, the slowest single month of the year, typically falling within the low season, marks the market's lowest point. In this month, revenue might dip to $968, occupancy could drop to 33.8%, and ADRs may adjust down to $95.
- Understanding both the seasonal averages and these monthly peaks and troughs in revenue, occupancy, and ADR is crucial for maximizing your Airbnb profit potential in Hauts de Bienne.
Seasonal Strategies for Maximizing Profit
- Peak Season: Maximize revenue through premium pricing and potentially longer minimum stays. Ensure high availability.
- Low Season: Offer competitive pricing, special promotions (e.g., extended stay discounts), and flexible cancellation policies. Target off-season travelers like remote workers or budget-conscious guests.
- Shoulder Seasons: Implement dynamic pricing that balances peak and low rates. Target weekend travelers or specific events. Offer slightly more flexible terms than peak season.
- Regularly analyze your own performance against these Hauts de Bienne seasonality benchmarks and adjust your pricing and availability strategy accordingly.
Best Areas for Airbnb Investment in Hauts de Bienne (2025)
Exploring the top neighborhoods for short-term rentals in Hauts de Bienne? This section highlights key areas, outlining why they are attractive for hosts and guests, along with notable local attractions. Consider these locations based on your target guest profile and investment strategy.
| Neighborhood / Area | Why Host Here? (Target Guests & Appeal) | Key Attractions & Landmarks |
|---|---|---|
| Besançon | Historic city known for its ancient fortifications and vibrant cultural scene. It's a UNESCO World Heritage site that attracts tourists interested in history and architecture. | Vauban Citadel, Besançon Museum of Fine Arts, Museum of Time, Saint-Jean Cathedral, Belfry of Besançon |
| Dole | Charming town located along the Burgundian canal, with a rich history and beautiful architecture. It's known for its quaint streets and proximity to nature, making it appealing for short-term stays. | Dole's Old Town, Collégiale Notre-Dame de Dole, Jardin des Sens, Canal de Bourgogne, Birthplace of Louis Pasteur |
| Gray | Picturesque town on the Saône River with a relaxed atmosphere. Ideal for visitors looking to explore the countryside of Franche-Comté and enjoy regional cuisine. | Gray Castle, Saône River Bank, Musee Baron Martin, Eglise Saint-Étienne, Lac de la Tille |
| Montbéliard | Known for its rich industrial history and beautiful parks. The town attracts visitors interested in cultural experiences and events throughout the year. | Chateau de Montbéliard, Museum of the Castle of Montbéliard, Parc de la République, Eglise de la Madeleine, Historical center |
| Lons-le-Saunier | This spa town is famous for its thermal baths and beautiful Jura landscapes. It is a perfect destination for tourists seeking relaxation and wellness retreats. | Thermes de Lons-le-Saunier, Cascades du Herisson, La Maison de Lou Marques, Lons-le-Saunier Cathedral, Le Parc des Bains |
| Ornans | A stunning small town located in the Loue Valley, known for its artistic heritage and natural beauty. Attracts nature lovers and artists alike. | Musee Courbet, Grotte de Vaux, Loue Valley, Historical center of Ornans, Fishing and hiking activities |
| Salins-les-Bains | Famous for its salt mines and historical spa culture. Visitors come for wellness and to explore the unique history of salt production in the region. | Saline Royale, Thermal Baths, Caves of the Saltworks, Historic Salt Mines, Nature walks in the area |
| Saint-Claude | Nestled in the Jura Mountains, known for its stunning landscapes and outdoor activities. A hotspot for tourists seeking adventure and nature. | Saint-Claude Cathedral, Belt of the Jura, Musee de la Pipe et du Diamant, Hiking and skiing trails, Jura Mountains National Park |
Understanding Airbnb License Requirements & STR Laws in Hauts de Bienne (2025)
While Hauts de Bienne, Bourgogne – Franche-Comté, France currently shows low STR regulations, specific Airbnb license requirements might still exist or change. Always verify the latest short term rental regulations and Airbnb license requirements directly with local government authorities for Hauts de Bienne to ensure full compliance before hosting.
(Source: AirROI data, 2025, based on 5% licensed listings)
Top Performing Airbnb Properties in Hauts de Bienne (2025)
Benchmark your potential! Explore examples of top-performing Airbnb properties in Hauts de Biennebased on Trailing Twelve Month (TTM) revenue. Analyze their characteristics, revenue, occupancy rate, and ADR to understand what drives success in this market.

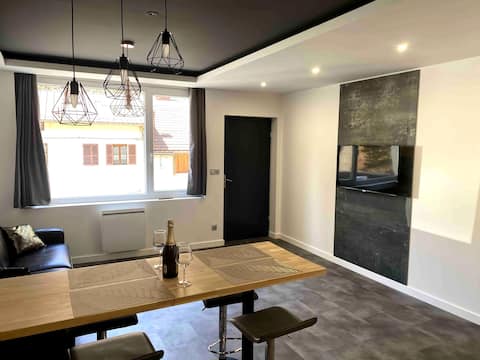
Large bright loft of 187 m2 with HOT TUB Haut Jura
Entire Place • 3 bedrooms
Cozy apartment with SPA and private sauna
Entire Place • 1 bedroom
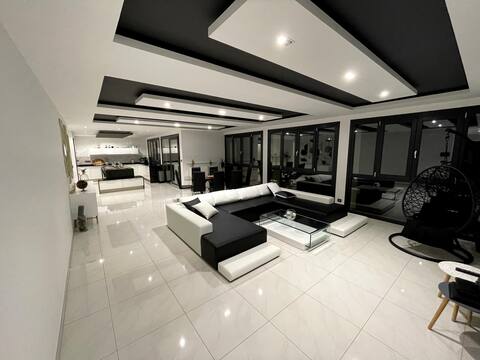
Luxury loft with Balneo SPA
Entire Place • 3 bedrooms
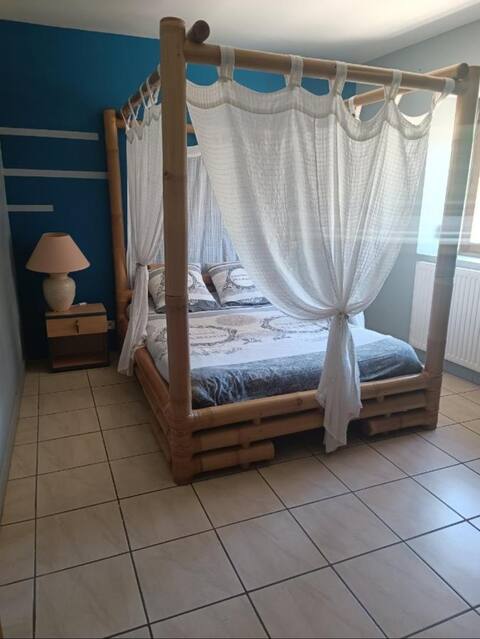
spacious, quiet apartment in the countryside
Entire Place • 3 bedrooms

T2 Centre Ville Morez
Entire Place • 1 bedroom

Beautiful apartment from 2 to 4 people of 35 m²
Entire Place • 1 bedroom
Note: Performance varies based on location, size, amenities, seasonality, and management quality. Data reflects the past 12 months.
Top Performing Airbnb Hosts in Hauts de Bienne (2025)
Learn from the best! This table showcases top-performing Airbnb hosts in Hauts de Bienne based on the number of properties managed and estimated total revenue over the past year. Analyze their scale and performance metrics.
| Host Name | Properties | Grossing Revenue | Stay Reviews | Avg Rating |
|---|---|---|---|---|
| Amaury | 3 | $75,524 | 283 | 4.87/5.0 |
| Brigitte | 1 | $38,381 | 57 | 4.93/5.0 |
| Vincent | 2 | $36,512 | 34 | 4.63/5.0 |
| Anthony | 2 | $36,298 | 98 | 4.76/5.0 |
| Adel | 3 | $28,096 | 476 | 4.64/5.0 |
| Alexis | 2 | $27,836 | 48 | 4.92/5.0 |
| Eric | 2 | $24,747 | 111 | 4.91/5.0 |
| Chloé | 1 | $22,937 | 10 | 4.90/5.0 |
| Logan | 2 | $19,290 | 278 | 4.59/5.0 |
| Didier | 1 | $19,159 | 30 | 5.00/5.0 |
Analyzing the strategies of top hosts, such as their property selection, pricing, and guest communication, can offer valuable lessons for optimizing your own Airbnb operations in Hauts de Bienne.
Dive Deeper: Advanced Hauts de Bienne STR Market Data (2025)
Ready to unlock more insights? AirROI provides access to advanced metrics and comprehensive Airbnb data for Hauts de Bienne. Explore detailed analytics beyond this report to refine your investment strategy, optimize pricing, and maximize your vacation rental profits.
Explore Advanced MetricsHauts de Bienne Short-Term Rental Market Composition (2025): Property & Room Types
Room Type Distribution
Property Type Distribution
Market Composition Insights for Hauts de Bienne
- The Hauts de Bienne Airbnb market composition is heavily skewed towards Entire Home/Apt listings, which make up 97.6% of the 41 active rentals. This indicates strong guest preference for privacy and space.
- Looking at the property type distribution in Hauts de Bienne, Apartment/Condo properties are the most common (82.9%), reflecting the local real estate landscape.
- Houses represent a significant 17.1% portion, catering likely to families or larger groups.
Hauts de Bienne Airbnb Room Capacity Analysis (2025): Bedroom Distribution
Distribution of Listings by Number of Bedrooms
Room Capacity Insights for Hauts de Bienne
- The dominant room capacity in Hauts de Bienne is 1 bedroom listings, making up 56.1% of the market. This suggests a strong demand for properties suitable for couples or solo travelers.
- Together, 1 bedroom and 2 bedrooms properties represent 78.1% of the active Airbnb listings in Hauts de Bienne, indicating a high concentration in these sizes.
- With over half the market (56.1%) consisting of studios or 1-bedroom units, Hauts de Bienne is particularly well-suited for individuals or couples.
Hauts de Bienne Vacation Rental Guest Capacity Trends (2025)
Distribution of Listings by Guest Capacity
Guest Capacity Insights for Hauts de Bienne
- The most common guest capacity trend in Hauts de Bienne vacation rentals is listings accommodating 4 guests (41.5%). This suggests the primary traveler segment is likely small families or groups.
- Properties designed for 4 guests and 2 guests dominate the Hauts de Bienne STR market, accounting for 63.5% of listings.
- 24.4% of properties accommodate 6+ guests, serving the market segment for larger families or group travel in Hauts de Bienne.
- On average, properties in Hauts de Bienne are equipped to host 4.4 guests.
Hauts de Bienne Airbnb Booking Patterns (2025): Available vs. Booked Days
Available Days Distribution
Booked Days Distribution
Booking Pattern Insights for Hauts de Bienne
- The most common availability pattern in Hauts de Bienne falls within the 181-270 days range, representing 36.6% of listings. This suggests many properties have significant open periods on their calendars.
- Approximately 63.4% of listings show high availability (181+ days open annually), indicating potential for increased bookings or specific owner usage patterns.
- For booked days, the 91-180 days range is most frequent in Hauts de Bienne (41.5%), reflecting common guest stay durations or potential owner blocking patterns.
- A notable 36.6% of properties secure long booking periods (181+ days booked per year), highlighting successful long-term rental strategies or significant owner usage.
Hauts de Bienne Airbnb Minimum Stay Requirements Analysis
Distribution of Listings by Minimum Night Requirement
1 Night
11 listings
30.6% of total
2 Nights
11 listings
30.6% of total
3 Nights
7 listings
19.4% of total
4-6 Nights
3 listings
8.3% of total
7-29 Nights
1 listings
2.8% of total
30+ Nights
3 listings
8.3% of total
Key Insights
- The most prevalent minimum stay requirement in Hauts de Bienne is 1 Night, adopted by 30.6% of listings. This highlights the market's preference for shorter, flexible bookings.
- A strong majority (61.2%) of the Hauts de Bienne Airbnb data shows acceptance of very short stays (1-2 nights), indicating a dynamic, high-turnover market.
Recommendations
- Align with the market by considering a 1 Night minimum stay, as 30.6% of Hauts de Bienne hosts use this setting.
- Explore offering discounts for stays of 30+ nights to attract the 8.3% of the market seeking extended stays.
- Adjust minimum nights based on seasonality – potentially shorter during low season and longer during peak demand periods in Hauts de Bienne.
Hauts de Bienne Airbnb Cancellation Policy Trends Analysis (2025)
Flexible
15 listings
38.5% of total
Moderate
14 listings
35.9% of total
Firm
3 listings
7.7% of total
Strict
7 listings
17.9% of total
Cancellation Policy Insights for Hauts de Bienne
- The prevailing Airbnb cancellation policy trend in Hauts de Bienne is Flexible, used by 38.5% of listings.
- The market strongly favors guest-friendly terms, with 74.4% of listings offering Flexible or Moderate policies. This suggests guests in Hauts de Bienne may expect booking flexibility.
Recommendations for Hosts
- Consider adopting a Flexible policy to align with the 38.5% market standard in Hauts de Bienne.
- Regularly review your cancellation policy against competitors and market demand shifts in Hauts de Bienne.
Hauts de Bienne STR Booking Lead Time Analysis (2025)
Average Booking Lead Time by Month
Booking Lead Time Insights for Hauts de Bienne
- The overall average booking lead time for vacation rentals in Hauts de Bienne is 33 days.
- Guests book furthest in advance for stays during July (average 74 days), likely coinciding with peak travel demand or local events.
- The shortest booking windows occur for stays in October (average 27 days), indicating more last-minute travel plans during this time.
- Seasonally, Summer (58 days avg.) sees the longest lead times, while Fall (30 days avg.) has the shortest, reflecting typical travel planning cycles.
Recommendations for Hosts
- Use the overall average lead time (33 days) as a baseline for your pricing and availability strategy in Hauts de Bienne.
- For July stays, consider implementing length-of-stay discounts or slightly higher rates for bookings made less than 74 days out to capitalize on advance planning.
- Target marketing efforts for the Summer season well in advance (at least 58 days) to capture early planners.
- Monitor your own booking lead times against these Hauts de Bienne averages to identify opportunities for dynamic pricing adjustments.
Popular & Essential Airbnb Amenities in Hauts de Bienne (2025)
Amenity Prevalence
Amenity Insights for Hauts de Bienne
- Essential amenities in Hauts de Bienne that guests expect include: Heating, Hot water, Kitchen, Smoke alarm, Refrigerator. Lacking these (any) could significantly impact bookings.
- Popular amenities like TV, Cooking basics, Dishes and silverware are common but not universal. Offering these can provide a competitive edge.
Recommendations for Hosts
- Ensure your listing includes all essential amenities for Hauts de Bienne: Heating, Hot water, Kitchen, Smoke alarm, Refrigerator.
- Prioritize adding missing essentials: Hot water, Kitchen, Smoke alarm, Refrigerator.
- Consider adding popular differentiators like TV or Cooking basics to increase appeal.
- Highlight unique or less common amenities you offer (e.g., hot tub, dedicated workspace, EV charger) in your listing description and photos.
- Regularly check competitor amenities in Hauts de Bienne to stay competitive.
Hauts de Bienne Airbnb Guest Demographics & Profile Analysis (2025)
Guest Profile Summary for Hauts de Bienne
- The typical guest profile for Airbnb in Hauts de Bienne consists of primarily domestic travelers (92%), often arriving from nearby Paris, typically belonging to the Post-2000s (Gen Z/Alpha) group (50%), primarily speaking French or English.
- Domestic travelers account for 91.7% of guests.
- Key international markets include France (91.7%) and Germany (2.3%).
- Top languages spoken are French (48.2%) followed by English (27.7%).
- A significant demographic segment is the Post-2000s (Gen Z/Alpha) group, representing 50% of guests.
Recommendations for Hosts
- Target domestic marketing efforts towards travelers from Paris and Lyon.
- Tailor amenities and listing descriptions to appeal to the dominant Post-2000s (Gen Z/Alpha) demographic (e.g., highlight fast WiFi, smart home features, local guides).
- Highlight unique local experiences or amenities relevant to the primary guest profile.
- Consider seasonal promotions aligned with peak travel times for key origin markets.
Nearby Short-Term Rental Market Comparison
How does the Hauts de Bienne Airbnb market stack up against its neighbors? Compare key performance metrics like average monthly revenue, ADR, and occupancy rates in surrounding areas to understand the broader regional STR landscape.
| Market | Active Properties | Monthly Revenue | Daily Rate | Avg. Occupancy |
|---|---|---|---|---|
| Lauterbrunnen | 525 | $7,079 | $546.45 | 54% |
| La Rivière-Enverse | 17 | $5,972 | $624.02 | 41% |
| Les Clefs | 30 | $5,741 | $323.11 | 44% |
| Matten bei Interlaken | 52 | $5,674 | $316.63 | 63% |
| Iseltwald | 14 | $5,491 | $331.95 | 58% |
| Habkern | 13 | $5,382 | $344.74 | 50% |
| Interlaken | 288 | $4,987 | $310.52 | 56% |
| Zermatt | 734 | $4,604 | $463.00 | 46% |
| Oberhofen am Thunersee | 24 | $4,572 | $265.94 | 55% |
| Sigriswil | 99 | $4,371 | $271.90 | 58% |