Chenôve Airbnb Market Analysis 2025: Short Term Rental Data & Vacation Rental Statistics in Bourgogne – Franche-Comté, France
Is Airbnb profitable in Chenôve in 2025? Explore comprehensive Airbnb analytics for Chenôve, Bourgogne – Franche-Comté, France to uncover income potential. This 2025 STR market report for Chenôve, based on AirROI data from April 2024 to March 2025, reveals key trends in the niche market of 37 active listings.
Whether you're considering an Airbnb investment in Chenôve, optimizing your existing vacation rental, or exploring rental arbitrage opportunities, understanding the Chenôve Airbnb data is crucial. Understanding the local regulations is key to maximizing your short term rental income potential. Let's dive into the specifics.
Key Chenôve Airbnb Performance Metrics Overview
Monthly Airbnb Revenue Variations & Income Potential in Chenôve (2025)
Understanding the monthly revenue variations for Airbnb listings in Chenôve is key to maximizing your short term rental income potential. Seasonality significantly impacts earnings. Our analysis, based on data from the past 12 months, shows that the peak revenue month for STRs in Chenôve is typically May, while March often presents the lowest earnings, highlighting opportunities for strategic pricing adjustments during shoulder and low seasons. Explore the typical Airbnb income in Chenôve across different performance tiers:
- Best-in-class properties (Top 10%) achieve $2,680+ monthly, often utilizing dynamic pricing and superior guest experiences.
- Strong performing properties (Top 25%) earn $1,538 or more, indicating effective management and desirable locations/amenities.
- Typical properties (Median) generate around $859 per month, representing the average market performance.
- Entry-level properties (Bottom 25%) see earnings around $404, often with potential for optimization.
Average Monthly Airbnb Earnings Trend in Chenôve
Chenôve Airbnb Occupancy Rate Trends (2025)
Maximize your bookings by understanding the Chenôve STR occupancy trends. Seasonal demand shifts significantly influence how often properties are booked. Typically, Augustsees the highest demand (peak season occupancy), while March experiences the lowest (low season). Effective strategies, like adjusting minimum stays or offering promotions, can boost occupancy during slower periods. Here's how different property tiers perform in Chenôve:
- Best-in-class properties (Top 10%) achieve 75%+ occupancy, indicating high desirability and potentially optimized availability.
- Strong performing properties (Top 25%) maintain 54% or higher occupancy, suggesting good market fit and guest satisfaction.
- Typical properties (Median) have an occupancy rate around 36%.
- Entry-level properties (Bottom 25%) average 21% occupancy, potentially facing higher vacancy.
Average Monthly Occupancy Rate Trend in Chenôve
Average Daily Rate (ADR) Airbnb Trends in Chenôve (2025)
Effective short term rental pricing strategy in Chenôve involves understanding monthly ADR fluctuations. The Average Daily Rate (ADR) for Airbnb in Chenôve typically peaks in December and dips lowest during March. Leveraging Airbnb dynamic pricing tools or strategies based on this seasonality can significantly boost revenue. Here's a look at the typical nightly rates achieved:
- Best-in-class properties (Top 10%) command rates of $192+ per night, often due to premium features or locations.
- Strong performing properties (Top 25%) achieve nightly rates of $115 or more.
- Typical properties (Median) charge around $65 per night.
- Entry-level properties (Bottom 25%) earn around $46 per night.
Average Daily Rate (ADR) Trend by Month in Chenôve
Get Live Chenôve Market Intelligence 👇

Explore Real-time Analytics
Airbnb Seasonality Analysis & Trends in Chenôve (2025)
Peak Season (May, June, April)
- Revenue averages $1,681 per month
- Occupancy rates average 37.2%
- Daily rates average $97
Shoulder Season
- Revenue averages $1,185 per month
- Occupancy maintains around 44.5%
- Daily rates hold near $99
Low Season (January, March, December)
- Revenue drops to average $794 per month
- Occupancy decreases to average 31.9%
- Daily rates adjust to average $100
Seasonality Insights for Chenôve
- The Airbnb seasonality in Chenôve shows highly seasonal trends requiring careful strategy. While the sections above show seasonal averages, it's also insightful to look at the extremes:
- During the high season, the absolute peak month showcases Chenôve's highest earning potential, with monthly revenues capable of climbing to $1,749, occupancy reaching a high of 48.3%, and ADRs peaking at $103.
- Conversely, the slowest single month of the year, typically falling within the low season, marks the market's lowest point. In this month, revenue might dip to $722, occupancy could drop to 28.0%, and ADRs may adjust down to $95.
- Understanding both the seasonal averages and these monthly peaks and troughs in revenue, occupancy, and ADR is crucial for maximizing your Airbnb profit potential in Chenôve.
Seasonal Strategies for Maximizing Profit
- Peak Season: Maximize revenue through premium pricing and potentially longer minimum stays. Ensure high availability.
- Low Season: Offer competitive pricing, special promotions (e.g., extended stay discounts), and flexible cancellation policies. Target off-season travelers like remote workers or budget-conscious guests.
- Shoulder Seasons: Implement dynamic pricing that balances peak and low rates. Target weekend travelers or specific events. Offer slightly more flexible terms than peak season.
- Regularly analyze your own performance against these Chenôve seasonality benchmarks and adjust your pricing and availability strategy accordingly.
Best Areas for Airbnb Investment in Chenôve (2025)
Exploring the top neighborhoods for short-term rentals in Chenôve? This section highlights key areas, outlining why they are attractive for hosts and guests, along with notable local attractions. Consider these locations based on your target guest profile and investment strategy.
| Neighborhood / Area | Why Host Here? (Target Guests & Appeal) | Key Attractions & Landmarks |
|---|---|---|
| Centre-ville de Chenôve | The vibrant town center that offers a mix of local shops, cafes, and restaurants. It serves as a hub for both locals and visitors, making it ideal for Airbnb hosting. | Place de la Mairie, Église Saint-Denis, Local shops and cafes, Parks and recreational areas |
| Vignes de Chenôve | Renowned for its wine-growing areas, this district attracts tourists interested in oenology and rural experiences. Perfect for hosting those looking to explore the Burgundy wine route. | Wine tasting tours, Château de Chenôve, Scenic vineyards, Local wine cellars |
| Parc de la Colombière | A beautiful park area where locals and tourists come to relax. It's great for outdoor lovers and families, making it a favorable Airbnb location for those seeking tranquility. | Colombière Park, Walking and biking paths, Playgrounds, Green spaces for picnics |
| Quartier des écoles | Nearby schools and educational institutions make this area appealing for families and educational travelers. Offers a practical location for longer stays. | Educational institutions, Family-friendly amenities, Local markets |
| Bourgogne Canal Path | A scenic pathway along the canal that attracts walking and cycling enthusiasts. Great for hosting nature lovers and those looking for outdoor activities. | Canal de Bourgogne, Biking and walking paths, Scenic views, Picnic spots |
| Les Granges | A residential area that offers a mix of local culture and activities. It’s ideal for those who want a more authentic experience of Chenôve away from the tourist spots. | Local events, Cultural experiences, Community life |
| Rue des Combottes | This street is known for its lively atmosphere and accessibility, making it a good choice for visitors looking for convenience and local flavor in their stay. | Local shops, Restaurants, Cultural spots |
| Éco-quartier de Chenôve | A sustainable neighborhood that attracts eco-conscious travelers. The innovative design and green spaces create a unique environment for those looking for modern accommodations. | Sustainable living demonstrations, Green spaces, Community gardens |
Understanding Airbnb License Requirements & STR Laws in Chenôve (2025)
With 11% of listings showing registration in 2025, understanding potential Airbnb license requirements is crucial in Chenôve. Always verify the latest short term rental regulations and Airbnb license requirements directly with local government authorities for Chenôve to ensure full compliance before hosting.
(Source: AirROI data, 2025, based on 11% licensed listings)
Top Performing Airbnb Properties in Chenôve (2025)
Benchmark your potential! Explore examples of top-performing Airbnb properties in Chenôvebased on Trailing Twelve Month (TTM) revenue. Analyze their characteristics, revenue, occupancy rate, and ADR to understand what drives success in this market.
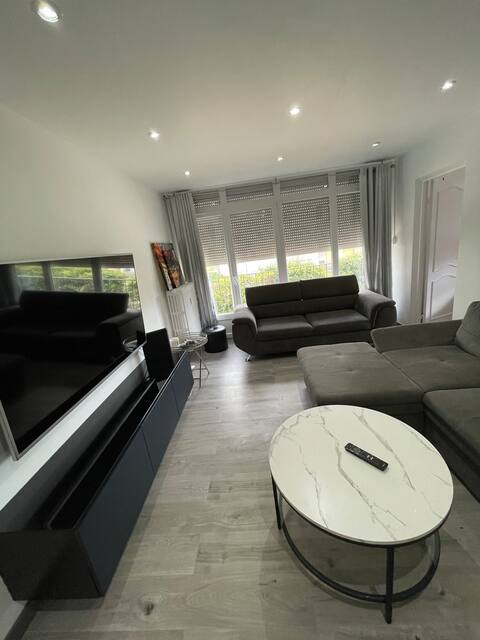
Luxury apartment with 4 bedrooms
Entire Place • 4 bedrooms
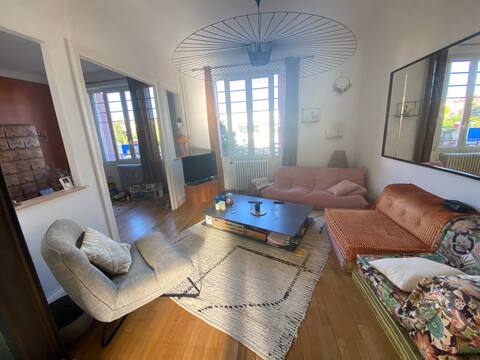
Comfortable townhouse with wooded garden.
Entire Place • 4 bedrooms
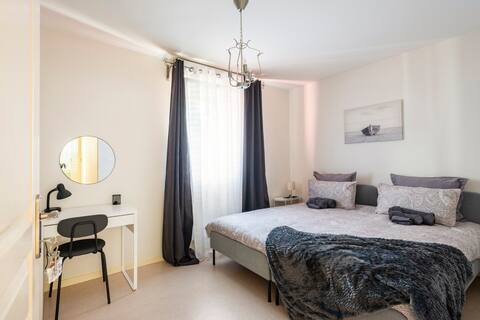
Gites Dijon VillaNari garden/jacuzzi Chenôve/Dijon
Entire Place • 3 bedrooms
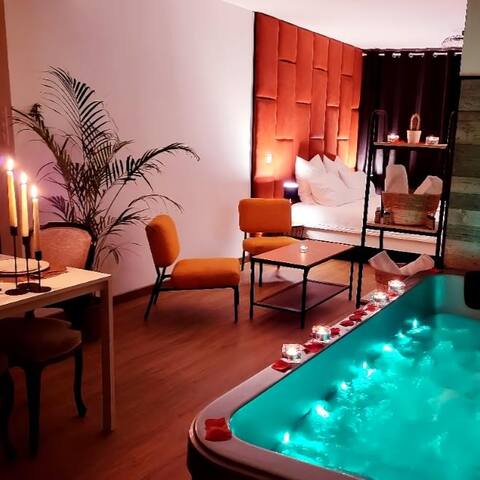
Cosy Corner - Appartement spa
Entire Place • 1 bedroom
House 4*+refill see.élec"De Ville en Vigne".
Entire Place • 3 bedrooms

Appart. Marsannay Grands Crus - Dijon
Entire Place • 2 bedrooms
Note: Performance varies based on location, size, amenities, seasonality, and management quality. Data reflects the past 12 months.
Top Performing Airbnb Hosts in Chenôve (2025)
Learn from the best! This table showcases top-performing Airbnb hosts in Chenôve based on the number of properties managed and estimated total revenue over the past year. Analyze their scale and performance metrics.
| Host Name | Properties | Grossing Revenue | Stay Reviews | Avg Rating |
|---|---|---|---|---|
| Younes | 1 | $45,254 | 14 | 4.57/5.0 |
| Mathilde Françoise Christiane | 1 | $41,936 | 27 | 4.96/5.0 |
| Laure | 2 | $41,620 | 389 | 4.92/5.0 |
| Narimen | 1 | $33,070 | 107 | 4.85/5.0 |
| Nathalie | 1 | $20,646 | 45 | 4.98/5.0 |
| Géraldine & Vincent | 3 | $20,508 | 295 | 3.18/5.0 |
| Pauline | 1 | $20,441 | 30 | 4.93/5.0 |
| Radouan | 3 | $18,719 | 20 | 3.48/5.0 |
| Nawel | 1 | $17,673 | 105 | 4.59/5.0 |
| Valerie | 1 | $16,652 | 185 | 4.84/5.0 |
Analyzing the strategies of top hosts, such as their property selection, pricing, and guest communication, can offer valuable lessons for optimizing your own Airbnb operations in Chenôve.
Dive Deeper: Advanced Chenôve STR Market Data (2025)
Ready to unlock more insights? AirROI provides access to advanced metrics and comprehensive Airbnb data for Chenôve. Explore detailed analytics beyond this report to refine your investment strategy, optimize pricing, and maximize your vacation rental profits.
Explore Advanced MetricsChenôve Short-Term Rental Market Composition (2025): Property & Room Types
Room Type Distribution
Property Type Distribution
Market Composition Insights for Chenôve
- The Chenôve Airbnb market composition is heavily skewed towards Entire Home/Apt listings, which make up 64.9% of the 37 active rentals. This indicates strong guest preference for privacy and space.
- However, a notable 35.1% share for Private Rooms suggests opportunities for budget-conscious travelers or hosts renting out spare rooms.
- Looking at the property type distribution in Chenôve, Apartment/Condo properties are the most common (48.6%), reflecting the local real estate landscape.
- Houses represent a significant 37.8% portion, catering likely to families or larger groups.
- The presence of 10.8% Hotel/Boutique listings indicates integration with traditional hospitality.
- Smaller segments like others (combined 2.7%) offer potential for unique stay experiences.
Chenôve Airbnb Room Capacity Analysis (2025): Bedroom Distribution
Distribution of Listings by Number of Bedrooms
Room Capacity Insights for Chenôve
- The dominant room capacity in Chenôve is 1 bedroom listings, making up 35.1% of the market. This suggests a strong demand for properties suitable for couples or solo travelers.
- Together, 1 bedroom and 3 bedrooms properties represent 48.6% of the active Airbnb listings in Chenôve, indicating a high concentration in these sizes.
- A significant 27.0% of listings offer 3+ bedrooms, catering to larger groups and families seeking more space in Chenôve.
Chenôve Vacation Rental Guest Capacity Trends (2025)
Distribution of Listings by Guest Capacity
Guest Capacity Insights for Chenôve
- The most common guest capacity trend in Chenôve vacation rentals is listings accommodating 2 guests (21.6%). This suggests the primary traveler segment is likely couples or solo travelers.
- Properties designed for 2 guests and 6 guests dominate the Chenôve STR market, accounting for 35.1% of listings.
- 27.0% of properties accommodate 6+ guests, serving the market segment for larger families or group travel in Chenôve.
- On average, properties in Chenôve are equipped to host 3.2 guests.
Chenôve Airbnb Booking Patterns (2025): Available vs. Booked Days
Available Days Distribution
Booked Days Distribution
Booking Pattern Insights for Chenôve
- The most common availability pattern in Chenôve falls within the 271-366 days range, representing 43.2% of listings. This suggests many properties have significant open periods on their calendars.
- Approximately 78.3% of listings show high availability (181+ days open annually), indicating potential for increased bookings or specific owner usage patterns.
- For booked days, the 91-180 days range is most frequent in Chenôve (37.8%), reflecting common guest stay durations or potential owner blocking patterns.
- A notable 21.6% of properties secure long booking periods (181+ days booked per year), highlighting successful long-term rental strategies or significant owner usage.
Chenôve Airbnb Minimum Stay Requirements Analysis
Distribution of Listings by Minimum Night Requirement
1 Night
18 listings
51.4% of total
2 Nights
8 listings
22.9% of total
3 Nights
3 listings
8.6% of total
4-6 Nights
2 listings
5.7% of total
7-29 Nights
1 listings
2.9% of total
30+ Nights
3 listings
8.6% of total
Key Insights
- The most prevalent minimum stay requirement in Chenôve is 1 Night, adopted by 51.4% of listings. This highlights the market's preference for shorter, flexible bookings.
- A strong majority (74.3%) of the Chenôve Airbnb data shows acceptance of very short stays (1-2 nights), indicating a dynamic, high-turnover market.
Recommendations
- Align with the market by considering a 1 Night minimum stay, as 51.4% of Chenôve hosts use this setting.
- Explore offering discounts for stays of 30+ nights to attract the 8.6% of the market seeking extended stays.
- Adjust minimum nights based on seasonality – potentially shorter during low season and longer during peak demand periods in Chenôve.
Chenôve Airbnb Cancellation Policy Trends Analysis (2025)
Flexible
10 listings
32.3% of total
Moderate
10 listings
32.3% of total
Strict
11 listings
35.5% of total
Cancellation Policy Insights for Chenôve
- The prevailing Airbnb cancellation policy trend in Chenôve is Strict, used by 35.5% of listings.
- There's a relatively balanced mix between guest-friendly (64.6%) and stricter (35.5%) policies, offering choices for different guest needs.
Recommendations for Hosts
- Consider adopting a Strict policy to align with the 35.5% market standard in Chenôve.
- With 35.5% using Strict terms, this is a viable option in Chenôve, particularly for high-value properties or during peak demand periods.
- Regularly review your cancellation policy against competitors and market demand shifts in Chenôve.
Chenôve STR Booking Lead Time Analysis (2025)
Average Booking Lead Time by Month
Booking Lead Time Insights for Chenôve
- The overall average booking lead time for vacation rentals in Chenôve is 51 days.
- Guests book furthest in advance for stays during June (average 87 days), likely coinciding with peak travel demand or local events.
- The shortest booking windows occur for stays in November (average 34 days), indicating more last-minute travel plans during this time.
- Seasonally, Spring (69 days avg.) sees the longest lead times, while Fall (42 days avg.) has the shortest, reflecting typical travel planning cycles.
Recommendations for Hosts
- Use the overall average lead time (51 days) as a baseline for your pricing and availability strategy in Chenôve.
- For June stays, consider implementing length-of-stay discounts or slightly higher rates for bookings made less than 87 days out to capitalize on advance planning.
- Target marketing efforts for the Spring season well in advance (at least 69 days) to capture early planners.
- Monitor your own booking lead times against these Chenôve averages to identify opportunities for dynamic pricing adjustments.
Popular & Essential Airbnb Amenities in Chenôve (2025)
Amenity Prevalence
Amenity Insights for Chenôve
- Popular amenities like Heating, Kitchen, Smoke alarm are common but not universal. Offering these can provide a competitive edge.
- Warning: Wifi is not universally provided but is considered essential globally. Ensure reliable Wifi is offered.
Recommendations for Hosts
- Consider adding popular differentiators like Heating or Kitchen to increase appeal.
- Highlight unique or less common amenities you offer (e.g., hot tub, dedicated workspace, EV charger) in your listing description and photos.
- Regularly check competitor amenities in Chenôve to stay competitive.
Chenôve Airbnb Guest Demographics & Profile Analysis (2025)
Guest Profile Summary for Chenôve
- The typical guest profile for Airbnb in Chenôve consists of primarily domestic travelers (81%), often arriving from nearby Dijon, typically belonging to the Post-2000s (Gen Z/Alpha) group (50%), primarily speaking French or English.
- Domestic travelers account for 81.3% of guests.
- Key international markets include France (81.3%) and Belgium (4.4%).
- Top languages spoken are French (46.5%) followed by English (30.4%).
- A significant demographic segment is the Post-2000s (Gen Z/Alpha) group, representing 50% of guests.
Recommendations for Hosts
- Target domestic marketing efforts towards travelers from Dijon and Paris.
- Tailor amenities and listing descriptions to appeal to the dominant Post-2000s (Gen Z/Alpha) demographic (e.g., highlight fast WiFi, smart home features, local guides).
- Highlight unique local experiences or amenities relevant to the primary guest profile.
- Consider seasonal promotions aligned with peak travel times for key origin markets.
Nearby Short-Term Rental Market Comparison
How does the Chenôve Airbnb market stack up against its neighbors? Compare key performance metrics like average monthly revenue, ADR, and occupancy rates in surrounding areas to understand the broader regional STR landscape.
| Market | Active Properties | Monthly Revenue | Daily Rate | Avg. Occupancy |
|---|---|---|---|---|
| La Rivière-Enverse | 17 | $5,972 | $624.02 | 41% |
| Épinac | 14 | $5,147 | $333.01 | 37% |
| Puligny-Montrachet | 11 | $3,908 | $398.00 | 44% |
| Juliénas | 11 | $3,378 | $292.32 | 46% |
| Corgoloin | 10 | $3,314 | $296.49 | 44% |
| Seytroux | 16 | $3,301 | $340.23 | 38% |
| La Côte-d'Arbroz | 36 | $3,027 | $463.60 | 34% |
| Blonay - Saint-Légier | 21 | $2,972 | $273.71 | 48% |
| Bligny-lès-Beaune | 24 | $2,930 | $233.89 | 44% |
| Montriond | 163 | $2,890 | $368.46 | 39% |