Paray-le-Monial Airbnb Market Analysis 2025: Short Term Rental Data & Vacation Rental Statistics in Bourgogne – Franche-Comté, France
Is Airbnb profitable in Paray-le-Monial in 2025? Explore comprehensive Airbnb analytics for Paray-le-Monial, Bourgogne – Franche-Comté, France to uncover income potential. This 2025 STR market report for Paray-le-Monial, based on AirROI data from April 2024 to March 2025, reveals key trends in the niche market of 137 active listings.
Whether you're considering an Airbnb investment in Paray-le-Monial, optimizing your existing vacation rental, or exploring rental arbitrage opportunities, understanding the Paray-le-Monial Airbnb data is crucial. Leveraging the low regulation environment is key to maximizing your short term rental income potential. Let's dive into the specifics.
Key Paray-le-Monial Airbnb Performance Metrics Overview
Monthly Airbnb Revenue Variations & Income Potential in Paray-le-Monial (2025)
Understanding the monthly revenue variations for Airbnb listings in Paray-le-Monial is key to maximizing your short term rental income potential. Seasonality significantly impacts earnings. Our analysis, based on data from the past 12 months, shows that the peak revenue month for STRs in Paray-le-Monial is typically July, while February often presents the lowest earnings, highlighting opportunities for strategic pricing adjustments during shoulder and low seasons. Explore the typical Airbnb income in Paray-le-Monial across different performance tiers:
- Best-in-class properties (Top 10%) achieve $2,435+ monthly, often utilizing dynamic pricing and superior guest experiences.
- Strong performing properties (Top 25%) earn $1,596 or more, indicating effective management and desirable locations/amenities.
- Typical properties (Median) generate around $969 per month, representing the average market performance.
- Entry-level properties (Bottom 25%) see earnings around $457, often with potential for optimization.
Average Monthly Airbnb Earnings Trend in Paray-le-Monial
Paray-le-Monial Airbnb Occupancy Rate Trends (2025)
Maximize your bookings by understanding the Paray-le-Monial STR occupancy trends. Seasonal demand shifts significantly influence how often properties are booked. Typically, Julysees the highest demand (peak season occupancy), while January experiences the lowest (low season). Effective strategies, like adjusting minimum stays or offering promotions, can boost occupancy during slower periods. Here's how different property tiers perform in Paray-le-Monial:
- Best-in-class properties (Top 10%) achieve 76%+ occupancy, indicating high desirability and potentially optimized availability.
- Strong performing properties (Top 25%) maintain 55% or higher occupancy, suggesting good market fit and guest satisfaction.
- Typical properties (Median) have an occupancy rate around 36%.
- Entry-level properties (Bottom 25%) average 19% occupancy, potentially facing higher vacancy.
Average Monthly Occupancy Rate Trend in Paray-le-Monial
Average Daily Rate (ADR) Airbnb Trends in Paray-le-Monial (2025)
Effective short term rental pricing strategy in Paray-le-Monial involves understanding monthly ADR fluctuations. The Average Daily Rate (ADR) for Airbnb in Paray-le-Monial typically peaks in December and dips lowest during October. Leveraging Airbnb dynamic pricing tools or strategies based on this seasonality can significantly boost revenue. Here's a look at the typical nightly rates achieved:
- Best-in-class properties (Top 10%) command rates of $182+ per night, often due to premium features or locations.
- Strong performing properties (Top 25%) achieve nightly rates of $108 or more.
- Typical properties (Median) charge around $76 per night.
- Entry-level properties (Bottom 25%) earn around $55 per night.
Average Daily Rate (ADR) Trend by Month in Paray-le-Monial
Get Live Paray-le-Monial Market Intelligence 👇

Explore Real-time Analytics
Airbnb Seasonality Analysis & Trends in Paray-le-Monial (2025)
Peak Season (July, June, August)
- Revenue averages $1,819 per month
- Occupancy rates average 49.0%
- Daily rates average $102
Shoulder Season
- Revenue averages $1,274 per month
- Occupancy maintains around 37.2%
- Daily rates hold near $103
Low Season (January, February, March)
- Revenue drops to average $821 per month
- Occupancy decreases to average 34.1%
- Daily rates adjust to average $105
Seasonality Insights for Paray-le-Monial
- The Airbnb seasonality in Paray-le-Monial shows highly seasonal trends requiring careful strategy. While the sections above show seasonal averages, it's also insightful to look at the extremes:
- During the high season, the absolute peak month showcases Paray-le-Monial's highest earning potential, with monthly revenues capable of climbing to $1,892, occupancy reaching a high of 63.2%, and ADRs peaking at $109.
- Conversely, the slowest single month of the year, typically falling within the low season, marks the market's lowest point. In this month, revenue might dip to $714, occupancy could drop to 32.4%, and ADRs may adjust down to $98.
- Understanding both the seasonal averages and these monthly peaks and troughs in revenue, occupancy, and ADR is crucial for maximizing your Airbnb profit potential in Paray-le-Monial.
Seasonal Strategies for Maximizing Profit
- Peak Season: Maximize revenue through premium pricing and potentially longer minimum stays. Ensure high availability.
- Low Season: Offer competitive pricing, special promotions (e.g., extended stay discounts), and flexible cancellation policies. Target off-season travelers like remote workers or budget-conscious guests.
- Shoulder Seasons: Implement dynamic pricing that balances peak and low rates. Target weekend travelers or specific events. Offer slightly more flexible terms than peak season.
- Regularly analyze your own performance against these Paray-le-Monial seasonality benchmarks and adjust your pricing and availability strategy accordingly.
Best Areas for Airbnb Investment in Paray-le-Monial (2025)
Exploring the top neighborhoods for short-term rentals in Paray-le-Monial? This section highlights key areas, outlining why they are attractive for hosts and guests, along with notable local attractions. Consider these locations based on your target guest profile and investment strategy.
| Neighborhood / Area | Why Host Here? (Target Guests & Appeal) | Key Attractions & Landmarks |
|---|---|---|
| Centre-ville | The city center of Paray-le-Monial is rich in historical architecture and local culture. It's close to the main sites like the Basilica of St. Mary Magdalene, making it attractive for tourists. | Basilique du Sacré-Cœur, Parc du Château, Musee Miro, Jardins de la mairie |
| La Patinoire | A charming area with beautiful landscapes and nature. It draws visitors who enjoy outdoor activities. | Lac de la Patinoire, Nature Trail, Greenery parks |
| Saint-Ambroise | This area is known for its peaceful ambiance and close proximity to the commune's historical sites, ideal for families and quiet retreats. | Historical sites, Local artisan shops, Cafés, Biking trails |
| Rue de la République | A vibrant street with shops, restaurants, and local markets, central to the local community and a short walk from tourist attractions. | Local shops, Bistros, Market square, Nearby churches |
| Château de la Roche | A picturesque château offering stunning views and nearby hiking opportunities. Popular with tourists seeking a more rural stay. | Château tours, Scenic views, Hiking trails |
| Parc Naturel Régional du Morvan | A nearby natural park that attracts tourists looking for outdoor leisure activities such as hiking and camping. | Hiking routes, Wildlife viewing, Picnic areas |
| Les Grands Lacs | An area famous for its lakes, ideal for water sports and relaxing by the water. A perfect getaway for those seeking nature. | Lakes, Water activities, Camping, Scenic views |
| Ternant | A small village with a tranquil atmosphere, good for visitors looking for a rural experience and a close-knit community vibe. | Local festivals, Countryside views, Traditional markets |
Understanding Airbnb License Requirements & STR Laws in Paray-le-Monial (2025)
While Paray-le-Monial, Bourgogne – Franche-Comté, France currently shows low STR regulations, specific Airbnb license requirements might still exist or change. Always verify the latest short term rental regulations and Airbnb license requirements directly with local government authorities for Paray-le-Monial to ensure full compliance before hosting.
(Source: AirROI data, 2025, based on 4% licensed listings)
Top Performing Airbnb Properties in Paray-le-Monial (2025)
Benchmark your potential! Explore examples of top-performing Airbnb properties in Paray-le-Monialbased on Trailing Twelve Month (TTM) revenue. Analyze their characteristics, revenue, occupancy rate, and ADR to understand what drives success in this market.

Big Townhouse in Paray le Monial for 25 people
Entire Place • 8 bedrooms
La Belle Etoile cottage - center, private parking
Entire Place • 5 bedrooms
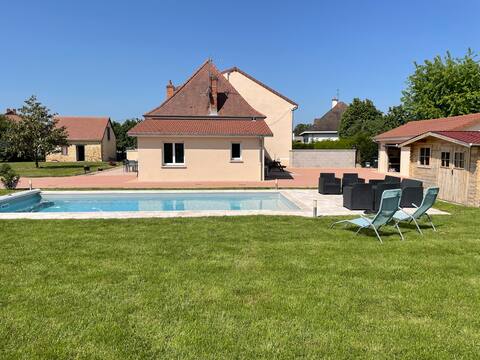
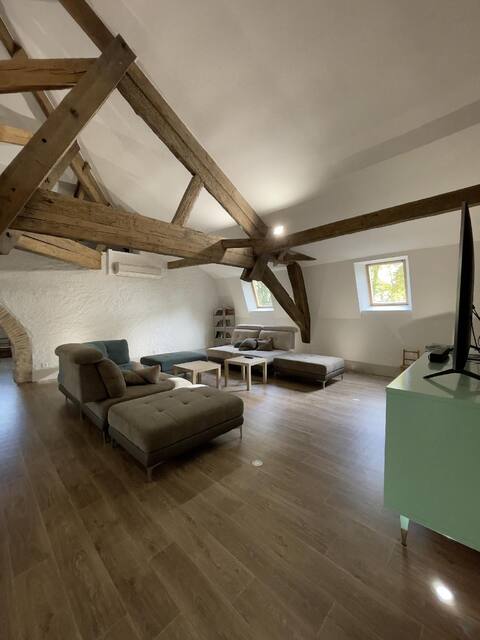
House with pool 10 people
Entire Place • 4 bedrooms

Modernity in Paray: Three Bedroom Apartment
Entire Place • 3 bedrooms
Villa in Burgundy, gatherings and group stays
Entire Place • 15 bedrooms

Townhouse with terrace
Entire Place • 4 bedrooms
Note: Performance varies based on location, size, amenities, seasonality, and management quality. Data reflects the past 12 months.
Top Performing Airbnb Hosts in Paray-le-Monial (2025)
Learn from the best! This table showcases top-performing Airbnb hosts in Paray-le-Monial based on the number of properties managed and estimated total revenue over the past year. Analyze their scale and performance metrics.
| Host Name | Properties | Grossing Revenue | Stay Reviews | Avg Rating |
|---|---|---|---|---|
| Franck | 4 | $116,981 | 49 | 3.64/5.0 |
| Charlotte | 1 | $87,841 | 12 | 4.75/5.0 |
| Mathieu | 5 | $74,464 | 718 | 4.65/5.0 |
| Eric | 6 | $71,164 | 143 | 4.72/5.0 |
| Coralie Et Christian | 1 | $67,060 | 5 | 5.00/5.0 |
| Valerie | 1 | $62,023 | 14 | 4.93/5.0 |
| Maxime | 2 | $35,933 | 113 | 4.95/5.0 |
| Géraldine | 1 | $34,164 | 24 | 4.96/5.0 |
| Philippe | 4 | $31,994 | 68 | 4.87/5.0 |
| Zacharie | 3 | $30,573 | 196 | 4.58/5.0 |
Analyzing the strategies of top hosts, such as their property selection, pricing, and guest communication, can offer valuable lessons for optimizing your own Airbnb operations in Paray-le-Monial.
Dive Deeper: Advanced Paray-le-Monial STR Market Data (2025)
Ready to unlock more insights? AirROI provides access to advanced metrics and comprehensive Airbnb data for Paray-le-Monial. Explore detailed analytics beyond this report to refine your investment strategy, optimize pricing, and maximize your vacation rental profits.
Explore Advanced MetricsParay-le-Monial Short-Term Rental Market Composition (2025): Property & Room Types
Room Type Distribution
Property Type Distribution
Market Composition Insights for Paray-le-Monial
- The Paray-le-Monial Airbnb market composition is heavily skewed towards Entire Home/Apt listings, which make up 85.4% of the 137 active rentals. This indicates strong guest preference for privacy and space.
- Looking at the property type distribution in Paray-le-Monial, Apartment/Condo properties are the most common (59.1%), reflecting the local real estate landscape.
- Houses represent a significant 32.8% portion, catering likely to families or larger groups.
- The presence of 5.1% Hotel/Boutique listings indicates integration with traditional hospitality.
- Smaller segments like others, outdoor/unique, unique stays (combined 2.9%) offer potential for unique stay experiences.
Paray-le-Monial Airbnb Room Capacity Analysis (2025): Bedroom Distribution
Distribution of Listings by Number of Bedrooms
Room Capacity Insights for Paray-le-Monial
- The dominant room capacity in Paray-le-Monial is 2 bedrooms listings, making up 33.6% of the market. This suggests a strong demand for properties suitable for couples or solo travelers.
- Together, 2 bedrooms and 1 bedroom properties represent 67.2% of the active Airbnb listings in Paray-le-Monial, indicating a high concentration in these sizes.
Paray-le-Monial Vacation Rental Guest Capacity Trends (2025)
Distribution of Listings by Guest Capacity
Guest Capacity Insights for Paray-le-Monial
- The most common guest capacity trend in Paray-le-Monial vacation rentals is listings accommodating 6 guests (22.6%). This suggests the primary traveler segment is likely larger groups.
- Properties designed for 6 guests and 4 guests dominate the Paray-le-Monial STR market, accounting for 40.1% of listings.
- 37.2% of properties accommodate 6+ guests, serving the market segment for larger families or group travel in Paray-le-Monial.
- On average, properties in Paray-le-Monial are equipped to host 4.3 guests.
Paray-le-Monial Airbnb Booking Patterns (2025): Available vs. Booked Days
Available Days Distribution
Booked Days Distribution
Booking Pattern Insights for Paray-le-Monial
- The most common availability pattern in Paray-le-Monial falls within the 271-366 days range, representing 49.6% of listings. This suggests many properties have significant open periods on their calendars.
- Approximately 78.1% of listings show high availability (181+ days open annually), indicating potential for increased bookings or specific owner usage patterns.
- For booked days, the 91-180 days range is most frequent in Paray-le-Monial (32.1%), reflecting common guest stay durations or potential owner blocking patterns.
- A notable 22.7% of properties secure long booking periods (181+ days booked per year), highlighting successful long-term rental strategies or significant owner usage.
Paray-le-Monial Airbnb Minimum Stay Requirements Analysis
Distribution of Listings by Minimum Night Requirement
1 Night
52 listings
43% of total
2 Nights
36 listings
29.8% of total
3 Nights
12 listings
9.9% of total
4-6 Nights
11 listings
9.1% of total
30+ Nights
10 listings
8.3% of total
Key Insights
- The most prevalent minimum stay requirement in Paray-le-Monial is 1 Night, adopted by 43% of listings. This highlights the market's preference for shorter, flexible bookings.
- A strong majority (72.8%) of the Paray-le-Monial Airbnb data shows acceptance of very short stays (1-2 nights), indicating a dynamic, high-turnover market.
Recommendations
- Align with the market by considering a 1 Night minimum stay, as 43% of Paray-le-Monial hosts use this setting.
- Explore offering discounts for stays of 30+ nights to attract the 8.3% of the market seeking extended stays.
- Adjust minimum nights based on seasonality – potentially shorter during low season and longer during peak demand periods in Paray-le-Monial.
Paray-le-Monial Airbnb Cancellation Policy Trends Analysis (2025)
Flexible
47 listings
41.2% of total
Moderate
26 listings
22.8% of total
Firm
14 listings
12.3% of total
Strict
27 listings
23.7% of total
Cancellation Policy Insights for Paray-le-Monial
- The prevailing Airbnb cancellation policy trend in Paray-le-Monial is Flexible, used by 41.2% of listings.
- There's a relatively balanced mix between guest-friendly (64.0%) and stricter (36.0%) policies, offering choices for different guest needs.
Recommendations for Hosts
- Consider adopting a Flexible policy to align with the 41.2% market standard in Paray-le-Monial.
- Regularly review your cancellation policy against competitors and market demand shifts in Paray-le-Monial.
Paray-le-Monial STR Booking Lead Time Analysis (2025)
Average Booking Lead Time by Month
Booking Lead Time Insights for Paray-le-Monial
- The overall average booking lead time for vacation rentals in Paray-le-Monial is 47 days.
- Guests book furthest in advance for stays during July (average 105 days), likely coinciding with peak travel demand or local events.
- The shortest booking windows occur for stays in December (average 22 days), indicating more last-minute travel plans during this time.
- Seasonally, Summer (81 days avg.) sees the longest lead times, while Winter (27 days avg.) has the shortest, reflecting typical travel planning cycles.
Recommendations for Hosts
- Use the overall average lead time (47 days) as a baseline for your pricing and availability strategy in Paray-le-Monial.
- For July stays, consider implementing length-of-stay discounts or slightly higher rates for bookings made less than 105 days out to capitalize on advance planning.
- Target marketing efforts for the Summer season well in advance (at least 81 days) to capture early planners.
- Monitor your own booking lead times against these Paray-le-Monial averages to identify opportunities for dynamic pricing adjustments.
Popular & Essential Airbnb Amenities in Paray-le-Monial (2025)
Amenity Prevalence
Amenity Insights for Paray-le-Monial
- Popular amenities like Heating, Kitchen, TV are common but not universal. Offering these can provide a competitive edge.
Recommendations for Hosts
- Consider adding popular differentiators like Heating or Kitchen to increase appeal.
- Highlight unique or less common amenities you offer (e.g., hot tub, dedicated workspace, EV charger) in your listing description and photos.
- Regularly check competitor amenities in Paray-le-Monial to stay competitive.
Paray-le-Monial Airbnb Guest Demographics & Profile Analysis (2025)
Guest Profile Summary for Paray-le-Monial
- The typical guest profile for Airbnb in Paray-le-Monial consists of primarily domestic travelers (88%), often arriving from nearby Paris, typically belonging to the Post-2000s (Gen Z/Alpha) group (50%), primarily speaking French or English.
- Domestic travelers account for 87.7% of guests.
- Key international markets include France (87.7%) and Switzerland (2.7%).
- Top languages spoken are French (44.6%) followed by English (31%).
- A significant demographic segment is the Post-2000s (Gen Z/Alpha) group, representing 50% of guests.
Recommendations for Hosts
- Target domestic marketing efforts towards travelers from Paris and Lyon.
- Tailor amenities and listing descriptions to appeal to the dominant Post-2000s (Gen Z/Alpha) demographic (e.g., highlight fast WiFi, smart home features, local guides).
- Highlight unique local experiences or amenities relevant to the primary guest profile.
- Consider seasonal promotions aligned with peak travel times for key origin markets.
Nearby Short-Term Rental Market Comparison
How does the Paray-le-Monial Airbnb market stack up against its neighbors? Compare key performance metrics like average monthly revenue, ADR, and occupancy rates in surrounding areas to understand the broader regional STR landscape.
| Market | Active Properties | Monthly Revenue | Daily Rate | Avg. Occupancy |
|---|---|---|---|---|
| Épinac | 14 | $5,147 | $333.01 | 37% |
| Saint-Germain-au-Mont-d'Or | 10 | $3,928 | $316.02 | 40% |
| Puligny-Montrachet | 11 | $3,908 | $398.00 | 44% |
| Dommartin | 11 | $3,905 | $327.00 | 36% |
| Juliénas | 11 | $3,378 | $292.32 | 46% |
| Corgoloin | 10 | $3,314 | $296.49 | 44% |
| Courzieu | 11 | $3,267 | $287.83 | 52% |
| Vanosc | 13 | $3,072 | $224.52 | 44% |
| Bligny-lès-Beaune | 24 | $2,930 | $233.89 | 44% |
| Romanèche-Thorins | 13 | $2,817 | $239.98 | 43% |