Nanchez Airbnb Market Analysis 2025: Short Term Rental Data & Vacation Rental Statistics in Bourgogne – Franche-Comté, France
Is Airbnb profitable in Nanchez in 2025? Explore comprehensive Airbnb analytics for Nanchez, Bourgogne – Franche-Comté, France to uncover income potential. This 2025 STR market report for Nanchez, based on AirROI data from April 2024 to March 2025, reveals key trends in the niche market of 36 active listings.
Whether you're considering an Airbnb investment in Nanchez, optimizing your existing vacation rental, or exploring rental arbitrage opportunities, understanding the Nanchez Airbnb data is crucial. Leveraging the low regulation environment is key to maximizing your short term rental income potential. Let's dive into the specifics.
Key Nanchez Airbnb Performance Metrics Overview
Monthly Airbnb Revenue Variations & Income Potential in Nanchez (2025)
Understanding the monthly revenue variations for Airbnb listings in Nanchez is key to maximizing your short term rental income potential. Seasonality significantly impacts earnings. Our analysis, based on data from the past 12 months, shows that the peak revenue month for STRs in Nanchez is typically August, while November often presents the lowest earnings, highlighting opportunities for strategic pricing adjustments during shoulder and low seasons. Explore the typical Airbnb income in Nanchez across different performance tiers:
- Best-in-class properties (Top 10%) achieve $3,263+ monthly, often utilizing dynamic pricing and superior guest experiences.
- Strong performing properties (Top 25%) earn $2,243 or more, indicating effective management and desirable locations/amenities.
- Typical properties (Median) generate around $1,218 per month, representing the average market performance.
- Entry-level properties (Bottom 25%) see earnings around $653, often with potential for optimization.
Average Monthly Airbnb Earnings Trend in Nanchez
Nanchez Airbnb Occupancy Rate Trends (2025)
Maximize your bookings by understanding the Nanchez STR occupancy trends. Seasonal demand shifts significantly influence how often properties are booked. Typically, Augustsees the highest demand (peak season occupancy), while November experiences the lowest (low season). Effective strategies, like adjusting minimum stays or offering promotions, can boost occupancy during slower periods. Here's how different property tiers perform in Nanchez:
- Best-in-class properties (Top 10%) achieve 67%+ occupancy, indicating high desirability and potentially optimized availability.
- Strong performing properties (Top 25%) maintain 53% or higher occupancy, suggesting good market fit and guest satisfaction.
- Typical properties (Median) have an occupancy rate around 39%.
- Entry-level properties (Bottom 25%) average 23% occupancy, potentially facing higher vacancy.
Average Monthly Occupancy Rate Trend in Nanchez
Average Daily Rate (ADR) Airbnb Trends in Nanchez (2025)
Effective short term rental pricing strategy in Nanchez involves understanding monthly ADR fluctuations. The Average Daily Rate (ADR) for Airbnb in Nanchez typically peaks in February and dips lowest during September. Leveraging Airbnb dynamic pricing tools or strategies based on this seasonality can significantly boost revenue. Here's a look at the typical nightly rates achieved:
- Best-in-class properties (Top 10%) command rates of $196+ per night, often due to premium features or locations.
- Strong performing properties (Top 25%) achieve nightly rates of $159 or more.
- Typical properties (Median) charge around $99 per night.
- Entry-level properties (Bottom 25%) earn around $68 per night.
Average Daily Rate (ADR) Trend by Month in Nanchez
Get Live Nanchez Market Intelligence 👇

Explore Real-time Analytics
Airbnb Seasonality Analysis & Trends in Nanchez (2025)
Peak Season (August, July, April)
- Revenue averages $2,184 per month
- Occupancy rates average 59.6%
- Daily rates average $123
Shoulder Season
- Revenue averages $1,452 per month
- Occupancy maintains around 35.2%
- Daily rates hold near $124
Low Season (September, October, November)
- Revenue drops to average $1,019 per month
- Occupancy decreases to average 26.7%
- Daily rates adjust to average $119
Seasonality Insights for Nanchez
- The Airbnb seasonality in Nanchez shows highly seasonal trends requiring careful strategy. While the sections above show seasonal averages, it's also insightful to look at the extremes:
- During the high season, the absolute peak month showcases Nanchez's highest earning potential, with monthly revenues capable of climbing to $2,587, occupancy reaching a high of 71.2%, and ADRs peaking at $130.
- Conversely, the slowest single month of the year, typically falling within the low season, marks the market's lowest point. In this month, revenue might dip to $766, occupancy could drop to 18.7%, and ADRs may adjust down to $118.
- Understanding both the seasonal averages and these monthly peaks and troughs in revenue, occupancy, and ADR is crucial for maximizing your Airbnb profit potential in Nanchez.
Seasonal Strategies for Maximizing Profit
- Peak Season: Maximize revenue through premium pricing and potentially longer minimum stays. Ensure high availability.
- Low Season: Offer competitive pricing, special promotions (e.g., extended stay discounts), and flexible cancellation policies. Target off-season travelers like remote workers or budget-conscious guests.
- Shoulder Seasons: Implement dynamic pricing that balances peak and low rates. Target weekend travelers or specific events. Offer slightly more flexible terms than peak season.
- Regularly analyze your own performance against these Nanchez seasonality benchmarks and adjust your pricing and availability strategy accordingly.
Best Areas for Airbnb Investment in Nanchez (2025)
Exploring the top neighborhoods for short-term rentals in Nanchez? This section highlights key areas, outlining why they are attractive for hosts and guests, along with notable local attractions. Consider these locations based on your target guest profile and investment strategy.
| Neighborhood / Area | Why Host Here? (Target Guests & Appeal) | Key Attractions & Landmarks |
|---|---|---|
| Nanchéz Historic Center | Charming old town with historical significance, featuring beautiful architecture and a vibrant local culture. Ideal for tourists interested in history and local cuisine. | Nanchéz Cathedral, Local markets, Historic plazas, Museums, Cafés and restaurants |
| Lake Nanchéz | Scenic area offering stunning views and recreational activities. Attracts nature lovers and families looking for a peaceful getaway. | Lake activities (boating, fishing), Parks, Nature trails, Picnic areas, Scenic viewpoints |
| Mont Bourgogne | Beautiful mountainous region great for hikers and nature seekers. It offers a retreat for visitors looking for outdoor adventures and tranquility. | Hiking trails, Nature parks, Scenic vistas, Charming villages, Wildlife watching |
| Wine Route | Famous for its vineyards and wine tasting experiences, attracting connoisseurs and tourists alike. Perfect for those looking to experience French wine culture. | Vineyards, Wine tasting tours, Cellars, Local gastronomy, Beautiful landscapes |
| Cultural Quarter | A vibrant area known for arts, music, and festivals. It draws creative individuals and those seeking a lively atmosphere. | Art galleries, Music venues, Theater spaces, Street performances, Cultural festivals |
| Gastronomy District | Home to many renowned restaurants and bistros, this district attracts food lovers from all over. Ideal for culinary tourism. | Fine dining restaurants, Local bistros, Culinary events, Cooking classes, Food markets |
| Family Fun Park | A popular area for families featuring amusement parks and entertainment activities. Great for those traveling with children. | Amusement parks, Water parks, Family-friendly restaurants, Playgrounds, Outdoor activities |
| Shopping Area | Bustling shopping district with local boutiques and international brands. Attractive for tourists looking to shop while exploring. | Shopping malls, Local boutiques, Markets, Cafes, Cultural centers |
Understanding Airbnb License Requirements & STR Laws in Nanchez (2025)
While Nanchez, Bourgogne – Franche-Comté, France currently shows low STR regulations, specific Airbnb license requirements might still exist or change. Always verify the latest short term rental regulations and Airbnb license requirements directly with local government authorities for Nanchez to ensure full compliance before hosting.
(Source: AirROI data, 2025, based on 8% licensed listings)
Top Performing Airbnb Properties in Nanchez (2025)
Benchmark your potential! Explore examples of top-performing Airbnb properties in Nanchezbased on Trailing Twelve Month (TTM) revenue. Analyze their characteristics, revenue, occupancy rate, and ADR to understand what drives success in this market.
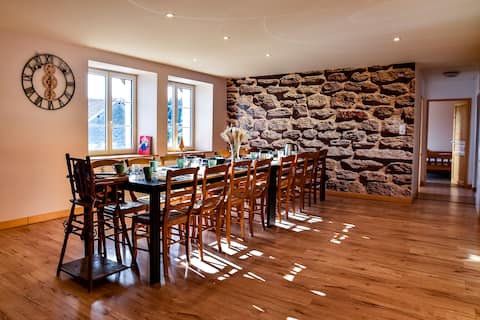
Gîte "Les Potentilles": 14 people
Entire Place • 5 bedrooms

Chalet des Hérissons- 10 people
Entire Place • 5 bedrooms
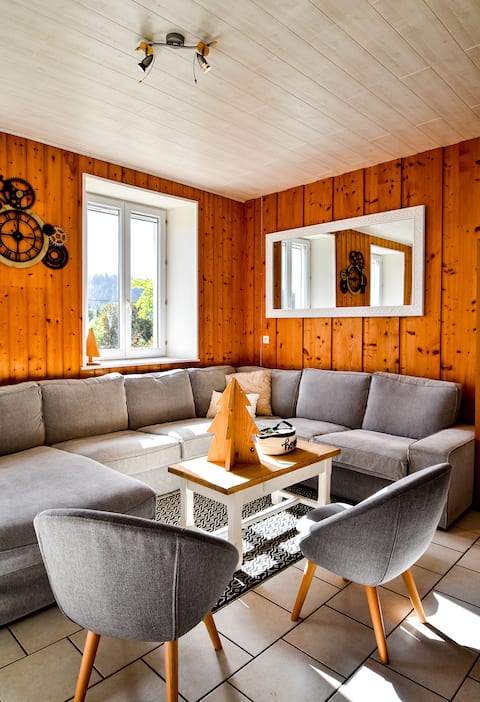
Gîte "Le Montjoie": 11 people
Entire Place • 5 bedrooms
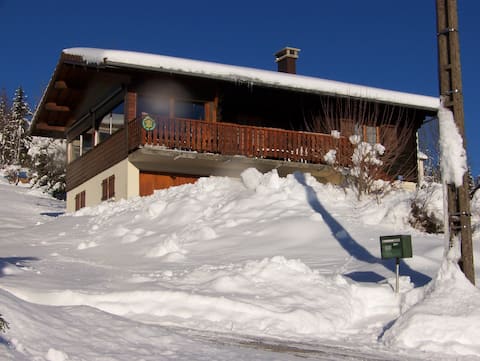
Friendly chalet with fireplace (wood provided )
Entire Place • 3 bedrooms
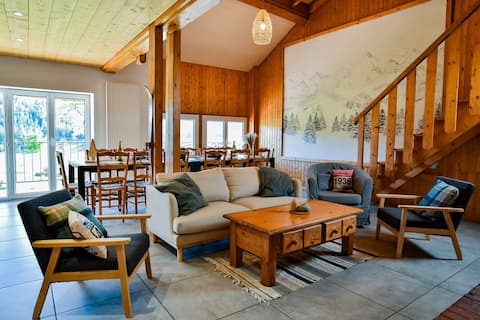
Gite "Benjamin": 10 people
Entire Place • 4 bedrooms
Lovely house with sauna and fireplace
Entire Place • 3 bedrooms
Note: Performance varies based on location, size, amenities, seasonality, and management quality. Data reflects the past 12 months.
Top Performing Airbnb Hosts in Nanchez (2025)
Learn from the best! This table showcases top-performing Airbnb hosts in Nanchez based on the number of properties managed and estimated total revenue over the past year. Analyze their scale and performance metrics.
| Host Name | Properties | Grossing Revenue | Stay Reviews | Avg Rating |
|---|---|---|---|---|
| Constance | 10 | $182,287 | 317 | 4.83/5.0 |
| Isabelle | 3 | $47,211 | 55 | 3.32/5.0 |
| Host #407652092 | 4 | $40,951 | 1 | 0.00/5.0 |
| Florence Et Maurice | 2 | $33,601 | 159 | 4.94/5.0 |
| Claudine Et Philippe | 1 | $33,495 | 75 | 4.80/5.0 |
| Thierry | 2 | $31,131 | 162 | 4.88/5.0 |
| Thierry | 1 | $20,083 | 63 | 4.90/5.0 |
| Jean Jacques | 1 | $17,190 | 23 | 4.91/5.0 |
| Sandrine | 1 | $16,745 | 50 | 5.00/5.0 |
| Véronique | 1 | $13,472 | 108 | 4.97/5.0 |
Analyzing the strategies of top hosts, such as their property selection, pricing, and guest communication, can offer valuable lessons for optimizing your own Airbnb operations in Nanchez.
Dive Deeper: Advanced Nanchez STR Market Data (2025)
Ready to unlock more insights? AirROI provides access to advanced metrics and comprehensive Airbnb data for Nanchez. Explore detailed analytics beyond this report to refine your investment strategy, optimize pricing, and maximize your vacation rental profits.
Explore Advanced MetricsNanchez Short-Term Rental Market Composition (2025): Property & Room Types
Room Type Distribution
Property Type Distribution
Market Composition Insights for Nanchez
- The Nanchez Airbnb market composition is heavily skewed towards Entire Home/Apt listings, which make up 97.2% of the 36 active rentals. This indicates strong guest preference for privacy and space.
- Looking at the property type distribution in Nanchez, Apartment/Condo properties are the most common (44.4%), reflecting the local real estate landscape.
- Houses represent a significant 38.9% portion, catering likely to families or larger groups.
- Smaller segments like hotel/boutique, others (combined 5.6%) offer potential for unique stay experiences.
Nanchez Airbnb Room Capacity Analysis (2025): Bedroom Distribution
Distribution of Listings by Number of Bedrooms
Room Capacity Insights for Nanchez
- The dominant room capacity in Nanchez is 2 bedrooms listings, making up 38.9% of the market. This suggests a strong demand for properties suitable for couples or solo travelers.
- Together, 2 bedrooms and 1 bedroom properties represent 63.9% of the active Airbnb listings in Nanchez, indicating a high concentration in these sizes.
- A significant 36.1% of listings offer 3+ bedrooms, catering to larger groups and families seeking more space in Nanchez.
Nanchez Vacation Rental Guest Capacity Trends (2025)
Distribution of Listings by Guest Capacity
Guest Capacity Insights for Nanchez
- The most common guest capacity trend in Nanchez vacation rentals is listings accommodating 8+ guests (27.8%). This suggests the primary traveler segment is likely larger groups.
- Properties designed for 8+ guests and 5 guests dominate the Nanchez STR market, accounting for 47.2% of listings.
- 44.5% of properties accommodate 6+ guests, serving the market segment for larger families or group travel in Nanchez.
- On average, properties in Nanchez are equipped to host 5.3 guests.
Nanchez Airbnb Booking Patterns (2025): Available vs. Booked Days
Available Days Distribution
Booked Days Distribution
Booking Pattern Insights for Nanchez
- The most common availability pattern in Nanchez falls within the 181-270 days range, representing 41.7% of listings. This suggests many properties have significant open periods on their calendars.
- Approximately 83.4% of listings show high availability (181+ days open annually), indicating potential for increased bookings or specific owner usage patterns.
- For booked days, the 91-180 days range is most frequent in Nanchez (44.4%), reflecting common guest stay durations or potential owner blocking patterns.
- A notable 16.7% of properties secure long booking periods (181+ days booked per year), highlighting successful long-term rental strategies or significant owner usage.
Nanchez Airbnb Minimum Stay Requirements Analysis
Distribution of Listings by Minimum Night Requirement
1 Night
4 listings
11.1% of total
2 Nights
8 listings
22.2% of total
3 Nights
4 listings
11.1% of total
4-6 Nights
10 listings
27.8% of total
30+ Nights
10 listings
27.8% of total
Key Insights
- The most prevalent minimum stay requirement in Nanchez is 4-6 Nights, adopted by 27.8% of listings. This highlights the market's preference for longer commitments.
- A significant segment (27.8%) caters to monthly stays (30+ nights) in Nanchez, pointing to opportunities in the extended-stay market.
Recommendations
- Align with the market by considering a 4-6 Nights minimum stay, as 27.8% of Nanchez hosts use this setting.
- If feasible, allowing 1-night stays, especially midweek or during low season, could capture last-minute bookings, as only 11.1% currently do.
- Explore offering discounts for stays of 30+ nights to attract the 27.8% of the market seeking extended stays.
- Adjust minimum nights based on seasonality – potentially shorter during low season and longer during peak demand periods in Nanchez.
Nanchez Airbnb Cancellation Policy Trends Analysis (2025)
Flexible
4 listings
12.9% of total
Moderate
2 listings
6.5% of total
Firm
4 listings
12.9% of total
Strict
21 listings
67.7% of total
Cancellation Policy Insights for Nanchez
- The prevailing Airbnb cancellation policy trend in Nanchez is Strict, used by 67.7% of listings.
- A majority (80.6%) of hosts in Nanchez utilize Firm or Strict policies, indicating a market where hosts prioritize booking security.
Recommendations for Hosts
- Consider adopting a Strict policy to align with the 67.7% market standard in Nanchez.
- With 67.7% using Strict terms, this is a viable option in Nanchez, particularly for high-value properties or during peak demand periods.
- Regularly review your cancellation policy against competitors and market demand shifts in Nanchez.
Nanchez STR Booking Lead Time Analysis (2025)
Average Booking Lead Time by Month
Booking Lead Time Insights for Nanchez
- The overall average booking lead time for vacation rentals in Nanchez is 69 days.
- Guests book furthest in advance for stays during August (average 115 days), likely coinciding with peak travel demand or local events.
- The shortest booking windows occur for stays in November (average 36 days), indicating more last-minute travel plans during this time.
- Seasonally, Summer (102 days avg.) sees the longest lead times, while Fall (47 days avg.) has the shortest, reflecting typical travel planning cycles.
Recommendations for Hosts
- Use the overall average lead time (69 days) as a baseline for your pricing and availability strategy in Nanchez.
- For August stays, consider implementing length-of-stay discounts or slightly higher rates for bookings made less than 115 days out to capitalize on advance planning.
- Target marketing efforts for the Summer season well in advance (at least 102 days) to capture early planners.
- Monitor your own booking lead times against these Nanchez averages to identify opportunities for dynamic pricing adjustments.
Popular & Essential Airbnb Amenities in Nanchez (2025)
Amenity Prevalence
Amenity Insights for Nanchez
- Essential amenities in Nanchez that guests expect include: Hot water, TV, Kitchen, Smoke alarm, Heating. Lacking these (any) could significantly impact bookings.
- Popular amenities like Washer, Dishes and silverware, Microwave are common but not universal. Offering these can provide a competitive edge.
Recommendations for Hosts
- Ensure your listing includes all essential amenities for Nanchez: Hot water, TV, Kitchen, Smoke alarm, Heating.
- Prioritize adding missing essentials: TV, Kitchen, Smoke alarm, Heating.
- Consider adding popular differentiators like Washer or Dishes and silverware to increase appeal.
- Highlight unique or less common amenities you offer (e.g., hot tub, dedicated workspace, EV charger) in your listing description and photos.
- Regularly check competitor amenities in Nanchez to stay competitive.
Nanchez Airbnb Guest Demographics & Profile Analysis (2025)
Guest Profile Summary for Nanchez
- The typical guest profile for Airbnb in Nanchez consists of primarily domestic travelers (90%), often arriving from nearby Lyon, typically belonging to the Post-2000s (Gen Z/Alpha) group (50%), primarily speaking French or English.
- Domestic travelers account for 89.6% of guests.
- Key international markets include France (89.6%) and Switzerland (4%).
- Top languages spoken are French (47.4%) followed by English (33.3%).
- A significant demographic segment is the Post-2000s (Gen Z/Alpha) group, representing 50% of guests.
Recommendations for Hosts
- Target domestic marketing efforts towards travelers from Lyon and Paris.
- Tailor amenities and listing descriptions to appeal to the dominant Post-2000s (Gen Z/Alpha) demographic (e.g., highlight fast WiFi, smart home features, local guides).
- Highlight unique local experiences or amenities relevant to the primary guest profile.
- Consider seasonal promotions aligned with peak travel times for key origin markets.
Nearby Short-Term Rental Market Comparison
How does the Nanchez Airbnb market stack up against its neighbors? Compare key performance metrics like average monthly revenue, ADR, and occupancy rates in surrounding areas to understand the broader regional STR landscape.
| Market | Active Properties | Monthly Revenue | Daily Rate | Avg. Occupancy |
|---|---|---|---|---|
| La Rivière-Enverse | 17 | $5,972 | $624.02 | 41% |
| Les Clefs | 30 | $5,741 | $323.11 | 44% |
| Épinac | 14 | $5,147 | $333.01 | 37% |
| Manigod | 194 | $4,127 | $427.80 | 40% |
| Saint-Germain-au-Mont-d'Or | 10 | $3,928 | $316.02 | 40% |
| Puligny-Montrachet | 11 | $3,908 | $398.00 | 44% |
| Dommartin | 11 | $3,905 | $327.00 | 36% |
| Saint-Nicolas-la-Chapelle | 27 | $3,381 | $375.70 | 43% |
| Juliénas | 11 | $3,378 | $292.32 | 46% |
| Corgoloin | 10 | $3,314 | $296.49 | 44% |