Montmorot Airbnb Market Analysis 2025: Short Term Rental Data & Vacation Rental Statistics in Bourgogne – Franche-Comté, France
Is Airbnb profitable in Montmorot in 2025? Explore comprehensive Airbnb analytics for Montmorot, Bourgogne – Franche-Comté, France to uncover income potential. This 2025 STR market report for Montmorot, based on AirROI data from April 2024 to March 2025, reveals key trends in the niche market of 17 active listings.
Whether you're considering an Airbnb investment in Montmorot, optimizing your existing vacation rental, or exploring rental arbitrage opportunities, understanding the Montmorot Airbnb data is crucial. Leveraging the low regulation environment is key to maximizing your short term rental income potential. Let's dive into the specifics.
Key Montmorot Airbnb Performance Metrics Overview
Monthly Airbnb Revenue Variations & Income Potential in Montmorot (2025)
Understanding the monthly revenue variations for Airbnb listings in Montmorot is key to maximizing your short term rental income potential. Seasonality significantly impacts earnings. Our analysis, based on data from the past 12 months, shows that the peak revenue month for STRs in Montmorot is typically August, while January often presents the lowest earnings, highlighting opportunities for strategic pricing adjustments during shoulder and low seasons. Explore the typical Airbnb income in Montmorot across different performance tiers:
- Best-in-class properties (Top 10%) achieve $2,020+ monthly, often utilizing dynamic pricing and superior guest experiences.
- Strong performing properties (Top 25%) earn $1,346 or more, indicating effective management and desirable locations/amenities.
- Typical properties (Median) generate around $943 per month, representing the average market performance.
- Entry-level properties (Bottom 25%) see earnings around $493, often with potential for optimization.
Average Monthly Airbnb Earnings Trend in Montmorot
Montmorot Airbnb Occupancy Rate Trends (2025)
Maximize your bookings by understanding the Montmorot STR occupancy trends. Seasonal demand shifts significantly influence how often properties are booked. Typically, Septembersees the highest demand (peak season occupancy), while January experiences the lowest (low season). Effective strategies, like adjusting minimum stays or offering promotions, can boost occupancy during slower periods. Here's how different property tiers perform in Montmorot:
- Best-in-class properties (Top 10%) achieve 76%+ occupancy, indicating high desirability and potentially optimized availability.
- Strong performing properties (Top 25%) maintain 68% or higher occupancy, suggesting good market fit and guest satisfaction.
- Typical properties (Median) have an occupancy rate around 40%.
- Entry-level properties (Bottom 25%) average 19% occupancy, potentially facing higher vacancy.
Average Monthly Occupancy Rate Trend in Montmorot
Average Daily Rate (ADR) Airbnb Trends in Montmorot (2025)
Effective short term rental pricing strategy in Montmorot involves understanding monthly ADR fluctuations. The Average Daily Rate (ADR) for Airbnb in Montmorot typically peaks in August and dips lowest during March. Leveraging Airbnb dynamic pricing tools or strategies based on this seasonality can significantly boost revenue. Here's a look at the typical nightly rates achieved:
- Best-in-class properties (Top 10%) command rates of $119+ per night, often due to premium features or locations.
- Strong performing properties (Top 25%) achieve nightly rates of $100 or more.
- Typical properties (Median) charge around $64 per night.
- Entry-level properties (Bottom 25%) earn around $50 per night.
Average Daily Rate (ADR) Trend by Month in Montmorot
Get Live Montmorot Market Intelligence 👇

Explore Real-time Analytics
Airbnb Seasonality Analysis & Trends in Montmorot (2025)
Peak Season (August, May, July)
- Revenue averages $1,390 per month
- Occupancy rates average 51.9%
- Daily rates average $83
Shoulder Season
- Revenue averages $1,002 per month
- Occupancy maintains around 46.1%
- Daily rates hold near $79
Low Season (January, March, December)
- Revenue drops to average $633 per month
- Occupancy decreases to average 31.3%
- Daily rates adjust to average $71
Seasonality Insights for Montmorot
- The Airbnb seasonality in Montmorot shows highly seasonal trends requiring careful strategy. While the sections above show seasonal averages, it's also insightful to look at the extremes:
- During the high season, the absolute peak month showcases Montmorot's highest earning potential, with monthly revenues capable of climbing to $1,569, occupancy reaching a high of 59.6%, and ADRs peaking at $84.
- Conversely, the slowest single month of the year, typically falling within the low season, marks the market's lowest point. In this month, revenue might dip to $591, occupancy could drop to 28.0%, and ADRs may adjust down to $70.
- Understanding both the seasonal averages and these monthly peaks and troughs in revenue, occupancy, and ADR is crucial for maximizing your Airbnb profit potential in Montmorot.
Seasonal Strategies for Maximizing Profit
- Peak Season: Maximize revenue through premium pricing and potentially longer minimum stays. Ensure high availability.
- Low Season: Offer competitive pricing, special promotions (e.g., extended stay discounts), and flexible cancellation policies. Target off-season travelers like remote workers or budget-conscious guests.
- Shoulder Seasons: Implement dynamic pricing that balances peak and low rates. Target weekend travelers or specific events. Offer slightly more flexible terms than peak season.
- Regularly analyze your own performance against these Montmorot seasonality benchmarks and adjust your pricing and availability strategy accordingly.
Best Areas for Airbnb Investment in Montmorot (2025)
Exploring the top neighborhoods for short-term rentals in Montmorot? This section highlights key areas, outlining why they are attractive for hosts and guests, along with notable local attractions. Consider these locations based on your target guest profile and investment strategy.
| Neighborhood / Area | Why Host Here? (Target Guests & Appeal) | Key Attractions & Landmarks |
|---|---|---|
| Montmorot Centre | A charming town center known for its historical architecture and local amenities. Ideal for guests who want to experience the local culture and enjoy easy access to shops and cafes. | Église Saint Marie, Local markets, Chateau de Montmorot, Nearby parks, Café and Bistro culture |
| La Sorne | A picturesque area located along the Sorne river, perfect for nature lovers. It offers opportunities for outdoor activities such as hiking and fishing. | La Sorne river, Hiking trails, Picnic areas, Wildlife watching |
| Dole | Nearby Dole, a larger city, offers rich history and tourist attractions, making it a great option for those who wish to explore historical sites while staying close to Montmorot. | Birthplace of Louis Pasteur, Dole's historic town center, Saint-Jean Church, Dole Museum |
| Arc et Senans | Famous for its Royal Saltworks, a UNESCO World Heritage site. Ideal for cultural enthusiasts and history buffs. | Royal Saltworks, Local museums, Scenic walking paths |
| Besançon | A bit further away, but known for its well-preserved old town and fortress, making it suitable for day trips and cultural excursions. | Citadel of Besançon, Museum of Time, Montfaucon Abbey, Cultural events |
| St. Claude | Known for its scenic beauty and outdoor activities. Attracts visitors interested in mountain sports and nature. | Jura Mountains, Ski resorts, Lakes and rivers, Hiking routes |
| Lons-le-Saunier | A nearby town known for its wine production and thermal baths, appealing to foodies and wellness travelers. | Lons-le-Saunier market, Vineyards, Thermal spas, Cultural festivals |
| Les Rousses | A beautiful area in the Jura mountains, perfect for winter sports and summer hiking. Attractive to both winter sports enthusiasts and nature lovers. | Ski resorts, Lakes, Hiking trails, Nature parks |
Understanding Airbnb License Requirements & STR Laws in Montmorot (2025)
While Montmorot, Bourgogne – Franche-Comté, France currently shows low STR regulations, specific Airbnb license requirements might still exist or change. Always verify the latest short term rental regulations and Airbnb license requirements directly with local government authorities for Montmorot to ensure full compliance before hosting.
(Source: AirROI data, 2025, based on 6% licensed listings)
Top Performing Airbnb Properties in Montmorot (2025)
Benchmark your potential! Explore examples of top-performing Airbnb properties in Montmorotbased on Trailing Twelve Month (TTM) revenue. Analyze their characteristics, revenue, occupancy rate, and ADR to understand what drives success in this market.
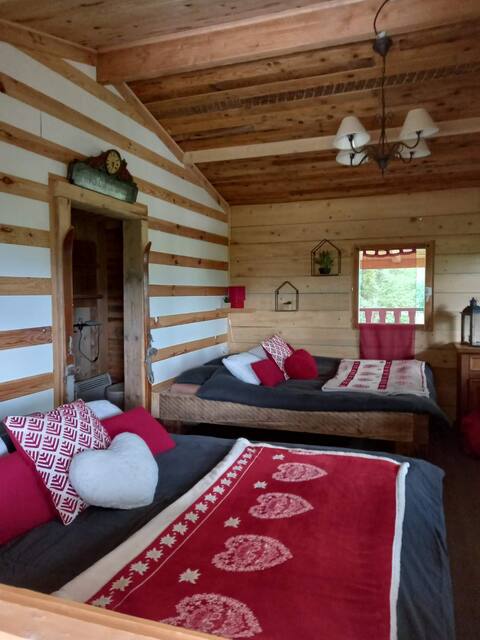
Chalet cocooning pleine nature
Entire Place • 1 bedroom

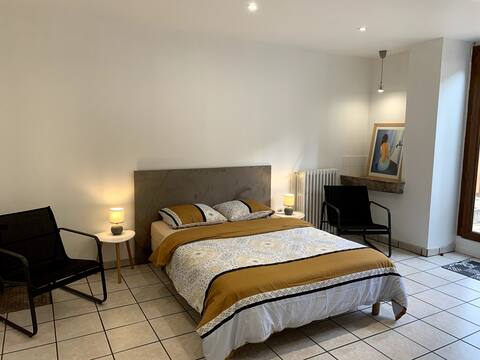
The Montmorot stopover - Calm & Serenity -Garden
Entire Place • 1 bedroom

P'tit Montciel on the heights of Lons
Entire Place • 1 bedroom
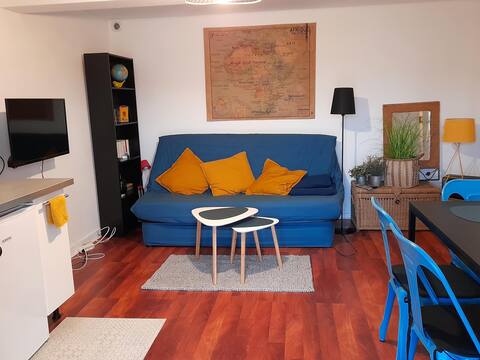
Cozy apartment Lons - Montmorot
Entire Place • 2 bedrooms
Nice apartment on the heights of Lons le S.
Entire Place • 1 bedroom
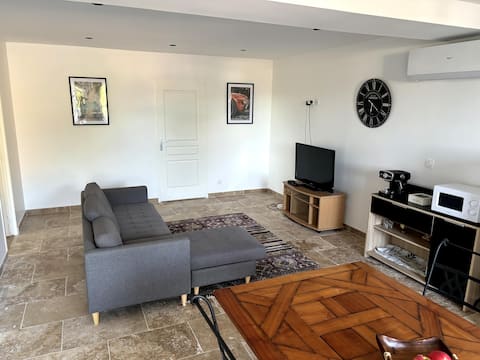
Beautiful castle seemingly air-conditioned
Entire Place • 2 bedrooms
Note: Performance varies based on location, size, amenities, seasonality, and management quality. Data reflects the past 12 months.
Top Performing Airbnb Hosts in Montmorot (2025)
Learn from the best! This table showcases top-performing Airbnb hosts in Montmorot based on the number of properties managed and estimated total revenue over the past year. Analyze their scale and performance metrics.
| Host Name | Properties | Grossing Revenue | Stay Reviews | Avg Rating |
|---|---|---|---|---|
| Samantha Et Fabien | 1 | $22,773 | 74 | 4.89/5.0 |
| Stanley | 1 | $20,300 | 40 | 4.88/5.0 |
| Nathalie | 1 | $19,901 | 286 | 4.99/5.0 |
| Jonathan | 1 | $15,340 | 11 | 4.27/5.0 |
| Stéphanie | 1 | $14,469 | 100 | 4.94/5.0 |
| Roger | 1 | $13,294 | 61 | 4.44/5.0 |
| Lucienne | 1 | $11,713 | 339 | 4.91/5.0 |
| Joelle Et Francois | 2 | $10,907 | 5 | 2.20/5.0 |
| Marianne | 1 | $9,860 | 22 | 4.95/5.0 |
| Anne | 1 | $8,979 | 151 | 4.93/5.0 |
Analyzing the strategies of top hosts, such as their property selection, pricing, and guest communication, can offer valuable lessons for optimizing your own Airbnb operations in Montmorot.
Dive Deeper: Advanced Montmorot STR Market Data (2025)
Ready to unlock more insights? AirROI provides access to advanced metrics and comprehensive Airbnb data for Montmorot. Explore detailed analytics beyond this report to refine your investment strategy, optimize pricing, and maximize your vacation rental profits.
Explore Advanced MetricsMontmorot Short-Term Rental Market Composition (2025): Property & Room Types
Room Type Distribution
Property Type Distribution
Market Composition Insights for Montmorot
- The Montmorot Airbnb market composition is heavily skewed towards Entire Home/Apt listings, which make up 70.6% of the 17 active rentals. This indicates strong guest preference for privacy and space.
- Looking at the property type distribution in Montmorot, Apartment/Condo properties are the most common (64.7%), reflecting the local real estate landscape.
- Houses represent a significant 23.5% portion, catering likely to families or larger groups.
- The presence of 11.8% Hotel/Boutique listings indicates integration with traditional hospitality.
Montmorot Airbnb Room Capacity Analysis (2025): Bedroom Distribution
Distribution of Listings by Number of Bedrooms
Room Capacity Insights for Montmorot
- The dominant room capacity in Montmorot is 1 bedroom listings, making up 58.8% of the market. This suggests a strong demand for properties suitable for couples or solo travelers.
- Together, 1 bedroom and 2 bedrooms properties represent 82.3% of the active Airbnb listings in Montmorot, indicating a high concentration in these sizes.
- With over half the market (58.8%) consisting of studios or 1-bedroom units, Montmorot is particularly well-suited for individuals or couples.
Montmorot Vacation Rental Guest Capacity Trends (2025)
Distribution of Listings by Guest Capacity
Guest Capacity Insights for Montmorot
- The most common guest capacity trend in Montmorot vacation rentals is listings accommodating 4 guests (41.2%). This suggests the primary traveler segment is likely small families or groups.
- Properties designed for 4 guests and 2 guests dominate the Montmorot STR market, accounting for 64.7% of listings.
- On average, properties in Montmorot are equipped to host 2.8 guests.
Montmorot Airbnb Booking Patterns (2025): Available vs. Booked Days
Available Days Distribution
Booked Days Distribution
Booking Pattern Insights for Montmorot
- The most common availability pattern in Montmorot falls within the 271-366 days range, representing 35.3% of listings. This suggests many properties have significant open periods on their calendars.
- Approximately 58.8% of listings show high availability (181+ days open annually), indicating potential for increased bookings or specific owner usage patterns.
- For booked days, the 181-270 days range is most frequent in Montmorot (35.3%), reflecting common guest stay durations or potential owner blocking patterns.
- A notable 47.1% of properties secure long booking periods (181+ days booked per year), highlighting successful long-term rental strategies or significant owner usage.
Montmorot Airbnb Minimum Stay Requirements Analysis
Distribution of Listings by Minimum Night Requirement
1 Night
7 listings
41.2% of total
2 Nights
5 listings
29.4% of total
3 Nights
1 listings
5.9% of total
4-6 Nights
1 listings
5.9% of total
30+ Nights
3 listings
17.6% of total
Key Insights
- The most prevalent minimum stay requirement in Montmorot is 1 Night, adopted by 41.2% of listings. This highlights the market's preference for shorter, flexible bookings.
- A strong majority (70.6%) of the Montmorot Airbnb data shows acceptance of very short stays (1-2 nights), indicating a dynamic, high-turnover market.
- A significant segment (17.6%) caters to monthly stays (30+ nights) in Montmorot, pointing to opportunities in the extended-stay market.
Recommendations
- Align with the market by considering a 1 Night minimum stay, as 41.2% of Montmorot hosts use this setting.
- Explore offering discounts for stays of 30+ nights to attract the 17.6% of the market seeking extended stays.
- Adjust minimum nights based on seasonality – potentially shorter during low season and longer during peak demand periods in Montmorot.
Montmorot Airbnb Cancellation Policy Trends Analysis (2025)
Flexible
8 listings
50% of total
Moderate
4 listings
25% of total
Firm
2 listings
12.5% of total
Strict
2 listings
12.5% of total
Cancellation Policy Insights for Montmorot
- The prevailing Airbnb cancellation policy trend in Montmorot is Flexible, used by 50% of listings.
- The market strongly favors guest-friendly terms, with 75.0% of listings offering Flexible or Moderate policies. This suggests guests in Montmorot may expect booking flexibility.
Recommendations for Hosts
- Consider adopting a Flexible policy to align with the 50% market standard in Montmorot.
- Using a Strict policy might deter some guests, as only 12.5% of listings use it. Evaluate if potential revenue protection outweighs possible lower booking rates.
- Regularly review your cancellation policy against competitors and market demand shifts in Montmorot.
Montmorot STR Booking Lead Time Analysis (2025)
Average Booking Lead Time by Month
Booking Lead Time Insights for Montmorot
- The overall average booking lead time for vacation rentals in Montmorot is 36 days.
- Guests book furthest in advance for stays during May (average 74 days), likely coinciding with peak travel demand or local events.
- The shortest booking windows occur for stays in November (average 20 days), indicating more last-minute travel plans during this time.
- Seasonally, Spring (43 days avg.) sees the longest lead times, while Fall (35 days avg.) has the shortest, reflecting typical travel planning cycles.
Recommendations for Hosts
- Use the overall average lead time (36 days) as a baseline for your pricing and availability strategy in Montmorot.
- For May stays, consider implementing length-of-stay discounts or slightly higher rates for bookings made less than 74 days out to capitalize on advance planning.
- Target marketing efforts for the Spring season well in advance (at least 43 days) to capture early planners.
- Monitor your own booking lead times against these Montmorot averages to identify opportunities for dynamic pricing adjustments.
Popular & Essential Airbnb Amenities in Montmorot (2025)
Amenity Prevalence
Amenity Insights for Montmorot
- Essential amenities in Montmorot that guests expect include: TV. Lacking these (this) could significantly impact bookings.
- Popular amenities like Heating, Smoke alarm, Essentials are common but not universal. Offering these can provide a competitive edge.
Recommendations for Hosts
- Ensure your listing includes all essential amenities for Montmorot: TV.
- Consider adding popular differentiators like Heating or Smoke alarm to increase appeal.
- Highlight unique or less common amenities you offer (e.g., hot tub, dedicated workspace, EV charger) in your listing description and photos.
- Regularly check competitor amenities in Montmorot to stay competitive.
Montmorot Airbnb Guest Demographics & Profile Analysis (2025)
Guest Profile Summary for Montmorot
- The typical guest profile for Airbnb in Montmorot consists of primarily domestic travelers (86%), often arriving from nearby Paris, typically belonging to the Post-2000s (Gen Z/Alpha) group (50%), primarily speaking French or English.
- Domestic travelers account for 85.5% of guests.
- Key international markets include France (85.5%) and Belgium (3.8%).
- Top languages spoken are French (44.4%) followed by English (31.8%).
- A significant demographic segment is the Post-2000s (Gen Z/Alpha) group, representing 50% of guests.
Recommendations for Hosts
- Target domestic marketing efforts towards travelers from Paris and Lyon.
- Tailor amenities and listing descriptions to appeal to the dominant Post-2000s (Gen Z/Alpha) demographic (e.g., highlight fast WiFi, smart home features, local guides).
- Highlight unique local experiences or amenities relevant to the primary guest profile.
- Consider seasonal promotions aligned with peak travel times for key origin markets.
Nearby Short-Term Rental Market Comparison
How does the Montmorot Airbnb market stack up against its neighbors? Compare key performance metrics like average monthly revenue, ADR, and occupancy rates in surrounding areas to understand the broader regional STR landscape.
| Market | Active Properties | Monthly Revenue | Daily Rate | Avg. Occupancy |
|---|---|---|---|---|
| La Rivière-Enverse | 17 | $5,972 | $624.02 | 41% |
| Les Clefs | 30 | $5,741 | $323.11 | 44% |
| Épinac | 14 | $5,147 | $333.01 | 37% |
| Manigod | 194 | $4,127 | $427.80 | 40% |
| Saint-Germain-au-Mont-d'Or | 10 | $3,928 | $316.02 | 40% |
| Puligny-Montrachet | 11 | $3,908 | $398.00 | 44% |
| Dommartin | 11 | $3,905 | $327.00 | 36% |
| Saint-Nicolas-la-Chapelle | 27 | $3,381 | $375.70 | 43% |
| Juliénas | 11 | $3,378 | $292.32 | 46% |
| Corgoloin | 10 | $3,314 | $296.49 | 44% |