Louhans Airbnb Market Analysis 2025: Short Term Rental Data & Vacation Rental Statistics in Bourgogne – Franche-Comté, France
Is Airbnb profitable in Louhans in 2025? Explore comprehensive Airbnb analytics for Louhans, Bourgogne – Franche-Comté, France to uncover income potential. This 2025 STR market report for Louhans, based on AirROI data from April 2024 to March 2025, reveals key trends in the niche market of 21 active listings.
Whether you're considering an Airbnb investment in Louhans, optimizing your existing vacation rental, or exploring rental arbitrage opportunities, understanding the Louhans Airbnb data is crucial. Understanding the local regulations is key to maximizing your short term rental income potential. Let's dive into the specifics.
Key Louhans Airbnb Performance Metrics Overview
Monthly Airbnb Revenue Variations & Income Potential in Louhans (2025)
Understanding the monthly revenue variations for Airbnb listings in Louhans is key to maximizing your short term rental income potential. Seasonality significantly impacts earnings. Our analysis, based on data from the past 12 months, shows that the peak revenue month for STRs in Louhans is typically August, while February often presents the lowest earnings, highlighting opportunities for strategic pricing adjustments during shoulder and low seasons. Explore the typical Airbnb income in Louhans across different performance tiers:
- Best-in-class properties (Top 10%) achieve $1,988+ monthly, often utilizing dynamic pricing and superior guest experiences.
- Strong performing properties (Top 25%) earn $1,256 or more, indicating effective management and desirable locations/amenities.
- Typical properties (Median) generate around $799 per month, representing the average market performance.
- Entry-level properties (Bottom 25%) see earnings around $413, often with potential for optimization.
Average Monthly Airbnb Earnings Trend in Louhans
Louhans Airbnb Occupancy Rate Trends (2025)
Maximize your bookings by understanding the Louhans STR occupancy trends. Seasonal demand shifts significantly influence how often properties are booked. Typically, Julysees the highest demand (peak season occupancy), while February experiences the lowest (low season). Effective strategies, like adjusting minimum stays or offering promotions, can boost occupancy during slower periods. Here's how different property tiers perform in Louhans:
- Best-in-class properties (Top 10%) achieve 68%+ occupancy, indicating high desirability and potentially optimized availability.
- Strong performing properties (Top 25%) maintain 53% or higher occupancy, suggesting good market fit and guest satisfaction.
- Typical properties (Median) have an occupancy rate around 34%.
- Entry-level properties (Bottom 25%) average 18% occupancy, potentially facing higher vacancy.
Average Monthly Occupancy Rate Trend in Louhans
Average Daily Rate (ADR) Airbnb Trends in Louhans (2025)
Effective short term rental pricing strategy in Louhans involves understanding monthly ADR fluctuations. The Average Daily Rate (ADR) for Airbnb in Louhans typically peaks in May and dips lowest during March. Leveraging Airbnb dynamic pricing tools or strategies based on this seasonality can significantly boost revenue. Here's a look at the typical nightly rates achieved:
- Best-in-class properties (Top 10%) command rates of $130+ per night, often due to premium features or locations.
- Strong performing properties (Top 25%) achieve nightly rates of $114 or more.
- Typical properties (Median) charge around $84 per night.
- Entry-level properties (Bottom 25%) earn around $54 per night.
Average Daily Rate (ADR) Trend by Month in Louhans
Get Live Louhans Market Intelligence 👇

Explore Real-time Analytics
Airbnb Seasonality Analysis & Trends in Louhans (2025)
Peak Season (August, July, April)
- Revenue averages $1,320 per month
- Occupancy rates average 47.8%
- Daily rates average $95
Shoulder Season
- Revenue averages $987 per month
- Occupancy maintains around 39.0%
- Daily rates hold near $93
Low Season (January, February, March)
- Revenue drops to average $518 per month
- Occupancy decreases to average 27.2%
- Daily rates adjust to average $80
Seasonality Insights for Louhans
- The Airbnb seasonality in Louhans shows highly seasonal trends requiring careful strategy. While the sections above show seasonal averages, it's also insightful to look at the extremes:
- During the high season, the absolute peak month showcases Louhans's highest earning potential, with monthly revenues capable of climbing to $1,436, occupancy reaching a high of 48.5%, and ADRs peaking at $97.
- Conversely, the slowest single month of the year, typically falling within the low season, marks the market's lowest point. In this month, revenue might dip to $393, occupancy could drop to 22.9%, and ADRs may adjust down to $80.
- Understanding both the seasonal averages and these monthly peaks and troughs in revenue, occupancy, and ADR is crucial for maximizing your Airbnb profit potential in Louhans.
Seasonal Strategies for Maximizing Profit
- Peak Season: Maximize revenue through premium pricing and potentially longer minimum stays. Ensure high availability.
- Low Season: Offer competitive pricing, special promotions (e.g., extended stay discounts), and flexible cancellation policies. Target off-season travelers like remote workers or budget-conscious guests.
- Shoulder Seasons: Implement dynamic pricing that balances peak and low rates. Target weekend travelers or specific events. Offer slightly more flexible terms than peak season.
- Regularly analyze your own performance against these Louhans seasonality benchmarks and adjust your pricing and availability strategy accordingly.
Best Areas for Airbnb Investment in Louhans (2025)
Exploring the top neighborhoods for short-term rentals in Louhans? This section highlights key areas, outlining why they are attractive for hosts and guests, along with notable local attractions. Consider these locations based on your target guest profile and investment strategy.
| Neighborhood / Area | Why Host Here? (Target Guests & Appeal) | Key Attractions & Landmarks |
|---|---|---|
| Centre-ville de Louhans | Cœur historique de Louhans, parfait pour les touristes souhaitant explorer la charmante architecture et l'authenticité française. Proche des marchés et boutiques locales. | Bourgogne Museum, Les Halles de Louhans, Église Saint-Pierre, Place de la République |
| Quartier de la Gare | Zone accessible et pratique, idéale pour les voyageurs d'affaires et les visiteurs de passage. Proximité avec les transports en commun. | Gare SNCF de Louhans, Restaurants locaux, Cafés |
| Parc des Expositions | Emplacement idéal pour les visiteurs participant à des événements et salons. Proche des infrastructures pour entreprises. | Parc des Expositions de Louhans, Hôtels et restaurants à proximité |
| Rue de la République | Artère principale de Louhans, offrant divers commerces et services. Un endroit animé et populaire chez les visiteurs. | Boutiques locales, Restaurants, Cafés, Galeries d'art |
| Les bords de la Seille | Zone pittoresque idéale pour les amoureux de la nature. Excellent pour ceux qui recherchent un séjour paisible avec de belles promenades. | Promenade le long de la Seille, Espaces verts, Pêche |
| Les alentours de Louhans | Pour ceux qui préfèrent un cadre rural, avec des maisons avec jardin. Parfait pour des séjours long terme dans la tranquillité. | Vignobles de Bourgogne, Cueillette de fruits, Randonnées |
| Château de Louhans | Site historique fascinant attirant les amateurs d'histoire et d'architecture. Établissement populaire pour des visites guidées. | Visites guidées du château, Événements culturels, Expositions |
| Zone industrielle de Louhans | Attraction pour les professionnels en business et pour ceux qui recherchent des logements temporaires. Accessible et proche des grands axes routiers. | Commodités locales, Accès aux autoroutes, Restaurants |
Understanding Airbnb License Requirements & STR Laws in Louhans (2025)
With 14% of listings showing registration in 2025, understanding potential Airbnb license requirements is crucial in Louhans. Always verify the latest short term rental regulations and Airbnb license requirements directly with local government authorities for Louhans to ensure full compliance before hosting.
(Source: AirROI data, 2025, based on 14% licensed listings)
Top Performing Airbnb Properties in Louhans (2025)
Benchmark your potential! Explore examples of top-performing Airbnb properties in Louhansbased on Trailing Twelve Month (TTM) revenue. Analyze their characteristics, revenue, occupancy rate, and ADR to understand what drives success in this market.
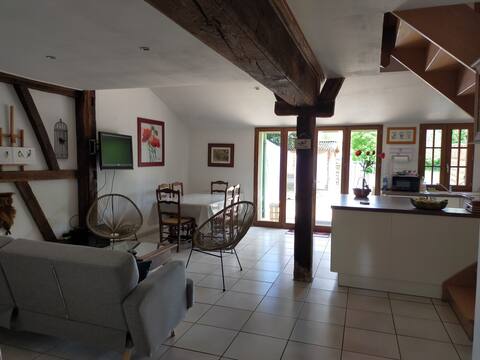
Louhans: pleasant house "La Tanière de Poukou"
Entire Place • 3 bedrooms
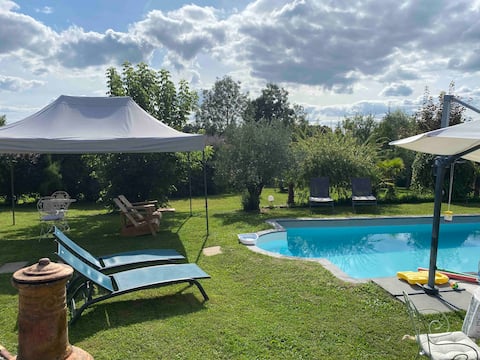
Charming bressane farmhouse 2 bedrooms for 5 people
Private Room • 2 bedrooms
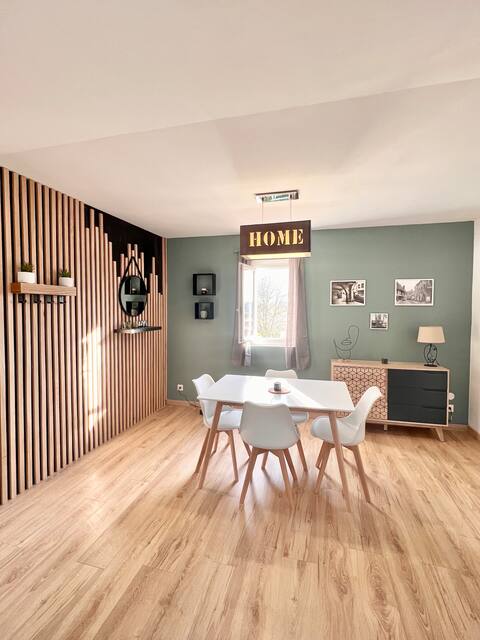
Cozy apartment close to the center
Entire Place • 1 bedroom

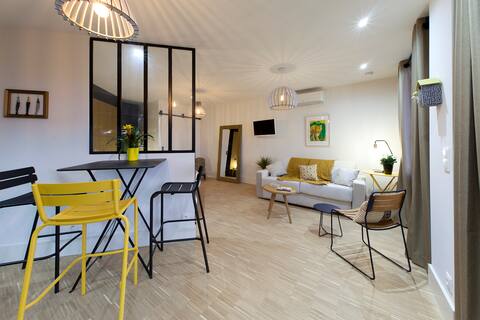
Atypical house Louhans center130 m2
Entire Place • 1 bedroom
Apartement Louhans - France
Entire Place • 1 bedroom
Jad Farm
Private Room • N/A
Note: Performance varies based on location, size, amenities, seasonality, and management quality. Data reflects the past 12 months.
Top Performing Airbnb Hosts in Louhans (2025)
Learn from the best! This table showcases top-performing Airbnb hosts in Louhans based on the number of properties managed and estimated total revenue over the past year. Analyze their scale and performance metrics.
| Host Name | Properties | Grossing Revenue | Stay Reviews | Avg Rating |
|---|---|---|---|---|
| Danielle | 2 | $31,660 | 56 | 4.91/5.0 |
| Host #13410881 | 3 | $26,612 | 76 | 4.91/5.0 |
| Magali & Serge | 2 | $24,489 | 318 | 4.73/5.0 |
| Véronique | 1 | $22,637 | 56 | 4.68/5.0 |
| Laurent | 2 | $19,760 | 122 | 4.91/5.0 |
| Mickael | 1 | $14,962 | 32 | 4.84/5.0 |
| René | 1 | $8,380 | 74 | 4.58/5.0 |
| Host #340463671 | 1 | $7,803 | 7 | 4.86/5.0 |
| Isabelle | 2 | $6,627 | 74 | 4.83/5.0 |
| Emeline Et Annie | 1 | $6,253 | 274 | 4.90/5.0 |
Analyzing the strategies of top hosts, such as their property selection, pricing, and guest communication, can offer valuable lessons for optimizing your own Airbnb operations in Louhans.
Dive Deeper: Advanced Louhans STR Market Data (2025)
Ready to unlock more insights? AirROI provides access to advanced metrics and comprehensive Airbnb data for Louhans. Explore detailed analytics beyond this report to refine your investment strategy, optimize pricing, and maximize your vacation rental profits.
Explore Advanced MetricsLouhans Short-Term Rental Market Composition (2025): Property & Room Types
Room Type Distribution
Property Type Distribution
Market Composition Insights for Louhans
- The Louhans Airbnb market composition is heavily skewed towards Entire Home/Apt listings, which make up 81% of the 21 active rentals. This indicates strong guest preference for privacy and space.
- Looking at the property type distribution in Louhans, Apartment/Condo properties are the most common (61.9%), reflecting the local real estate landscape.
- Houses represent a significant 28.6% portion, catering likely to families or larger groups.
- The presence of 9.5% Hotel/Boutique listings indicates integration with traditional hospitality.
Louhans Airbnb Room Capacity Analysis (2025): Bedroom Distribution
Distribution of Listings by Number of Bedrooms
Room Capacity Insights for Louhans
- The dominant room capacity in Louhans is 1 bedroom listings, making up 38.1% of the market. This suggests a strong demand for properties suitable for couples or solo travelers.
- Together, 1 bedroom and 2 bedrooms properties represent 66.7% of the active Airbnb listings in Louhans, indicating a high concentration in these sizes.
- Listings with 3+ bedrooms (9.5%) represent a smaller niche, potentially indicating an underserved market for larger group accommodations in Louhans.
Louhans Vacation Rental Guest Capacity Trends (2025)
Distribution of Listings by Guest Capacity
Guest Capacity Insights for Louhans
- The most common guest capacity trend in Louhans vacation rentals is listings accommodating 4 guests (38.1%). This suggests the primary traveler segment is likely small families or groups.
- Properties designed for 4 guests and 2 guests dominate the Louhans STR market, accounting for 61.9% of listings.
- Listings for large groups (6+ guests) are relatively rare (4.8%), potentially indicating an opportunity for hosts targeting this segment in Louhans.
- On average, properties in Louhans are equipped to host 2.8 guests.
Louhans Airbnb Booking Patterns (2025): Available vs. Booked Days
Available Days Distribution
Booked Days Distribution
Booking Pattern Insights for Louhans
- The most common availability pattern in Louhans falls within the 181-270 days range, representing 42.9% of listings. This suggests many properties have significant open periods on their calendars.
- Approximately 76.2% of listings show high availability (181+ days open annually), indicating potential for increased bookings or specific owner usage patterns.
- For booked days, the 91-180 days range is most frequent in Louhans (42.9%), reflecting common guest stay durations or potential owner blocking patterns.
- A notable 23.8% of properties secure long booking periods (181+ days booked per year), highlighting successful long-term rental strategies or significant owner usage.
Louhans Airbnb Minimum Stay Requirements Analysis
Distribution of Listings by Minimum Night Requirement
1 Night
8 listings
50% of total
2 Nights
6 listings
37.5% of total
4-6 Nights
1 listings
6.3% of total
30+ Nights
1 listings
6.3% of total
Key Insights
- The most prevalent minimum stay requirement in Louhans is 1 Night, adopted by 50% of listings. This highlights the market's preference for shorter, flexible bookings.
- A strong majority (87.5%) of the Louhans Airbnb data shows acceptance of very short stays (1-2 nights), indicating a dynamic, high-turnover market.
Recommendations
- Align with the market by considering a 1 Night minimum stay, as 50% of Louhans hosts use this setting.
- Explore offering discounts for stays of 30+ nights to attract the 6.3% of the market seeking extended stays.
- Adjust minimum nights based on seasonality – potentially shorter during low season and longer during peak demand periods in Louhans.
Louhans Airbnb Cancellation Policy Trends Analysis (2025)
Refundable
3 listings
16.7% of total
Flexible
6 listings
33.3% of total
Firm
2 listings
11.1% of total
Strict
7 listings
38.9% of total
Cancellation Policy Insights for Louhans
- The prevailing Airbnb cancellation policy trend in Louhans is Strict, used by 38.9% of listings.
- There's a relatively balanced mix between guest-friendly (33.3%) and stricter (50.0%) policies, offering choices for different guest needs.
Recommendations for Hosts
- Consider adopting a Strict policy to align with the 38.9% market standard in Louhans.
- With 38.9% using Strict terms, this is a viable option in Louhans, particularly for high-value properties or during peak demand periods.
- Regularly review your cancellation policy against competitors and market demand shifts in Louhans.
Louhans STR Booking Lead Time Analysis (2025)
Average Booking Lead Time by Month
Booking Lead Time Insights for Louhans
- The overall average booking lead time for vacation rentals in Louhans is 46 days.
- Guests book furthest in advance for stays during July (average 109 days), likely coinciding with peak travel demand or local events.
- The shortest booking windows occur for stays in October (average 19 days), indicating more last-minute travel plans during this time.
- Seasonally, Summer (62 days avg.) sees the longest lead times, while Fall (25 days avg.) has the shortest, reflecting typical travel planning cycles.
Recommendations for Hosts
- Use the overall average lead time (46 days) as a baseline for your pricing and availability strategy in Louhans.
- For July stays, consider implementing length-of-stay discounts or slightly higher rates for bookings made less than 109 days out to capitalize on advance planning.
- Target marketing efforts for the Summer season well in advance (at least 62 days) to capture early planners.
- Monitor your own booking lead times against these Louhans averages to identify opportunities for dynamic pricing adjustments.
Popular & Essential Airbnb Amenities in Louhans (2025)
Amenity Prevalence
Amenity Insights for Louhans
- Essential amenities in Louhans that guests expect include: Wifi, TV, Heating. Lacking these (any) could significantly impact bookings.
- Popular amenities like Hair dryer, Kitchen, Hangers are common but not universal. Offering these can provide a competitive edge.
Recommendations for Hosts
- Ensure your listing includes all essential amenities for Louhans: Wifi, TV, Heating.
- Prioritize adding missing essentials: Wifi, TV, Heating.
- Consider adding popular differentiators like Hair dryer or Kitchen to increase appeal.
- Highlight unique or less common amenities you offer (e.g., hot tub, dedicated workspace, EV charger) in your listing description and photos.
- Regularly check competitor amenities in Louhans to stay competitive.
Louhans Airbnb Guest Demographics & Profile Analysis (2025)
Guest Profile Summary for Louhans
- The typical guest profile for Airbnb in Louhans consists of primarily domestic travelers (80%), often arriving from nearby Lyon, typically belonging to the Post-2000s (Gen Z/Alpha) group (50%), primarily speaking French or English.
- Domestic travelers account for 79.7% of guests.
- Key international markets include France (79.7%) and Switzerland (6.2%).
- Top languages spoken are French (38.8%) followed by English (30.8%).
- A significant demographic segment is the Post-2000s (Gen Z/Alpha) group, representing 50% of guests.
Recommendations for Hosts
- Target domestic marketing efforts towards travelers from Lyon and Paris.
- Tailor amenities and listing descriptions to appeal to the dominant Post-2000s (Gen Z/Alpha) demographic (e.g., highlight fast WiFi, smart home features, local guides).
- Highlight unique local experiences or amenities relevant to the primary guest profile.
- Consider seasonal promotions aligned with peak travel times for key origin markets.
Nearby Short-Term Rental Market Comparison
How does the Louhans Airbnb market stack up against its neighbors? Compare key performance metrics like average monthly revenue, ADR, and occupancy rates in surrounding areas to understand the broader regional STR landscape.
| Market | Active Properties | Monthly Revenue | Daily Rate | Avg. Occupancy |
|---|---|---|---|---|
| La Rivière-Enverse | 17 | $5,972 | $624.02 | 41% |
| Les Clefs | 30 | $5,741 | $323.11 | 44% |
| Épinac | 14 | $5,147 | $333.01 | 37% |
| Manigod | 194 | $4,127 | $427.80 | 40% |
| Saint-Germain-au-Mont-d'Or | 10 | $3,928 | $316.02 | 40% |
| Puligny-Montrachet | 11 | $3,908 | $398.00 | 44% |
| Dommartin | 11 | $3,905 | $327.00 | 36% |
| Saint-Nicolas-la-Chapelle | 27 | $3,381 | $375.70 | 43% |
| Juliénas | 11 | $3,378 | $292.32 | 46% |
| Corgoloin | 10 | $3,314 | $296.49 | 44% |