Boron Airbnb Market Analysis 2025: Short Term Rental Data & Vacation Rental Statistics in Bourgogne – Franche-Comté, France
Is Airbnb profitable in Boron in 2025? Explore comprehensive Airbnb analytics for Boron, Bourgogne – Franche-Comté, France to uncover income potential. This 2025 STR market report for Boron, based on AirROI data from April 2024 to March 2025, reveals key trends in the niche market of 19 active listings.
Whether you're considering an Airbnb investment in Boron, optimizing your existing vacation rental, or exploring rental arbitrage opportunities, understanding the Boron Airbnb data is crucial. Leveraging the low regulation environment is key to maximizing your short term rental income potential. Let's dive into the specifics.
Key Boron Airbnb Performance Metrics Overview
Monthly Airbnb Revenue Variations & Income Potential in Boron (2025)
Understanding the monthly revenue variations for Airbnb listings in Boron is key to maximizing your short term rental income potential. Seasonality significantly impacts earnings. Our analysis, based on data from the past 12 months, shows that the peak revenue month for STRs in Boron is typically August, while March often presents the lowest earnings, highlighting opportunities for strategic pricing adjustments during shoulder and low seasons. Explore the typical Airbnb income in Boron across different performance tiers:
- Best-in-class properties (Top 10%) achieve $6,101+ monthly, often utilizing dynamic pricing and superior guest experiences.
- Strong performing properties (Top 25%) earn $4,512 or more, indicating effective management and desirable locations/amenities.
- Typical properties (Median) generate around $2,970 per month, representing the average market performance.
- Entry-level properties (Bottom 25%) see earnings around $1,903, often with potential for optimization.
Average Monthly Airbnb Earnings Trend in Boron
Boron Airbnb Occupancy Rate Trends (2025)
Maximize your bookings by understanding the Boron STR occupancy trends. Seasonal demand shifts significantly influence how often properties are booked. Typically, Augustsees the highest demand (peak season occupancy), while March experiences the lowest (low season). Effective strategies, like adjusting minimum stays or offering promotions, can boost occupancy during slower periods. Here's how different property tiers perform in Boron:
- Best-in-class properties (Top 10%) achieve 66%+ occupancy, indicating high desirability and potentially optimized availability.
- Strong performing properties (Top 25%) maintain 45% or higher occupancy, suggesting good market fit and guest satisfaction.
- Typical properties (Median) have an occupancy rate around 32%.
- Entry-level properties (Bottom 25%) average 19% occupancy, potentially facing higher vacancy.
Average Monthly Occupancy Rate Trend in Boron
Average Daily Rate (ADR) Airbnb Trends in Boron (2025)
Effective short term rental pricing strategy in Boron involves understanding monthly ADR fluctuations. The Average Daily Rate (ADR) for Airbnb in Boron typically peaks in February and dips lowest during July. Leveraging Airbnb dynamic pricing tools or strategies based on this seasonality can significantly boost revenue. Here's a look at the typical nightly rates achieved:
- Best-in-class properties (Top 10%) command rates of $395+ per night, often due to premium features or locations.
- Strong performing properties (Top 25%) achieve nightly rates of $358 or more.
- Typical properties (Median) charge around $332 per night.
- Entry-level properties (Bottom 25%) earn around $283 per night.
Average Daily Rate (ADR) Trend by Month in Boron
Get Live Boron Market Intelligence 👇

Explore Real-time Analytics
Airbnb Seasonality Analysis & Trends in Boron (2025)
Peak Season (August, July, May)
- Revenue averages $5,573 per month
- Occupancy rates average 57.4%
- Daily rates average $328
Shoulder Season
- Revenue averages $2,941 per month
- Occupancy maintains around 30.1%
- Daily rates hold near $330
Low Season (January, February, March)
- Revenue drops to average $98 per month
- Occupancy decreases to average 1.1%
- Daily rates adjust to average $333
Seasonality Insights for Boron
- The Airbnb seasonality in Boron shows highly seasonal trends requiring careful strategy. While the sections above show seasonal averages, it's also insightful to look at the extremes:
- During the high season, the absolute peak month showcases Boron's highest earning potential, with monthly revenues capable of climbing to $6,654, occupancy reaching a high of 69.8%, and ADRs peaking at $335.
- Conversely, the slowest single month of the year, typically falling within the low season, marks the market's lowest point. In this month, revenue might dip to $0, occupancy could drop to 0.0%, and ADRs may adjust down to $326.
- Understanding both the seasonal averages and these monthly peaks and troughs in revenue, occupancy, and ADR is crucial for maximizing your Airbnb profit potential in Boron.
Seasonal Strategies for Maximizing Profit
- Peak Season: Maximize revenue through premium pricing and potentially longer minimum stays. Ensure high availability.
- Low Season: Offer competitive pricing, special promotions (e.g., extended stay discounts), and flexible cancellation policies. Target off-season travelers like remote workers or budget-conscious guests.
- Shoulder Seasons: Implement dynamic pricing that balances peak and low rates. Target weekend travelers or specific events. Offer slightly more flexible terms than peak season.
- Regularly analyze your own performance against these Boron seasonality benchmarks and adjust your pricing and availability strategy accordingly.
Best Areas for Airbnb Investment in Boron (2025)
Exploring the top neighborhoods for short-term rentals in Boron? This section highlights key areas, outlining why they are attractive for hosts and guests, along with notable local attractions. Consider these locations based on your target guest profile and investment strategy.
| Neighborhood / Area | Why Host Here? (Target Guests & Appeal) | Key Attractions & Landmarks |
|---|---|---|
| Bourgogne wine region | Famed for its exquisite wines and beautiful vineyards, this area attracts wine enthusiasts and tourists year-round. Ideal for those seeking a tranquil countryside retreat with plenty of wine tasting opportunities. | Côte d'Or vineyards, Château de Pommard, Hospices de Beaune, Beaune wine market, Nuit-Saint-Georges |
| Dijon | A historic city known for its preserved medieval architecture and gastronomy. A prime location for travelers interested in culture and culinary experiences. | Palace of the Dukes of Burgundy, Dijon mustard shops, Museum of Fine Arts, Les Halles market, Owl's Trail |
| Autun | Rich in Roman history and surrounded by beautiful landscapes, Autun is appealing for history buffs and nature enthusiasts. | The Temple of Janus, Autun Cathedral, Roman theater, Mount Beuvray, Parc Naturel Régional du Morvan |
| Chalon-sur-Saône | A vibrant town located on the Saône River, known for its art scene and as the birthplace of photography, making it attractive to visitors interested in culture and the arts. | Musée Nicephore Niépce, Chalon Cathedral, Bourgogne Canal, Theatre de Chalon, Place de l'Hôtel de Ville |
| Nevers | A charming town known for its ceramics and historical sites. It offers a peaceful atmosphere, perfect for relaxation and exploration. | Nevers Cathedral, Ducs de Bourgogne Palace, Saint-Etienne Cathedral, Ceramics Museum, The Loire River |
| Montbard | Known for its proximity to the picturesque village of Fontenay and the historical monastery, Montbard draws visitors looking for tranquility and exploration. | Abbey of Fontenay, Vezelay, Montbard Museum, Bicycle paths along the Canal de Bourgogne, Hiking trails |
| Cluny | Famous for its historical abbey and beautiful countryside. A great spot for travelers interested in history and rural tourism. | Cluny Abbey, Musée des arts et métiers, The Cluny vineyards, Scenic rural walks, Local markets |
| Beaune | The wine capital of Burgundy, Beaune attracts many visitors for its wine festivals and historical architecture. Ideal for wine lovers and tourists. | Hôtel-Dieu, Beaune wine cellars, Beaune market, Burgundy Wine Museum, Les Grands Jours de Bourgogne |
Understanding Airbnb License Requirements & STR Laws in Boron (2025)
While Boron, Bourgogne – Franche-Comté, France currently shows low STR regulations, specific Airbnb license requirements might still exist or change. Always verify the latest short term rental regulations and Airbnb license requirements directly with local government authorities for Boron to ensure full compliance before hosting.
(Source: AirROI data, 2025, finding no licensed listings among those analyzed)
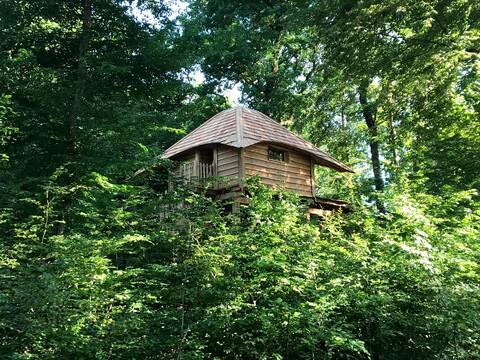
Top Performing Airbnb Properties in Boron (2025)
Benchmark your potential! Explore examples of top-performing Airbnb properties in Boronbased on Trailing Twelve Month (TTM) revenue. Analyze their characteristics, revenue, occupancy rate, and ADR to understand what drives success in this market.

Cabane Lov'IDE SPA Affût pour 2 personnes
Entire Place • 1 bedroom
Lov'Nid Passion Cabin for 2 people
Entire Place • 1 bedroom
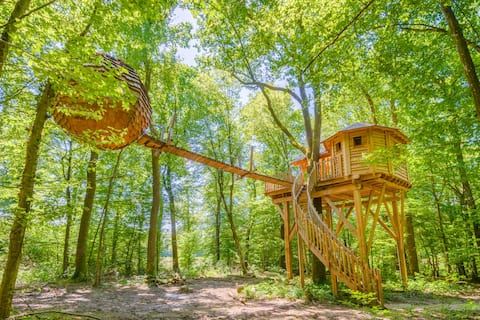
Lov 'nid SPA Cabin Comète for 2 people
Entire Place • 1 bedroom
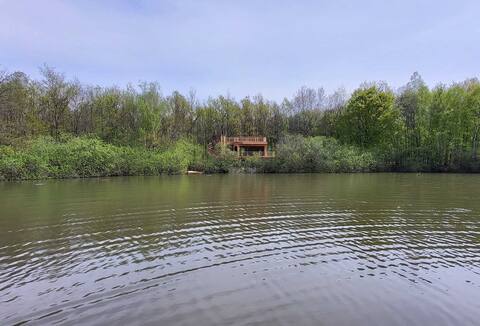
Cabane Spa Etincelle sur pilotis
Entire Place • 1 bedroom

Mirror SPA Cabin for 2 people
Entire Place • 1 bedroom
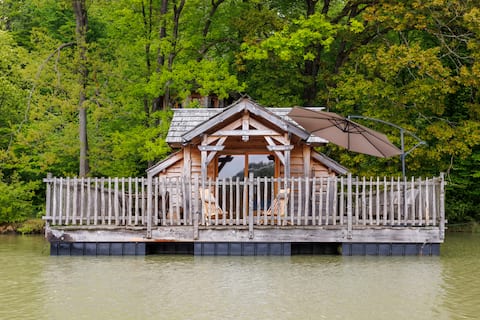
Royal Cabin for 4 people
Entire Place • 2 bedrooms
Note: Performance varies based on location, size, amenities, seasonality, and management quality. Data reflects the past 12 months.
Top Performing Airbnb Hosts in Boron (2025)
Learn from the best! This table showcases top-performing Airbnb hosts in Boron based on the number of properties managed and estimated total revenue over the past year. Analyze their scale and performance metrics.
| Host Name | Properties | Grossing Revenue | Stay Reviews | Avg Rating |
|---|---|---|---|---|
| Gaspard | 19 | $432,223 | 152 | 4.39/5.0 |
Analyzing the strategies of top hosts, such as their property selection, pricing, and guest communication, can offer valuable lessons for optimizing your own Airbnb operations in Boron.
Dive Deeper: Advanced Boron STR Market Data (2025)
Ready to unlock more insights? AirROI provides access to advanced metrics and comprehensive Airbnb data for Boron. Explore detailed analytics beyond this report to refine your investment strategy, optimize pricing, and maximize your vacation rental profits.
Explore Advanced MetricsBoron Short-Term Rental Market Composition (2025): Property & Room Types
Room Type Distribution
Property Type Distribution
Market Composition Insights for Boron
- The Boron Airbnb market composition is heavily skewed towards Entire Home/Apt listings, which make up 100% of the 19 active rentals. This indicates strong guest preference for privacy and space.
- Looking at the property type distribution in Boron, Unique Stays properties are the most common (94.7%), reflecting the local real estate landscape.
Boron Airbnb Room Capacity Analysis (2025): Bedroom Distribution
Distribution of Listings by Number of Bedrooms
Room Capacity Insights for Boron
- The dominant room capacity in Boron is 1 bedroom listings, making up 78.9% of the market. This suggests a strong demand for properties suitable for couples or solo travelers.
- Together, 1 bedroom and 2 bedrooms properties represent 100.0% of the active Airbnb listings in Boron, indicating a high concentration in these sizes.
- With over half the market (78.9%) consisting of studios or 1-bedroom units, Boron is particularly well-suited for individuals or couples.
Boron Vacation Rental Guest Capacity Trends (2025)
Distribution of Listings by Guest Capacity
Guest Capacity Insights for Boron
- The most common guest capacity trend in Boron vacation rentals is listings accommodating 2 guests (73.7%). This suggests the primary traveler segment is likely couples or solo travelers.
- Properties designed for 2 guests and 5 guests dominate the Boron STR market, accounting for 89.5% of listings.
- A significant 73.7% of listings cater specifically to 1-2 guests, highlighting strong demand from couples and solo travelers in Boron.
- On average, properties in Boron are equipped to host 2.7 guests.
Boron Airbnb Booking Patterns (2025): Available vs. Booked Days
Available Days Distribution
Booked Days Distribution
Booking Pattern Insights for Boron
- The most common availability pattern in Boron falls within the 271-366 days range, representing 73.7% of listings. This suggests many properties have significant open periods on their calendars.
- Approximately 94.8% of listings show high availability (181+ days open annually), indicating potential for increased bookings or specific owner usage patterns.
- For booked days, the 31-90 days range is most frequent in Boron (47.4%), reflecting common guest stay durations or potential owner blocking patterns.
- A notable 5.3% of properties secure long booking periods (181+ days booked per year), highlighting successful long-term rental strategies or significant owner usage.
Boron Airbnb Minimum Stay Requirements Analysis
Distribution of Listings by Minimum Night Requirement
1 Night
18 listings
100% of total
Key Insights
- The most prevalent minimum stay requirement in Boron is 1 Night, adopted by 100% of listings. This highlights the market's preference for shorter, flexible bookings.
- A strong majority (100.0%) of the Boron Airbnb data shows acceptance of very short stays (1-2 nights), indicating a dynamic, high-turnover market.
Recommendations
- Align with the market by considering a 1 Night minimum stay, as 100% of Boron hosts use this setting.
- Adjust minimum nights based on seasonality – potentially shorter during low season and longer during peak demand periods in Boron.
Boron Airbnb Cancellation Policy Trends Analysis (2025)
Strict
18 listings
100% of total
Cancellation Policy Insights for Boron
- The prevailing Airbnb cancellation policy trend in Boron is Strict, used by 100% of listings.
- A majority (100.0%) of hosts in Boron utilize Firm or Strict policies, indicating a market where hosts prioritize booking security.
Recommendations for Hosts
- Consider adopting a Strict policy to align with the 100% market standard in Boron.
- With 100% using Strict terms, this is a viable option in Boron, particularly for high-value properties or during peak demand periods.
- Regularly review your cancellation policy against competitors and market demand shifts in Boron.
Boron STR Booking Lead Time Analysis (2025)
Average Booking Lead Time by Month
Booking Lead Time Insights for Boron
- The overall average booking lead time for vacation rentals in Boron is 105 days.
- Guests book furthest in advance for stays during May (average 156 days), likely coinciding with peak travel demand or local events.
- The shortest booking windows occur for stays in February (average 0 days), indicating more last-minute travel plans during this time.
- Seasonally, Spring (132 days avg.) sees the longest lead times, while Winter (9 days avg.) has the shortest, reflecting typical travel planning cycles.
Recommendations for Hosts
- Use the overall average lead time (105 days) as a baseline for your pricing and availability strategy in Boron.
- For May stays, consider implementing length-of-stay discounts or slightly higher rates for bookings made less than 156 days out to capitalize on advance planning.
- During February, focus on last-minute booking availability and promotions, as guests book with very short notice (0 days avg.).
- Target marketing efforts for the Spring season well in advance (at least 132 days) to capture early planners.
- Monitor your own booking lead times against these Boron averages to identify opportunities for dynamic pricing adjustments.
Popular & Essential Airbnb Amenities in Boron (2025)
Amenity Prevalence
Amenity Insights for Boron
- Essential amenities in Boron that guests expect include: Breakfast, Fire extinguisher, Free parking on premises, Essentials, Smoke alarm. Lacking these (any) could significantly impact bookings.
- Popular amenities like Heating, Patio or balcony, Lock on bedroom door are common but not universal. Offering these can provide a competitive edge.
Recommendations for Hosts
- Ensure your listing includes all essential amenities for Boron: Breakfast, Fire extinguisher, Free parking on premises, Essentials, Smoke alarm.
- Consider adding popular differentiators like Heating or Patio or balcony to increase appeal.
- Highlight unique or less common amenities you offer (e.g., hot tub, dedicated workspace, EV charger) in your listing description and photos.
- Regularly check competitor amenities in Boron to stay competitive.
Boron Airbnb Guest Demographics & Profile Analysis (2025)
Guest Profile Summary for Boron
- The typical guest profile for Airbnb in Boron consists of predominantly international visitors (83%), with top international origins including Germany, typically belonging to the Post-2000s (Gen Z/Alpha) group (50%), primarily speaking English or German.
- Domestic travelers account for 16.7% of guests.
- Key international markets include Switzerland (45.8%) and Germany (20.8%).
- Top languages spoken are English (38.2%) followed by German (32.4%).
- A significant demographic segment is the Post-2000s (Gen Z/Alpha) group, representing 50% of guests.
Recommendations for Hosts
- Focus marketing internationally, particularly towards travelers from Germany.
- Tailor amenities and listing descriptions to appeal to the dominant Post-2000s (Gen Z/Alpha) demographic (e.g., highlight fast WiFi, smart home features, local guides).
- Highlight unique local experiences or amenities relevant to the primary guest profile.
- Consider seasonal promotions aligned with peak travel times for key origin markets.
Nearby Short-Term Rental Market Comparison
How does the Boron Airbnb market stack up against its neighbors? Compare key performance metrics like average monthly revenue, ADR, and occupancy rates in surrounding areas to understand the broader regional STR landscape.
| Market | Active Properties | Monthly Revenue | Daily Rate | Avg. Occupancy |
|---|---|---|---|---|
| Lauterbrunnen | 525 | $7,079 | $546.45 | 54% |
| La Rivière-Enverse | 17 | $5,972 | $624.02 | 41% |
| Matten bei Interlaken | 52 | $5,674 | $316.63 | 63% |
| Iseltwald | 14 | $5,491 | $331.95 | 58% |
| Habkern | 13 | $5,382 | $344.74 | 50% |
| Interlaken | 288 | $4,987 | $310.52 | 56% |
| Grindelwald | 489 | $4,921 | $345.40 | 57% |
| Zermatt | 734 | $4,604 | $463.00 | 46% |
| Oberhofen am Thunersee | 24 | $4,572 | $265.94 | 55% |
| Sigriswil | 99 | $4,371 | $271.90 | 58% |