Villeneuve-de-Berg Airbnb Market Analysis 2025: Short Term Rental Data & Vacation Rental Statistics in Auvergne-Rhône-Alpes, France
Is Airbnb profitable in Villeneuve-de-Berg in 2025? Explore comprehensive Airbnb analytics for Villeneuve-de-Berg, Auvergne-Rhône-Alpes, France to uncover income potential. This 2025 STR market report for Villeneuve-de-Berg, based on AirROI data from April 2024 to March 2025, reveals key trends in the niche market of 48 active listings.
Whether you're considering an Airbnb investment in Villeneuve-de-Berg, optimizing your existing vacation rental, or exploring rental arbitrage opportunities, understanding the Villeneuve-de-Berg Airbnb data is crucial. Understanding the local regulations is key to maximizing your short term rental income potential. Let's dive into the specifics.
Key Villeneuve-de-Berg Airbnb Performance Metrics Overview
Monthly Airbnb Revenue Variations & Income Potential in Villeneuve-de-Berg (2025)
Understanding the monthly revenue variations for Airbnb listings in Villeneuve-de-Berg is key to maximizing your short term rental income potential. Seasonality significantly impacts earnings. Our analysis, based on data from the past 12 months, shows that the peak revenue month for STRs in Villeneuve-de-Berg is typically August, while February often presents the lowest earnings, highlighting opportunities for strategic pricing adjustments during shoulder and low seasons. Explore the typical Airbnb income in Villeneuve-de-Berg across different performance tiers:
- Best-in-class properties (Top 10%) achieve $3,423+ monthly, often utilizing dynamic pricing and superior guest experiences.
- Strong performing properties (Top 25%) earn $1,788 or more, indicating effective management and desirable locations/amenities.
- Typical properties (Median) generate around $798 per month, representing the average market performance.
- Entry-level properties (Bottom 25%) see earnings around $372, often with potential for optimization.
Average Monthly Airbnb Earnings Trend in Villeneuve-de-Berg
Villeneuve-de-Berg Airbnb Occupancy Rate Trends (2025)
Maximize your bookings by understanding the Villeneuve-de-Berg STR occupancy trends. Seasonal demand shifts significantly influence how often properties are booked. Typically, Augustsees the highest demand (peak season occupancy), while January experiences the lowest (low season). Effective strategies, like adjusting minimum stays or offering promotions, can boost occupancy during slower periods. Here's how different property tiers perform in Villeneuve-de-Berg:
- Best-in-class properties (Top 10%) achieve 60%+ occupancy, indicating high desirability and potentially optimized availability.
- Strong performing properties (Top 25%) maintain 42% or higher occupancy, suggesting good market fit and guest satisfaction.
- Typical properties (Median) have an occupancy rate around 25%.
- Entry-level properties (Bottom 25%) average 12% occupancy, potentially facing higher vacancy.
Average Monthly Occupancy Rate Trend in Villeneuve-de-Berg
Average Daily Rate (ADR) Airbnb Trends in Villeneuve-de-Berg (2025)
Effective short term rental pricing strategy in Villeneuve-de-Berg involves understanding monthly ADR fluctuations. The Average Daily Rate (ADR) for Airbnb in Villeneuve-de-Berg typically peaks in November and dips lowest during October. Leveraging Airbnb dynamic pricing tools or strategies based on this seasonality can significantly boost revenue. Here's a look at the typical nightly rates achieved:
- Best-in-class properties (Top 10%) command rates of $267+ per night, often due to premium features or locations.
- Strong performing properties (Top 25%) achieve nightly rates of $158 or more.
- Typical properties (Median) charge around $104 per night.
- Entry-level properties (Bottom 25%) earn around $65 per night.
Average Daily Rate (ADR) Trend by Month in Villeneuve-de-Berg
Get Live Villeneuve-de-Berg Market Intelligence 👇

Explore Real-time Analytics
Airbnb Seasonality Analysis & Trends in Villeneuve-de-Berg (2025)
Peak Season (August, July, May)
- Revenue averages $2,454 per month
- Occupancy rates average 46.3%
- Daily rates average $133
Shoulder Season
- Revenue averages $1,280 per month
- Occupancy maintains around 25.7%
- Daily rates hold near $132
Low Season (January, February, March)
- Revenue drops to average $690 per month
- Occupancy decreases to average 20.5%
- Daily rates adjust to average $137
Seasonality Insights for Villeneuve-de-Berg
- The Airbnb seasonality in Villeneuve-de-Berg shows highly seasonal trends requiring careful strategy. While the sections above show seasonal averages, it's also insightful to look at the extremes:
- During the high season, the absolute peak month showcases Villeneuve-de-Berg's highest earning potential, with monthly revenues capable of climbing to $3,076, occupancy reaching a high of 64.7%, and ADRs peaking at $138.
- Conversely, the slowest single month of the year, typically falling within the low season, marks the market's lowest point. In this month, revenue might dip to $599, occupancy could drop to 13.5%, and ADRs may adjust down to $129.
- Understanding both the seasonal averages and these monthly peaks and troughs in revenue, occupancy, and ADR is crucial for maximizing your Airbnb profit potential in Villeneuve-de-Berg.
Seasonal Strategies for Maximizing Profit
- Peak Season: Maximize revenue through premium pricing and potentially longer minimum stays. Ensure high availability.
- Low Season: Offer competitive pricing, special promotions (e.g., extended stay discounts), and flexible cancellation policies. Target off-season travelers like remote workers or budget-conscious guests.
- Shoulder Seasons: Implement dynamic pricing that balances peak and low rates. Target weekend travelers or specific events. Offer slightly more flexible terms than peak season.
- Regularly analyze your own performance against these Villeneuve-de-Berg seasonality benchmarks and adjust your pricing and availability strategy accordingly.
Best Areas for Airbnb Investment in Villeneuve-de-Berg (2025)
Exploring the top neighborhoods for short-term rentals in Villeneuve-de-Berg? This section highlights key areas, outlining why they are attractive for hosts and guests, along with notable local attractions. Consider these locations based on your target guest profile and investment strategy.
| Neighborhood / Area | Why Host Here? (Target Guests & Appeal) | Key Attractions & Landmarks |
|---|---|---|
| Historic Center | Charming old town with medieval architecture and rich history. Ideal for tourists who want to explore local culture and cuisine, as well as visit historical landmarks. | Church of St. Mary, Château de Berg, Local artisan shops, Cafés and restaurants, Weekly markets |
| Outdoor Activities | Surrounding natural beauty and outdoor adventures. Great for nature lovers and active travelers interested in hiking and exploring the outdoors. | Monts d'Ardèche Regional Park, Hiking trails, Cycling routes, Picnic areas, Scenic viewpoints |
| Local Cuisine | Known for its delicious local food and wine. Perfect for foodies looking to experience authentic Auvergne flavors and culinary delights. | Local wineries, Farmers markets, Traditional restaurants, Culinary festivals, Cooking classes |
| Cultural Experiences | Rich cultural events and festivals throughout the year. Attracts tourists who want to immerse themselves in the local lifestyle and traditions. | Music festivals, Art exhibitions, Local crafts fairs, Traditional music events, Workshops |
| Countryside Retreats | Serene countryside surroundings perfect for relaxation. Ideal for guests seeking peace and quiet away from urban hustle. | Beautiful landscapes, Charming villages, Walking paths, Wine tasting, Stargazing |
| Family-Friendly Activities | Variety of attractions suitable for families. Great for parents looking for fun and educational experiences for their children. | Local zoo, Adventure parks, Children's museums, Family-friendly hiking trails, Outdoor play areas |
| Winter Sports | Proximity to ski resorts and winter sports facilities. Popular among winter sports enthusiasts looking for skiing and snowboarding opportunities. | Nearby ski resorts, Sledding areas, Winter hiking trails, Scenic winter landscapes, Apres-ski activities |
| Art and History Tours | Ideal for art and history enthusiasts looking to explore local museums and galleries. Offers an enriching cultural experience. | Local art galleries, Historical museums, Cultural landmarks, Guided tours, Art workshops |
Understanding Airbnb License Requirements & STR Laws in Villeneuve-de-Berg (2025)
With 21% of listings showing registration in 2025, understanding potential Airbnb license requirements is crucial in Villeneuve-de-Berg. Always verify the latest short term rental regulations and Airbnb license requirements directly with local government authorities for Villeneuve-de-Berg to ensure full compliance before hosting.
(Source: AirROI data, 2025, based on 21% licensed listings)
Top Performing Airbnb Properties in Villeneuve-de-Berg (2025)
Benchmark your potential! Explore examples of top-performing Airbnb properties in Villeneuve-de-Bergbased on Trailing Twelve Month (TTM) revenue. Analyze their characteristics, revenue, occupancy rate, and ADR to understand what drives success in this market.
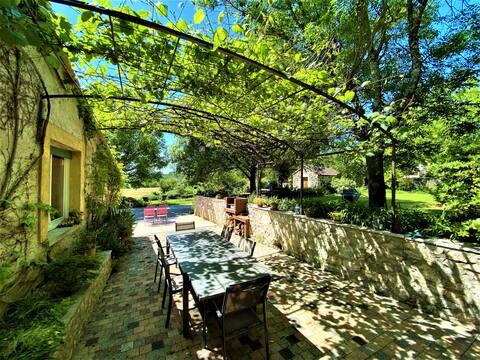
15p group lodge- Private park- Gde room/kitchen
Entire Place • 7 bedrooms

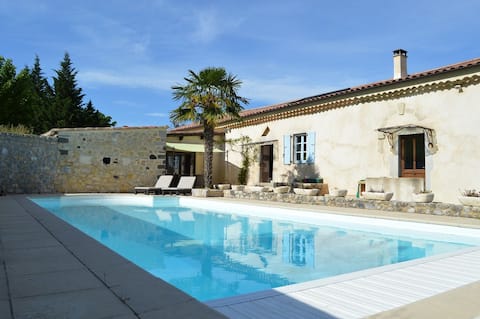
Large village house with pool
Entire Place • 7 bedrooms
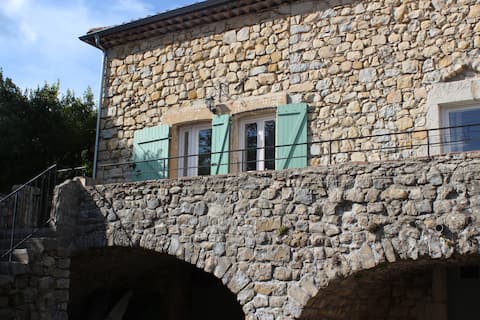
Mas Ardèche in the Vallee de l 'Ibie
Entire Place • 4 bedrooms
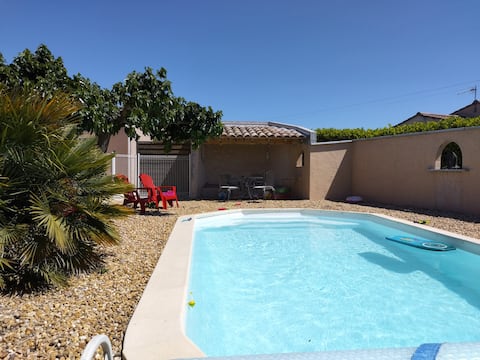
MAS DE BARAUD, pool cottage
Entire Place • 4 bedrooms
Villa Ardèche with pool
Entire Place • 3 bedrooms
Friends lodge to know how to dance Salsa and Bachata
Entire Place • 5 bedrooms
Note: Performance varies based on location, size, amenities, seasonality, and management quality. Data reflects the past 12 months.
Top Performing Airbnb Hosts in Villeneuve-de-Berg (2025)
Learn from the best! This table showcases top-performing Airbnb hosts in Villeneuve-de-Berg based on the number of properties managed and estimated total revenue over the past year. Analyze their scale and performance metrics.
| Host Name | Properties | Grossing Revenue | Stay Reviews | Avg Rating |
|---|---|---|---|---|
| Nicole | 1 | $88,606 | 4 | 5.00/5.0 |
| Sophie | 1 | $49,626 | 149 | 4.94/5.0 |
| Sophie | 5 | $47,491 | 96 | 4.73/5.0 |
| Nadia | 1 | $32,784 | 14 | 4.86/5.0 |
| Philippe Et Marie Laurence | 2 | $30,011 | 9 | 4.80/5.0 |
| Pierre-Luc | 1 | $29,063 | 12 | 4.92/5.0 |
| Amelie | 2 | $26,062 | 74 | 4.83/5.0 |
| Andras | 1 | $20,726 | 22 | 4.91/5.0 |
| Kevin Et Laëtitia | 1 | $16,794 | 36 | 4.97/5.0 |
| Alexandra Et Christophe | 3 | $16,015 | 19 | 5.00/5.0 |
Analyzing the strategies of top hosts, such as their property selection, pricing, and guest communication, can offer valuable lessons for optimizing your own Airbnb operations in Villeneuve-de-Berg.
Dive Deeper: Advanced Villeneuve-de-Berg STR Market Data (2025)
Ready to unlock more insights? AirROI provides access to advanced metrics and comprehensive Airbnb data for Villeneuve-de-Berg. Explore detailed analytics beyond this report to refine your investment strategy, optimize pricing, and maximize your vacation rental profits.
Explore Advanced MetricsVilleneuve-de-Berg Short-Term Rental Market Composition (2025): Property & Room Types
Room Type Distribution
Property Type Distribution
Market Composition Insights for Villeneuve-de-Berg
- The Villeneuve-de-Berg Airbnb market composition is heavily skewed towards Entire Home/Apt listings, which make up 89.6% of the 48 active rentals. This indicates strong guest preference for privacy and space.
- Looking at the property type distribution in Villeneuve-de-Berg, House properties are the most common (64.6%), reflecting the local real estate landscape.
- Houses represent a significant 64.6% portion, catering likely to families or larger groups.
- The presence of 8.3% Hotel/Boutique listings indicates integration with traditional hospitality.
- Smaller segments like others, outdoor/unique (combined 4.2%) offer potential for unique stay experiences.
Villeneuve-de-Berg Airbnb Room Capacity Analysis (2025): Bedroom Distribution
Distribution of Listings by Number of Bedrooms
Room Capacity Insights for Villeneuve-de-Berg
- The dominant room capacity in Villeneuve-de-Berg is 1 bedroom listings, making up 39.6% of the market. This suggests a strong demand for properties suitable for couples or solo travelers.
- Together, 1 bedroom and 2 bedrooms properties represent 58.4% of the active Airbnb listings in Villeneuve-de-Berg, indicating a high concentration in these sizes.
- A significant 37.5% of listings offer 3+ bedrooms, catering to larger groups and families seeking more space in Villeneuve-de-Berg.
Villeneuve-de-Berg Vacation Rental Guest Capacity Trends (2025)
Distribution of Listings by Guest Capacity
Guest Capacity Insights for Villeneuve-de-Berg
- The most common guest capacity trend in Villeneuve-de-Berg vacation rentals is listings accommodating 8+ guests (29.2%). This suggests the primary traveler segment is likely larger groups.
- Properties designed for 8+ guests and 3 guests dominate the Villeneuve-de-Berg STR market, accounting for 48.0% of listings.
- 43.8% of properties accommodate 6+ guests, serving the market segment for larger families or group travel in Villeneuve-de-Berg.
- On average, properties in Villeneuve-de-Berg are equipped to host 4.9 guests.
Villeneuve-de-Berg Airbnb Booking Patterns (2025): Available vs. Booked Days
Available Days Distribution
Booked Days Distribution
Booking Pattern Insights for Villeneuve-de-Berg
- The most common availability pattern in Villeneuve-de-Berg falls within the 271-366 days range, representing 70.8% of listings. This suggests many properties have significant open periods on their calendars.
- Approximately 93.7% of listings show high availability (181+ days open annually), indicating potential for increased bookings or specific owner usage patterns.
- For booked days, the 31-90 days range is most frequent in Villeneuve-de-Berg (39.6%), reflecting common guest stay durations or potential owner blocking patterns.
- A notable 6.3% of properties secure long booking periods (181+ days booked per year), highlighting successful long-term rental strategies or significant owner usage.
Villeneuve-de-Berg Airbnb Minimum Stay Requirements Analysis
Distribution of Listings by Minimum Night Requirement
1 Night
7 listings
16.7% of total
2 Nights
17 listings
40.5% of total
3 Nights
3 listings
7.1% of total
4-6 Nights
6 listings
14.3% of total
7-29 Nights
2 listings
4.8% of total
30+ Nights
7 listings
16.7% of total
Key Insights
- The most prevalent minimum stay requirement in Villeneuve-de-Berg is 2 Nights, adopted by 40.5% of listings. This highlights the market's preference for shorter, flexible bookings.
- A significant segment (16.7%) caters to monthly stays (30+ nights) in Villeneuve-de-Berg, pointing to opportunities in the extended-stay market.
Recommendations
- Align with the market by considering a 2 Nights minimum stay, as 40.5% of Villeneuve-de-Berg hosts use this setting.
- If feasible, allowing 1-night stays, especially midweek or during low season, could capture last-minute bookings, as only 16.7% currently do.
- A 2-night minimum appears standard (40.5%). Consider this for weekends or peak periods.
- Explore offering discounts for stays of 30+ nights to attract the 16.7% of the market seeking extended stays.
- Adjust minimum nights based on seasonality – potentially shorter during low season and longer during peak demand periods in Villeneuve-de-Berg.
Villeneuve-de-Berg Airbnb Cancellation Policy Trends Analysis (2025)
Flexible
3 listings
7.7% of total
Moderate
5 listings
12.8% of total
Firm
10 listings
25.6% of total
Strict
21 listings
53.8% of total
Cancellation Policy Insights for Villeneuve-de-Berg
- The prevailing Airbnb cancellation policy trend in Villeneuve-de-Berg is Strict, used by 53.8% of listings.
- A majority (79.4%) of hosts in Villeneuve-de-Berg utilize Firm or Strict policies, indicating a market where hosts prioritize booking security.
Recommendations for Hosts
- Consider adopting a Strict policy to align with the 53.8% market standard in Villeneuve-de-Berg.
- With 53.8% using Strict terms, this is a viable option in Villeneuve-de-Berg, particularly for high-value properties or during peak demand periods.
- Regularly review your cancellation policy against competitors and market demand shifts in Villeneuve-de-Berg.
Villeneuve-de-Berg STR Booking Lead Time Analysis (2025)
Average Booking Lead Time by Month
Booking Lead Time Insights for Villeneuve-de-Berg
- The overall average booking lead time for vacation rentals in Villeneuve-de-Berg is 50 days.
- Guests book furthest in advance for stays during May (average 88 days), likely coinciding with peak travel demand or local events.
- The shortest booking windows occur for stays in November (average 25 days), indicating more last-minute travel plans during this time.
- Seasonally, Summer (74 days avg.) sees the longest lead times, while Fall (40 days avg.) has the shortest, reflecting typical travel planning cycles.
Recommendations for Hosts
- Use the overall average lead time (50 days) as a baseline for your pricing and availability strategy in Villeneuve-de-Berg.
- For May stays, consider implementing length-of-stay discounts or slightly higher rates for bookings made less than 88 days out to capitalize on advance planning.
- Target marketing efforts for the Summer season well in advance (at least 74 days) to capture early planners.
- Monitor your own booking lead times against these Villeneuve-de-Berg averages to identify opportunities for dynamic pricing adjustments.
Popular & Essential Airbnb Amenities in Villeneuve-de-Berg (2025)
Amenity Prevalence
Amenity Insights for Villeneuve-de-Berg
- Essential amenities in Villeneuve-de-Berg that guests expect include: Kitchen. Lacking these (this) could significantly impact bookings.
- Popular amenities like Smoke alarm, Hot water, Wifi are common but not universal. Offering these can provide a competitive edge.
- Warning: Wifi is not universally provided but is considered essential globally. Ensure reliable Wifi is offered.
Recommendations for Hosts
- Ensure your listing includes all essential amenities for Villeneuve-de-Berg: Kitchen.
- Prioritize adding missing essentials: Kitchen.
- Consider adding popular differentiators like Smoke alarm or Hot water to increase appeal.
- Highlight unique or less common amenities you offer (e.g., hot tub, dedicated workspace, EV charger) in your listing description and photos.
- Regularly check competitor amenities in Villeneuve-de-Berg to stay competitive.
Villeneuve-de-Berg Airbnb Guest Demographics & Profile Analysis (2025)
Guest Profile Summary for Villeneuve-de-Berg
- The typical guest profile for Airbnb in Villeneuve-de-Berg consists of primarily domestic travelers (84%), often arriving from nearby Lyon, typically belonging to the Post-2000s (Gen Z/Alpha) group (50%), primarily speaking French or English.
- Domestic travelers account for 84.3% of guests.
- Key international markets include France (84.3%) and Netherlands (4.8%).
- Top languages spoken are French (40.9%) followed by English (33.2%).
- A significant demographic segment is the Post-2000s (Gen Z/Alpha) group, representing 50% of guests.
Recommendations for Hosts
- Target domestic marketing efforts towards travelers from Lyon and Paris.
- Tailor amenities and listing descriptions to appeal to the dominant Post-2000s (Gen Z/Alpha) demographic (e.g., highlight fast WiFi, smart home features, local guides).
- Highlight unique local experiences or amenities relevant to the primary guest profile.
- Consider seasonal promotions aligned with peak travel times for key origin markets.
Nearby Short-Term Rental Market Comparison
How does the Villeneuve-de-Berg Airbnb market stack up against its neighbors? Compare key performance metrics like average monthly revenue, ADR, and occupancy rates in surrounding areas to understand the broader regional STR landscape.
| Market | Active Properties | Monthly Revenue | Daily Rate | Avg. Occupancy |
|---|---|---|---|---|
| Villeneuvette | 13 | $4,150 | $337.56 | 44% |
| Divajeu | 19 | $3,941 | $410.65 | 42% |
| Saint-Germain-au-Mont-d'Or | 10 | $3,928 | $316.02 | 40% |
| Dommartin | 11 | $3,905 | $327.00 | 36% |
| Courzieu | 11 | $3,267 | $287.83 | 52% |
| Vanosc | 13 | $3,072 | $224.52 | 44% |
| Chantepérier | 20 | $3,057 | $281.60 | 37% |
| Gordes | 225 | $2,913 | $366.32 | 43% |
| Redessan | 19 | $2,834 | $334.82 | 34% |
| Fontarèches | 11 | $2,802 | $525.31 | 34% |