Ville-la-Grand Airbnb Market Analysis 2025: Short Term Rental Data & Vacation Rental Statistics in Auvergne-Rhône-Alpes, France
Is Airbnb profitable in Ville-la-Grand in 2025? Explore comprehensive Airbnb analytics for Ville-la-Grand, Auvergne-Rhône-Alpes, France to uncover income potential. This 2025 STR market report for Ville-la-Grand, based on AirROI data from April 2024 to March 2025, reveals key trends in the niche market of 51 active listings.
Whether you're considering an Airbnb investment in Ville-la-Grand, optimizing your existing vacation rental, or exploring rental arbitrage opportunities, understanding the Ville-la-Grand Airbnb data is crucial. Leveraging the low regulation environment is key to maximizing your short term rental income potential. Let's dive into the specifics.
Key Ville-la-Grand Airbnb Performance Metrics Overview
Monthly Airbnb Revenue Variations & Income Potential in Ville-la-Grand (2025)
Understanding the monthly revenue variations for Airbnb listings in Ville-la-Grand is key to maximizing your short term rental income potential. Seasonality significantly impacts earnings. Our analysis, based on data from the past 12 months, shows that the peak revenue month for STRs in Ville-la-Grand is typically April, while November often presents the lowest earnings, highlighting opportunities for strategic pricing adjustments during shoulder and low seasons. Explore the typical Airbnb income in Ville-la-Grand across different performance tiers:
- Best-in-class properties (Top 10%) achieve $2,664+ monthly, often utilizing dynamic pricing and superior guest experiences.
- Strong performing properties (Top 25%) earn $1,887 or more, indicating effective management and desirable locations/amenities.
- Typical properties (Median) generate around $1,342 per month, representing the average market performance.
- Entry-level properties (Bottom 25%) see earnings around $759, often with potential for optimization.
Average Monthly Airbnb Earnings Trend in Ville-la-Grand
Ville-la-Grand Airbnb Occupancy Rate Trends (2025)
Maximize your bookings by understanding the Ville-la-Grand STR occupancy trends. Seasonal demand shifts significantly influence how often properties are booked. Typically, Augustsees the highest demand (peak season occupancy), while April experiences the lowest (low season). Effective strategies, like adjusting minimum stays or offering promotions, can boost occupancy during slower periods. Here's how different property tiers perform in Ville-la-Grand:
- Best-in-class properties (Top 10%) achieve 87%+ occupancy, indicating high desirability and potentially optimized availability.
- Strong performing properties (Top 25%) maintain 74% or higher occupancy, suggesting good market fit and guest satisfaction.
- Typical properties (Median) have an occupancy rate around 53%.
- Entry-level properties (Bottom 25%) average 26% occupancy, potentially facing higher vacancy.
Average Monthly Occupancy Rate Trend in Ville-la-Grand
Average Daily Rate (ADR) Airbnb Trends in Ville-la-Grand (2025)
Effective short term rental pricing strategy in Ville-la-Grand involves understanding monthly ADR fluctuations. The Average Daily Rate (ADR) for Airbnb in Ville-la-Grand typically peaks in December and dips lowest during September. Leveraging Airbnb dynamic pricing tools or strategies based on this seasonality can significantly boost revenue. Here's a look at the typical nightly rates achieved:
- Best-in-class properties (Top 10%) command rates of $114+ per night, often due to premium features or locations.
- Strong performing properties (Top 25%) achieve nightly rates of $99 or more.
- Typical properties (Median) charge around $70 per night.
- Entry-level properties (Bottom 25%) earn around $53 per night.
Average Daily Rate (ADR) Trend by Month in Ville-la-Grand
Get Live Ville-la-Grand Market Intelligence 👇

Explore Real-time Analytics
Airbnb Seasonality Analysis & Trends in Ville-la-Grand (2025)
Peak Season (April, June, May)
- Revenue averages $1,815 per month
- Occupancy rates average 45.0%
- Daily rates average $80
Shoulder Season
- Revenue averages $1,453 per month
- Occupancy maintains around 55.9%
- Daily rates hold near $82
Low Season (January, March, November)
- Revenue drops to average $1,200 per month
- Occupancy decreases to average 45.9%
- Daily rates adjust to average $84
Seasonality Insights for Ville-la-Grand
- The Airbnb seasonality in Ville-la-Grand shows moderate seasonality with distinct peak and low periods. While the sections above show seasonal averages, it's also insightful to look at the extremes:
- During the high season, the absolute peak month showcases Ville-la-Grand's highest earning potential, with monthly revenues capable of climbing to $1,825, occupancy reaching a high of 62.7%, and ADRs peaking at $87.
- Conversely, the slowest single month of the year, typically falling within the low season, marks the market's lowest point. In this month, revenue might dip to $1,178, occupancy could drop to 40.5%, and ADRs may adjust down to $79.
- Understanding both the seasonal averages and these monthly peaks and troughs in revenue, occupancy, and ADR is crucial for maximizing your Airbnb profit potential in Ville-la-Grand.
Seasonal Strategies for Maximizing Profit
- Peak Season: Maximize revenue through premium pricing and potentially longer minimum stays. Ensure high availability.
- Low Season: Offer competitive pricing, special promotions (e.g., extended stay discounts), and flexible cancellation policies. Target off-season travelers like remote workers or budget-conscious guests.
- Shoulder Seasons: Implement dynamic pricing that balances peak and low rates. Target weekend travelers or specific events. Offer slightly more flexible terms than peak season.
- Regularly analyze your own performance against these Ville-la-Grand seasonality benchmarks and adjust your pricing and availability strategy accordingly.
Best Areas for Airbnb Investment in Ville-la-Grand (2025)
Exploring the top neighborhoods for short-term rentals in Ville-la-Grand? This section highlights key areas, outlining why they are attractive for hosts and guests, along with notable local attractions. Consider these locations based on your target guest profile and investment strategy.
| Neighborhood / Area | Why Host Here? (Target Guests & Appeal) | Key Attractions & Landmarks |
|---|---|---|
| Centre de Ville | Ville-la-Grand's town center is vibrant, with easy access to shops, restaurants, and public transport. It's a convenient base for tourists exploring the area. | Local shops, Cafés, Parks, Public transport links |
| Proximités de Genève | Being close to Geneva makes this area attractive for visitors looking for accommodation close to the Swiss border, appealing to business travelers and holidaymakers alike. | Lake Geneva, Palexpo, United Nations Office, CERN, Old Town Geneva |
| Collines de Ville-la-Grand | This residential area offers a quiet atmosphere with beautiful views. It attracts families and those seeking a peaceful retreat while still being close to urban amenities. | Walking trails, Parks, Vineyards, Local farms |
| Les Rues de la Liberté | This area is known for its countryside charm and local markets. It's popular among travelers looking for a unique French experience. | Local market, Scenic views, Neighborhood cafés, Cultural festivals |
| Avenue de Genève | A bustling avenue with numerous boutiques and eateries. It attracts both locals and visitors, providing plenty of options for dining and shopping. | Shops, Restaurants, Coffee houses, Cultural events |
| Parc des Sports | This area is ideal for sports enthusiasts, offering various sports facilities and parks, making it a hit with active tourists and families. | Sports facilities, Kids playgrounds, Walking paths, Events and tournaments |
| Domaine de Genève | Known for its luxurious estates and gated communities, this area is appealing to affluent tourists looking for high-end accommodation options. | Luxury homes, Golf courses, Private parks, Exclusive events |
| Quartier des Écoles | Near educational institutions, this area attracts families visiting for educational purposes or those attending events, making it a strategic location for Airbnb hosts. | Schools, Community events, Playgrounds, Cultural workshops |
Understanding Airbnb License Requirements & STR Laws in Ville-la-Grand (2025)
While Ville-la-Grand, Auvergne-Rhône-Alpes, France currently shows low STR regulations, specific Airbnb license requirements might still exist or change. Always verify the latest short term rental regulations and Airbnb license requirements directly with local government authorities for Ville-la-Grand to ensure full compliance before hosting.
(Source: AirROI data, 2025, based on 2% licensed listings)
Top Performing Airbnb Properties in Ville-la-Grand (2025)
Benchmark your potential! Explore examples of top-performing Airbnb properties in Ville-la-Grandbased on Trailing Twelve Month (TTM) revenue. Analyze their characteristics, revenue, occupancy rate, and ADR to understand what drives success in this market.
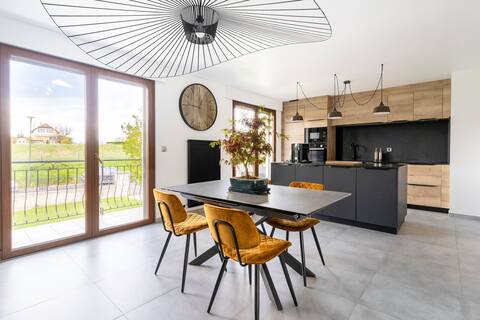
Luxury apartment a stone's throw from Geneva
Entire Place • 3 bedrooms
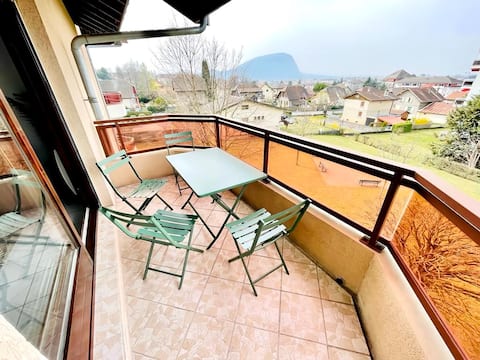
Hummingbird, F3.
Entire Place • 1 bedroom
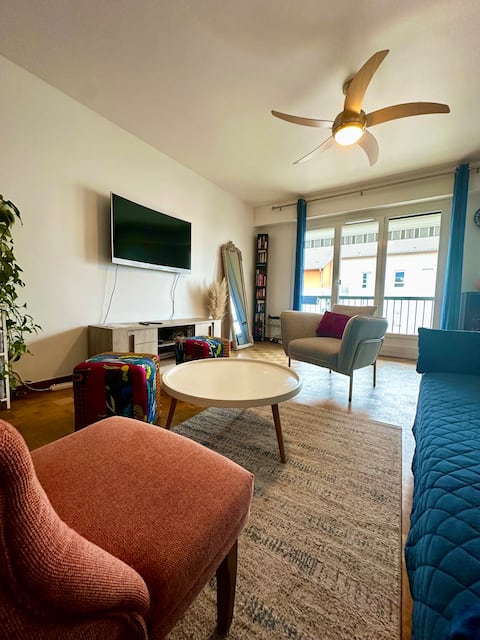
Key Home Leman | Le Bleuet | Close to Centre | Comfy
Entire Place • 2 bedrooms

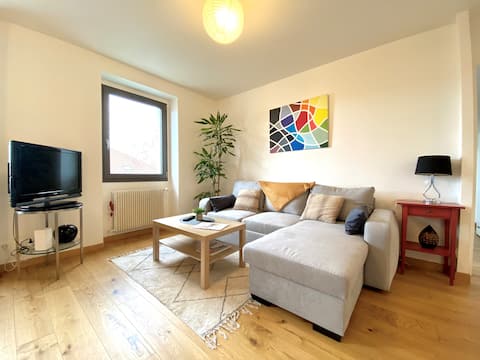
ZenBNB | Le Cheminot | Hyper-Centre | 2 min. Gare|
Entire Place • 2 bedrooms
Apartment near Swiss border and public transport
Entire Place • 1 bedroom
Residence at the gates of Geneva
Entire Place • 1 bedroom
Note: Performance varies based on location, size, amenities, seasonality, and management quality. Data reflects the past 12 months.
Top Performing Airbnb Hosts in Ville-la-Grand (2025)
Learn from the best! This table showcases top-performing Airbnb hosts in Ville-la-Grand based on the number of properties managed and estimated total revenue over the past year. Analyze their scale and performance metrics.
| Host Name | Properties | Grossing Revenue | Stay Reviews | Avg Rating |
|---|---|---|---|---|
| Roberto | 4 | $103,882 | 199 | 4.94/5.0 |
| Marjola | 2 | $37,856 | 159 | 4.80/5.0 |
| Aude | 2 | $36,901 | 129 | 4.85/5.0 |
| Morgane | 2 | $36,791 | 69 | 4.92/5.0 |
| Florence | 1 | $32,887 | 5 | 5.00/5.0 |
| Selia Key Home Leman | 1 | $25,320 | 87 | 4.87/5.0 |
| ZenBNB | 1 | $22,900 | 17 | 4.29/5.0 |
| Anne Marie | 3 | $21,274 | 67 | 4.91/5.0 |
| Corinne | 3 | $20,818 | 39 | 4.57/5.0 |
| Corinne | 1 | $20,127 | 8 | 4.75/5.0 |
Analyzing the strategies of top hosts, such as their property selection, pricing, and guest communication, can offer valuable lessons for optimizing your own Airbnb operations in Ville-la-Grand.
Dive Deeper: Advanced Ville-la-Grand STR Market Data (2025)
Ready to unlock more insights? AirROI provides access to advanced metrics and comprehensive Airbnb data for Ville-la-Grand. Explore detailed analytics beyond this report to refine your investment strategy, optimize pricing, and maximize your vacation rental profits.
Explore Advanced MetricsVille-la-Grand Short-Term Rental Market Composition (2025): Property & Room Types
Room Type Distribution
Property Type Distribution
Market Composition Insights for Ville-la-Grand
- The Ville-la-Grand Airbnb market composition is heavily skewed towards Entire Home/Apt listings, which make up 64.7% of the 51 active rentals. This indicates strong guest preference for privacy and space.
- However, a notable 35.3% share for Private Rooms suggests opportunities for budget-conscious travelers or hosts renting out spare rooms.
- Looking at the property type distribution in Ville-la-Grand, Apartment/Condo properties are the most common (88.2%), reflecting the local real estate landscape.
- Smaller segments like hotel/boutique (combined 2.0%) offer potential for unique stay experiences.
Ville-la-Grand Airbnb Room Capacity Analysis (2025): Bedroom Distribution
Distribution of Listings by Number of Bedrooms
Room Capacity Insights for Ville-la-Grand
- The dominant room capacity in Ville-la-Grand is 1 bedroom listings, making up 45.1% of the market. This suggests a strong demand for properties suitable for couples or solo travelers.
- Together, 1 bedroom and 2 bedrooms properties represent 60.8% of the active Airbnb listings in Ville-la-Grand, indicating a high concentration in these sizes.
- Listings with 3+ bedrooms (2.0%) represent a smaller niche, potentially indicating an underserved market for larger group accommodations in Ville-la-Grand.
Ville-la-Grand Vacation Rental Guest Capacity Trends (2025)
Distribution of Listings by Guest Capacity
Guest Capacity Insights for Ville-la-Grand
- The most common guest capacity trend in Ville-la-Grand vacation rentals is listings accommodating 2 guests (29.4%). This suggests the primary traveler segment is likely couples or solo travelers.
- Properties designed for 2 guests and 4 guests dominate the Ville-la-Grand STR market, accounting for 49.0% of listings.
- A significant 41.2% of listings cater specifically to 1-2 guests, highlighting strong demand from couples and solo travelers in Ville-la-Grand.
- Listings for large groups (6+ guests) are relatively rare (3.9%), potentially indicating an opportunity for hosts targeting this segment in Ville-la-Grand.
- On average, properties in Ville-la-Grand are equipped to host 2.0 guests.
Ville-la-Grand Airbnb Booking Patterns (2025): Available vs. Booked Days
Available Days Distribution
Booked Days Distribution
Booking Pattern Insights for Ville-la-Grand
- The most common availability pattern in Ville-la-Grand falls within the 91-180 days range, representing 33.3% of listings. This suggests many properties have significant open periods on their calendars.
- Approximately 56.9% of listings show high availability (181+ days open annually), indicating potential for increased bookings or specific owner usage patterns.
- For booked days, the 181-270 days range is most frequent in Ville-la-Grand (33.3%), reflecting common guest stay durations or potential owner blocking patterns.
- A notable 43.1% of properties secure long booking periods (181+ days booked per year), highlighting successful long-term rental strategies or significant owner usage.
Ville-la-Grand Airbnb Minimum Stay Requirements Analysis
Distribution of Listings by Minimum Night Requirement
1 Night
14 listings
28% of total
2 Nights
9 listings
18% of total
3 Nights
7 listings
14% of total
4-6 Nights
4 listings
8% of total
7-29 Nights
6 listings
12% of total
30+ Nights
10 listings
20% of total
Key Insights
- The most prevalent minimum stay requirement in Ville-la-Grand is 1 Night, adopted by 28% of listings. This highlights the market's preference for shorter, flexible bookings.
- A significant segment (20%) caters to monthly stays (30+ nights) in Ville-la-Grand, pointing to opportunities in the extended-stay market.
Recommendations
- Align with the market by considering a 1 Night minimum stay, as 28% of Ville-la-Grand hosts use this setting.
- If feasible, allowing 1-night stays, especially midweek or during low season, could capture last-minute bookings, as only 28% currently do.
- Explore offering discounts for stays of 30+ nights to attract the 20% of the market seeking extended stays.
- Adjust minimum nights based on seasonality – potentially shorter during low season and longer during peak demand periods in Ville-la-Grand.
Ville-la-Grand Airbnb Cancellation Policy Trends Analysis (2025)
Flexible
16 listings
37.2% of total
Moderate
11 listings
25.6% of total
Firm
13 listings
30.2% of total
Strict
3 listings
7% of total
Cancellation Policy Insights for Ville-la-Grand
- The prevailing Airbnb cancellation policy trend in Ville-la-Grand is Flexible, used by 37.2% of listings.
- There's a relatively balanced mix between guest-friendly (62.8%) and stricter (37.2%) policies, offering choices for different guest needs.
- Strict cancellation policies are quite rare (7%), potentially making listings with this policy less competitive unless justified by high demand or property type.
Recommendations for Hosts
- Consider adopting a Flexible policy to align with the 37.2% market standard in Ville-la-Grand.
- Using a Strict policy might deter some guests, as only 7% of listings use it. Evaluate if potential revenue protection outweighs possible lower booking rates.
- Regularly review your cancellation policy against competitors and market demand shifts in Ville-la-Grand.
Ville-la-Grand STR Booking Lead Time Analysis (2025)
Average Booking Lead Time by Month
Booking Lead Time Insights for Ville-la-Grand
- The overall average booking lead time for vacation rentals in Ville-la-Grand is 39 days.
- Guests book furthest in advance for stays during June (average 65 days), likely coinciding with peak travel demand or local events.
- The shortest booking windows occur for stays in January (average 31 days), indicating more last-minute travel plans during this time.
- Seasonally, Summer (54 days avg.) sees the longest lead times, while Winter (36 days avg.) has the shortest, reflecting typical travel planning cycles.
Recommendations for Hosts
- Use the overall average lead time (39 days) as a baseline for your pricing and availability strategy in Ville-la-Grand.
- For June stays, consider implementing length-of-stay discounts or slightly higher rates for bookings made less than 65 days out to capitalize on advance planning.
- Target marketing efforts for the Summer season well in advance (at least 54 days) to capture early planners.
- Monitor your own booking lead times against these Ville-la-Grand averages to identify opportunities for dynamic pricing adjustments.
Popular & Essential Airbnb Amenities in Ville-la-Grand (2025)
Amenity Prevalence
Amenity Insights for Ville-la-Grand
- Essential amenities in Ville-la-Grand that guests expect include: Wifi, Smoke alarm. Lacking these (any) could significantly impact bookings.
- Popular amenities like Kitchen, Heating, TV are common but not universal. Offering these can provide a competitive edge.
Recommendations for Hosts
- Ensure your listing includes all essential amenities for Ville-la-Grand: Wifi, Smoke alarm.
- Prioritize adding missing essentials: Smoke alarm.
- Consider adding popular differentiators like Kitchen or Heating to increase appeal.
- Highlight unique or less common amenities you offer (e.g., hot tub, dedicated workspace, EV charger) in your listing description and photos.
- Regularly check competitor amenities in Ville-la-Grand to stay competitive.
Ville-la-Grand Airbnb Guest Demographics & Profile Analysis (2025)
Guest Profile Summary for Ville-la-Grand
- The typical guest profile for Airbnb in Ville-la-Grand consists of a mix of domestic (55%) and international guests, often arriving from nearby Paris, typically belonging to the Post-2000s (Gen Z/Alpha) group (50%), primarily speaking English or French.
- Domestic travelers account for 54.7% of guests.
- Key international markets include France (54.7%) and Switzerland (8.7%).
- Top languages spoken are English (35.1%) followed by French (29.5%).
- A significant demographic segment is the Post-2000s (Gen Z/Alpha) group, representing 50% of guests.
Recommendations for Hosts
- Balance marketing efforts between domestic and international channels based on the guest mix.
- Tailor amenities and listing descriptions to appeal to the dominant Post-2000s (Gen Z/Alpha) demographic (e.g., highlight fast WiFi, smart home features, local guides).
- Highlight unique local experiences or amenities relevant to the primary guest profile.
- Consider seasonal promotions aligned with peak travel times for key origin markets.
Nearby Short-Term Rental Market Comparison
How does the Ville-la-Grand Airbnb market stack up against its neighbors? Compare key performance metrics like average monthly revenue, ADR, and occupancy rates in surrounding areas to understand the broader regional STR landscape.
| Market | Active Properties | Monthly Revenue | Daily Rate | Avg. Occupancy |
|---|---|---|---|---|
| Lauterbrunnen | 525 | $7,079 | $546.45 | 54% |
| La Rivière-Enverse | 17 | $5,972 | $624.02 | 41% |
| Les Clefs | 30 | $5,741 | $323.11 | 44% |
| Matten bei Interlaken | 52 | $5,674 | $316.63 | 63% |
| Iseltwald | 14 | $5,491 | $331.95 | 58% |
| Habkern | 13 | $5,382 | $344.74 | 50% |
| Interlaken | 288 | $4,987 | $310.52 | 56% |
| Zermatt | 734 | $4,604 | $463.00 | 46% |
| Oberhofen am Thunersee | 24 | $4,572 | $265.94 | 55% |
| Sigriswil | 99 | $4,371 | $271.90 | 58% |