Tournon-sur-Rhône Airbnb Market Analysis 2025: Short Term Rental Data & Vacation Rental Statistics in Auvergne-Rhône-Alpes, France
Is Airbnb profitable in Tournon-sur-Rhône in 2025? Explore comprehensive Airbnb analytics for Tournon-sur-Rhône, Auvergne-Rhône-Alpes, France to uncover income potential. This 2025 STR market report for Tournon-sur-Rhône, based on AirROI data from April 2024 to March 2025, reveals key trends in the niche market of 69 active listings.
Whether you're considering an Airbnb investment in Tournon-sur-Rhône, optimizing your existing vacation rental, or exploring rental arbitrage opportunities, understanding the Tournon-sur-Rhône Airbnb data is crucial. Leveraging the low regulation environment is key to maximizing your short term rental income potential. Let's dive into the specifics.
Key Tournon-sur-Rhône Airbnb Performance Metrics Overview
Monthly Airbnb Revenue Variations & Income Potential in Tournon-sur-Rhône (2025)
Understanding the monthly revenue variations for Airbnb listings in Tournon-sur-Rhône is key to maximizing your short term rental income potential. Seasonality significantly impacts earnings. Our analysis, based on data from the past 12 months, shows that the peak revenue month for STRs in Tournon-sur-Rhône is typically June, while January often presents the lowest earnings, highlighting opportunities for strategic pricing adjustments during shoulder and low seasons. Explore the typical Airbnb income in Tournon-sur-Rhône across different performance tiers:
- Best-in-class properties (Top 10%) achieve $2,498+ monthly, often utilizing dynamic pricing and superior guest experiences.
- Strong performing properties (Top 25%) earn $1,763 or more, indicating effective management and desirable locations/amenities.
- Typical properties (Median) generate around $994 per month, representing the average market performance.
- Entry-level properties (Bottom 25%) see earnings around $449, often with potential for optimization.
Average Monthly Airbnb Earnings Trend in Tournon-sur-Rhône
Tournon-sur-Rhône Airbnb Occupancy Rate Trends (2025)
Maximize your bookings by understanding the Tournon-sur-Rhône STR occupancy trends. Seasonal demand shifts significantly influence how often properties are booked. Typically, Augustsees the highest demand (peak season occupancy), while January experiences the lowest (low season). Effective strategies, like adjusting minimum stays or offering promotions, can boost occupancy during slower periods. Here's how different property tiers perform in Tournon-sur-Rhône:
- Best-in-class properties (Top 10%) achieve 75%+ occupancy, indicating high desirability and potentially optimized availability.
- Strong performing properties (Top 25%) maintain 58% or higher occupancy, suggesting good market fit and guest satisfaction.
- Typical properties (Median) have an occupancy rate around 36%.
- Entry-level properties (Bottom 25%) average 17% occupancy, potentially facing higher vacancy.
Average Monthly Occupancy Rate Trend in Tournon-sur-Rhône
Average Daily Rate (ADR) Airbnb Trends in Tournon-sur-Rhône (2025)
Effective short term rental pricing strategy in Tournon-sur-Rhône involves understanding monthly ADR fluctuations. The Average Daily Rate (ADR) for Airbnb in Tournon-sur-Rhône typically peaks in July and dips lowest during March. Leveraging Airbnb dynamic pricing tools or strategies based on this seasonality can significantly boost revenue. Here's a look at the typical nightly rates achieved:
- Best-in-class properties (Top 10%) command rates of $149+ per night, often due to premium features or locations.
- Strong performing properties (Top 25%) achieve nightly rates of $103 or more.
- Typical properties (Median) charge around $70 per night.
- Entry-level properties (Bottom 25%) earn around $50 per night.
Average Daily Rate (ADR) Trend by Month in Tournon-sur-Rhône
Get Live Tournon-sur-Rhône Market Intelligence 👇
Explore Real-time Analytics
Airbnb Seasonality Analysis & Trends in Tournon-sur-Rhône (2025)
Peak Season (June, May, August)
- Revenue averages $1,973 per month
- Occupancy rates average 46.1%
- Daily rates average $104
Shoulder Season
- Revenue averages $1,289 per month
- Occupancy maintains around 39.4%
- Daily rates hold near $98
Low Season (January, February, March)
- Revenue drops to average $680 per month
- Occupancy decreases to average 30.2%
- Daily rates adjust to average $82
Seasonality Insights for Tournon-sur-Rhône
- The Airbnb seasonality in Tournon-sur-Rhône shows highly seasonal trends requiring careful strategy. While the sections above show seasonal averages, it's also insightful to look at the extremes:
- During the high season, the absolute peak month showcases Tournon-sur-Rhône's highest earning potential, with monthly revenues capable of climbing to $2,008, occupancy reaching a high of 56.4%, and ADRs peaking at $106.
- Conversely, the slowest single month of the year, typically falling within the low season, marks the market's lowest point. In this month, revenue might dip to $661, occupancy could drop to 27.8%, and ADRs may adjust down to $82.
- Understanding both the seasonal averages and these monthly peaks and troughs in revenue, occupancy, and ADR is crucial for maximizing your Airbnb profit potential in Tournon-sur-Rhône.
Seasonal Strategies for Maximizing Profit
- Peak Season: Maximize revenue through premium pricing and potentially longer minimum stays. Ensure high availability.
- Low Season: Offer competitive pricing, special promotions (e.g., extended stay discounts), and flexible cancellation policies. Target off-season travelers like remote workers or budget-conscious guests.
- Shoulder Seasons: Implement dynamic pricing that balances peak and low rates. Target weekend travelers or specific events. Offer slightly more flexible terms than peak season.
- Regularly analyze your own performance against these Tournon-sur-Rhône seasonality benchmarks and adjust your pricing and availability strategy accordingly.
Best Areas for Airbnb Investment in Tournon-sur-Rhône (2025)
Exploring the top neighborhoods for short-term rentals in Tournon-sur-Rhône? This section highlights key areas, outlining why they are attractive for hosts and guests, along with notable local attractions. Consider these locations based on your target guest profile and investment strategy.
| Neighborhood / Area | Why Host Here? (Target Guests & Appeal) | Key Attractions & Landmarks |
|---|---|---|
| Tournon Town Center | The heart of Tournon-sur-Rhône, boasting charming streets, historical architecture, and a vibrant local market. Ideal for tourists who want to experience the authentic French town ambiance. | Château de Tournon, Rhône River promenade, Local markets, Pont de Tournon, Fine dining restaurants |
| Historical District | This area is rich in history and culture, perfect for visitors interested in exploring the local heritage. It's in close proximity to various tourist attractions and scenic views. | Église Sainte-Marie, Tournon heritage museums, Wine tasting tours, Scenic viewpoints, Historic walking trails |
| Wine Country | Nearby vineyards and wineries make this region popular with wine enthusiasts. Guests can enjoy wine tours, tastings, and beautiful landscapes, making it an enticing option for stays. | Cave de Tournon, Vineyard tours, Wine tasting events, Scenic wine routes, Nature walks |
| Riverside Parks | Natural parks along the Rhône River provide scenic views and outdoor activities, appealing to families and nature lovers looking for a relaxing getaway. | Riverside cycling paths, Picnic areas, Nature trails, Kayaking on the Rhône, Garden of the Château |
| Tournon Markets | Known for local markets, offering fresh produce and regional specialties, this area attracts food lovers and those looking to experience local life. | Weekly farmer's market, Local artisan stalls, Gourmet food shops, Cooking classes, Tastings of local delicacies |
| Public Gardens | Beautiful gardens and green spaces within the town enrich the atmosphere. Ideal for tourists seeking tranquility and beautification after exploring the city. | Parc de la Libération, Botanical gardens, Walking paths, Children's play areas, Seasonal floral displays |
| Cultural Events Venues | This area hosts various cultural events and festivals throughout the year, drawing visitors interested in music, art, and local traditions. | Festival of Lights, Cultural exhibitions, Concert venues, Local art shows, Seasonal fairs |
| Culinary District | Home to a variety of restaurants serving local cuisine, attracting food enthusiasts looking to indulge in regional flavors and dining experiences. | Bistro-style eateries, Gourmet restaurants, Cafés with local pastries, Cooking workshops, Food tasting nights |
Understanding Airbnb License Requirements & STR Laws in Tournon-sur-Rhône (2025)
While Tournon-sur-Rhône, Auvergne-Rhône-Alpes, France currently shows low STR regulations, specific Airbnb license requirements might still exist or change. Always verify the latest short term rental regulations and Airbnb license requirements directly with local government authorities for Tournon-sur-Rhône to ensure full compliance before hosting.
(Source: AirROI data, 2025, based on 9% licensed listings)
Top Performing Airbnb Properties in Tournon-sur-Rhône (2025)
Benchmark your potential! Explore examples of top-performing Airbnb properties in Tournon-sur-Rhônebased on Trailing Twelve Month (TTM) revenue. Analyze their characteristics, revenue, occupancy rate, and ADR to understand what drives success in this market.
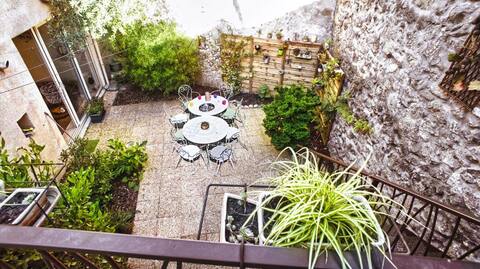
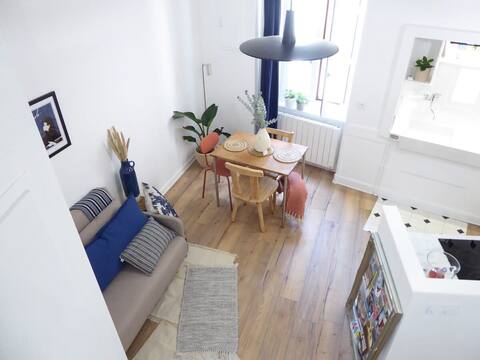
Le Lapin dans la Cour
Entire Place • 4 bedrooms
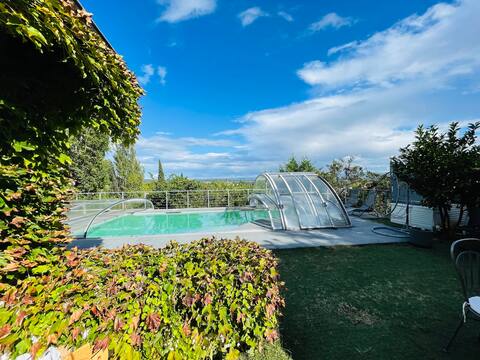
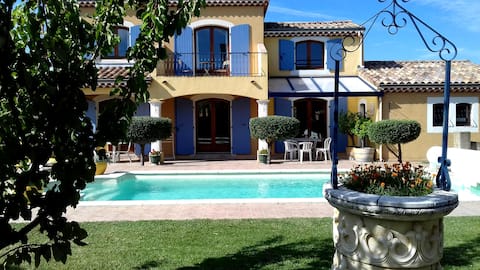
La Maison Verdure & Pool in the Heart of the City
Entire Place • 3 bedrooms
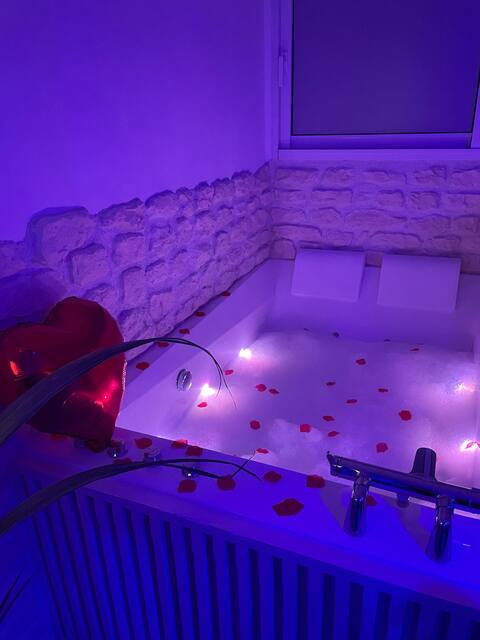
La gabriela - petit cocoon with Balneo
Entire Place • 1 bedroom
Private house in the center near the Castle
Entire Place • 1 bedroom
Hazelnut Villa with Private Pool
Entire Place • 4 bedrooms
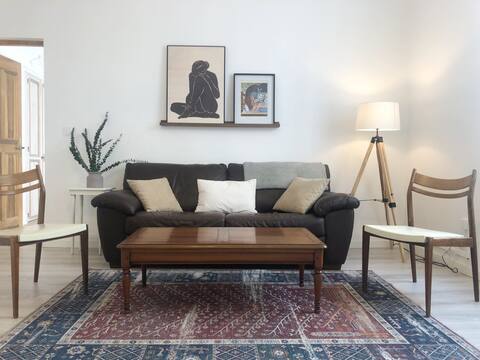
Elegant Apartment in Historic Center of Tournon
Entire Place • 1 bedroom
Note: Performance varies based on location, size, amenities, seasonality, and management quality. Data reflects the past 12 months.
Top Performing Airbnb Hosts in Tournon-sur-Rhône (2025)
Learn from the best! This table showcases top-performing Airbnb hosts in Tournon-sur-Rhône based on the number of properties managed and estimated total revenue over the past year. Analyze their scale and performance metrics.
| Host Name | Properties | Grossing Revenue | Stay Reviews | Avg Rating |
|---|---|---|---|---|
| Matthias | 6 | $117,702 | 132 | 4.58/5.0 |
| Christophe | 1 | $39,922 | 11 | 5.00/5.0 |
| Pascal | 1 | $34,582 | 11 | 4.73/5.0 |
| Agnès | 2 | $31,231 | 202 | 4.94/5.0 |
| Ines | 1 | $29,709 | 101 | 4.96/5.0 |
| Myriam | 6 | $29,069 | 208 | 4.87/5.0 |
| Mickaël Et Alison | 1 | $27,161 | 58 | 4.74/5.0 |
| Sonia | 1 | $23,685 | 60 | 4.85/5.0 |
| Nancy And Julien | 1 | $23,526 | 52 | 5.00/5.0 |
| Solene | 2 | $22,754 | 166 | 4.88/5.0 |
Analyzing the strategies of top hosts, such as their property selection, pricing, and guest communication, can offer valuable lessons for optimizing your own Airbnb operations in Tournon-sur-Rhône.
Dive Deeper: Advanced Tournon-sur-Rhône STR Market Data (2025)
Ready to unlock more insights? AirROI provides access to advanced metrics and comprehensive Airbnb data for Tournon-sur-Rhône. Explore detailed analytics beyond this report to refine your investment strategy, optimize pricing, and maximize your vacation rental profits.
Explore Advanced MetricsTournon-sur-Rhône Short-Term Rental Market Composition (2025): Property & Room Types
Room Type Distribution
Property Type Distribution
Market Composition Insights for Tournon-sur-Rhône
- The Tournon-sur-Rhône Airbnb market composition is heavily skewed towards Entire Home/Apt listings, which make up 85.5% of the 69 active rentals. This indicates strong guest preference for privacy and space.
- Looking at the property type distribution in Tournon-sur-Rhône, Apartment/Condo properties are the most common (60.9%), reflecting the local real estate landscape.
- Houses represent a significant 31.9% portion, catering likely to families or larger groups.
- The presence of 5.8% Hotel/Boutique listings indicates integration with traditional hospitality.
- Smaller segments like outdoor/unique (combined 1.4%) offer potential for unique stay experiences.
Tournon-sur-Rhône Airbnb Room Capacity Analysis (2025): Bedroom Distribution
Distribution of Listings by Number of Bedrooms
Room Capacity Insights for Tournon-sur-Rhône
- The dominant room capacity in Tournon-sur-Rhône is 1 bedroom listings, making up 39.1% of the market. This suggests a strong demand for properties suitable for couples or solo travelers.
- Together, 1 bedroom and 2 bedrooms properties represent 53.6% of the active Airbnb listings in Tournon-sur-Rhône, indicating a high concentration in these sizes.
- A significant 20.2% of listings offer 3+ bedrooms, catering to larger groups and families seeking more space in Tournon-sur-Rhône.
Tournon-sur-Rhône Vacation Rental Guest Capacity Trends (2025)
Distribution of Listings by Guest Capacity
Guest Capacity Insights for Tournon-sur-Rhône
- The most common guest capacity trend in Tournon-sur-Rhône vacation rentals is listings accommodating 2 guests (33.3%). This suggests the primary traveler segment is likely couples or solo travelers.
- Properties designed for 2 guests and 4 guests dominate the Tournon-sur-Rhône STR market, accounting for 53.6% of listings.
- 26.0% of properties accommodate 6+ guests, serving the market segment for larger families or group travel in Tournon-sur-Rhône.
- On average, properties in Tournon-sur-Rhône are equipped to host 3.6 guests.
Tournon-sur-Rhône Airbnb Booking Patterns (2025): Available vs. Booked Days
Available Days Distribution
Booked Days Distribution
Booking Pattern Insights for Tournon-sur-Rhône
- The most common availability pattern in Tournon-sur-Rhône falls within the 271-366 days range, representing 40.6% of listings. This suggests many properties have significant open periods on their calendars.
- Approximately 71.0% of listings show high availability (181+ days open annually), indicating potential for increased bookings or specific owner usage patterns.
- For booked days, the 91-180 days range is most frequent in Tournon-sur-Rhône (30.4%), reflecting common guest stay durations or potential owner blocking patterns.
- A notable 28.9% of properties secure long booking periods (181+ days booked per year), highlighting successful long-term rental strategies or significant owner usage.
Tournon-sur-Rhône Airbnb Minimum Stay Requirements Analysis
Distribution of Listings by Minimum Night Requirement
1 Night
32 listings
50% of total
2 Nights
19 listings
29.7% of total
3 Nights
2 listings
3.1% of total
4-6 Nights
5 listings
7.8% of total
30+ Nights
6 listings
9.4% of total
Key Insights
- The most prevalent minimum stay requirement in Tournon-sur-Rhône is 1 Night, adopted by 50% of listings. This highlights the market's preference for shorter, flexible bookings.
- A strong majority (79.7%) of the Tournon-sur-Rhône Airbnb data shows acceptance of very short stays (1-2 nights), indicating a dynamic, high-turnover market.
Recommendations
- Align with the market by considering a 1 Night minimum stay, as 50% of Tournon-sur-Rhône hosts use this setting.
- Explore offering discounts for stays of 30+ nights to attract the 9.4% of the market seeking extended stays.
- Adjust minimum nights based on seasonality – potentially shorter during low season and longer during peak demand periods in Tournon-sur-Rhône.
Tournon-sur-Rhône Airbnb Cancellation Policy Trends Analysis (2025)
Flexible
23 listings
37.1% of total
Moderate
16 listings
25.8% of total
Firm
9 listings
14.5% of total
Strict
14 listings
22.6% of total
Cancellation Policy Insights for Tournon-sur-Rhône
- The prevailing Airbnb cancellation policy trend in Tournon-sur-Rhône is Flexible, used by 37.1% of listings.
- There's a relatively balanced mix between guest-friendly (62.9%) and stricter (37.1%) policies, offering choices for different guest needs.
Recommendations for Hosts
- Consider adopting a Flexible policy to align with the 37.1% market standard in Tournon-sur-Rhône.
- Regularly review your cancellation policy against competitors and market demand shifts in Tournon-sur-Rhône.
Tournon-sur-Rhône STR Booking Lead Time Analysis (2025)
Average Booking Lead Time by Month
Booking Lead Time Insights for Tournon-sur-Rhône
- The overall average booking lead time for vacation rentals in Tournon-sur-Rhône is 43 days.
- Guests book furthest in advance for stays during June (average 93 days), likely coinciding with peak travel demand or local events.
- The shortest booking windows occur for stays in February (average 20 days), indicating more last-minute travel plans during this time.
- Seasonally, Summer (80 days avg.) sees the longest lead times, while Winter (23 days avg.) has the shortest, reflecting typical travel planning cycles.
Recommendations for Hosts
- Use the overall average lead time (43 days) as a baseline for your pricing and availability strategy in Tournon-sur-Rhône.
- For June stays, consider implementing length-of-stay discounts or slightly higher rates for bookings made less than 93 days out to capitalize on advance planning.
- Target marketing efforts for the Summer season well in advance (at least 80 days) to capture early planners.
- Monitor your own booking lead times against these Tournon-sur-Rhône averages to identify opportunities for dynamic pricing adjustments.
Popular & Essential Airbnb Amenities in Tournon-sur-Rhône (2025)
Amenity Prevalence
Amenity Insights for Tournon-sur-Rhône
- Essential amenities in Tournon-sur-Rhône that guests expect include: Wifi, Kitchen, Heating. Lacking these (any) could significantly impact bookings.
- Popular amenities like Dishes and silverware, Hot water, Cooking basics are common but not universal. Offering these can provide a competitive edge.
Recommendations for Hosts
- Ensure your listing includes all essential amenities for Tournon-sur-Rhône: Wifi, Kitchen, Heating.
- Prioritize adding missing essentials: Wifi, Kitchen, Heating.
- Consider adding popular differentiators like Dishes and silverware or Hot water to increase appeal.
- Highlight unique or less common amenities you offer (e.g., hot tub, dedicated workspace, EV charger) in your listing description and photos.
- Regularly check competitor amenities in Tournon-sur-Rhône to stay competitive.
Tournon-sur-Rhône Airbnb Guest Demographics & Profile Analysis (2025)
Guest Profile Summary for Tournon-sur-Rhône
- The typical guest profile for Airbnb in Tournon-sur-Rhône consists of primarily domestic travelers (80%), often arriving from nearby Lyon, typically belonging to the Post-2000s (Gen Z/Alpha) group (50%), primarily speaking French or English.
- Domestic travelers account for 79.8% of guests.
- Key international markets include France (79.8%) and Netherlands (3%).
- Top languages spoken are French (43.9%) followed by English (32.9%).
- A significant demographic segment is the Post-2000s (Gen Z/Alpha) group, representing 50% of guests.
Recommendations for Hosts
- Target domestic marketing efforts towards travelers from Lyon and Paris.
- Tailor amenities and listing descriptions to appeal to the dominant Post-2000s (Gen Z/Alpha) demographic (e.g., highlight fast WiFi, smart home features, local guides).
- Highlight unique local experiences or amenities relevant to the primary guest profile.
- Consider seasonal promotions aligned with peak travel times for key origin markets.
Nearby Short-Term Rental Market Comparison
How does the Tournon-sur-Rhône Airbnb market stack up against its neighbors? Compare key performance metrics like average monthly revenue, ADR, and occupancy rates in surrounding areas to understand the broader regional STR landscape.
| Market | Active Properties | Monthly Revenue | Daily Rate | Avg. Occupancy |
|---|---|---|---|---|
| Épinac | 14 | $5,147 | $333.01 | 37% |
| Divajeu | 19 | $3,941 | $410.65 | 42% |
| Saint-Germain-au-Mont-d'Or | 10 | $3,928 | $316.02 | 40% |
| Puligny-Montrachet | 11 | $3,908 | $398.00 | 44% |
| Dommartin | 11 | $3,905 | $327.00 | 36% |
| Juliénas | 11 | $3,378 | $292.32 | 46% |
| Courzieu | 11 | $3,267 | $287.83 | 52% |
| Vanosc | 13 | $3,072 | $224.52 | 44% |
| Chantepérier | 20 | $3,057 | $281.60 | 37% |
| Bligny-lès-Beaune | 24 | $2,930 | $233.89 | 44% |