Thueyts Airbnb Market Analysis 2025: Short Term Rental Data & Vacation Rental Statistics in Auvergne-Rhône-Alpes, France
Is Airbnb profitable in Thueyts in 2025? Explore comprehensive Airbnb analytics for Thueyts, Auvergne-Rhône-Alpes, France to uncover income potential. This 2025 STR market report for Thueyts, based on AirROI data from April 2024 to March 2025, reveals key trends in the niche market of 19 active listings.
Whether you're considering an Airbnb investment in Thueyts, optimizing your existing vacation rental, or exploring rental arbitrage opportunities, understanding the Thueyts Airbnb data is crucial. Navigating the high regulation landscape is key to maximizing your short term rental income potential. Let's dive into the specifics.
Key Thueyts Airbnb Performance Metrics Overview
Monthly Airbnb Revenue Variations & Income Potential in Thueyts (2025)
Understanding the monthly revenue variations for Airbnb listings in Thueyts is key to maximizing your short term rental income potential. Seasonality significantly impacts earnings. Our analysis, based on data from the past 12 months, shows that the peak revenue month for STRs in Thueyts is typically August, while February often presents the lowest earnings, highlighting opportunities for strategic pricing adjustments during shoulder and low seasons. Explore the typical Airbnb income in Thueyts across different performance tiers:
- Best-in-class properties (Top 10%) achieve $3,152+ monthly, often utilizing dynamic pricing and superior guest experiences.
- Strong performing properties (Top 25%) earn $1,715 or more, indicating effective management and desirable locations/amenities.
- Typical properties (Median) generate around $940 per month, representing the average market performance.
- Entry-level properties (Bottom 25%) see earnings around $631, often with potential for optimization.
Average Monthly Airbnb Earnings Trend in Thueyts
Thueyts Airbnb Occupancy Rate Trends (2025)
Maximize your bookings by understanding the Thueyts STR occupancy trends. Seasonal demand shifts significantly influence how often properties are booked. Typically, Augustsees the highest demand (peak season occupancy), while February experiences the lowest (low season). Effective strategies, like adjusting minimum stays or offering promotions, can boost occupancy during slower periods. Here's how different property tiers perform in Thueyts:
- Best-in-class properties (Top 10%) achieve 65%+ occupancy, indicating high desirability and potentially optimized availability.
- Strong performing properties (Top 25%) maintain 52% or higher occupancy, suggesting good market fit and guest satisfaction.
- Typical properties (Median) have an occupancy rate around 38%.
- Entry-level properties (Bottom 25%) average 21% occupancy, potentially facing higher vacancy.
Average Monthly Occupancy Rate Trend in Thueyts
Average Daily Rate (ADR) Airbnb Trends in Thueyts (2025)
Effective short term rental pricing strategy in Thueyts involves understanding monthly ADR fluctuations. The Average Daily Rate (ADR) for Airbnb in Thueyts typically peaks in April and dips lowest during December. Leveraging Airbnb dynamic pricing tools or strategies based on this seasonality can significantly boost revenue. Here's a look at the typical nightly rates achieved:
- Best-in-class properties (Top 10%) command rates of $339+ per night, often due to premium features or locations.
- Strong performing properties (Top 25%) achieve nightly rates of $117 or more.
- Typical properties (Median) charge around $89 per night.
- Entry-level properties (Bottom 25%) earn around $65 per night.
Average Daily Rate (ADR) Trend by Month in Thueyts
Get Live Thueyts Market Intelligence 👇

Explore Real-time Analytics
Airbnb Seasonality Analysis & Trends in Thueyts (2025)
Peak Season (August, July, September)
- Revenue averages $2,398 per month
- Occupancy rates average 62.5%
- Daily rates average $135
Shoulder Season
- Revenue averages $1,270 per month
- Occupancy maintains around 37.1%
- Daily rates hold near $138
Low Season (January, February, March)
- Revenue drops to average $570 per month
- Occupancy decreases to average 18.5%
- Daily rates adjust to average $118
Seasonality Insights for Thueyts
- The Airbnb seasonality in Thueyts shows highly seasonal trends requiring careful strategy. While the sections above show seasonal averages, it's also insightful to look at the extremes:
- During the high season, the absolute peak month showcases Thueyts's highest earning potential, with monthly revenues capable of climbing to $2,781, occupancy reaching a high of 69.7%, and ADRs peaking at $171.
- Conversely, the slowest single month of the year, typically falling within the low season, marks the market's lowest point. In this month, revenue might dip to $528, occupancy could drop to 17.5%, and ADRs may adjust down to $117.
- Understanding both the seasonal averages and these monthly peaks and troughs in revenue, occupancy, and ADR is crucial for maximizing your Airbnb profit potential in Thueyts.
Seasonal Strategies for Maximizing Profit
- Peak Season: Maximize revenue through premium pricing and potentially longer minimum stays. Ensure high availability.
- Low Season: Offer competitive pricing, special promotions (e.g., extended stay discounts), and flexible cancellation policies. Target off-season travelers like remote workers or budget-conscious guests.
- Shoulder Seasons: Implement dynamic pricing that balances peak and low rates. Target weekend travelers or specific events. Offer slightly more flexible terms than peak season.
- Regularly analyze your own performance against these Thueyts seasonality benchmarks and adjust your pricing and availability strategy accordingly.
Best Areas for Airbnb Investment in Thueyts (2025)
Exploring the top neighborhoods for short-term rentals in Thueyts? This section highlights key areas, outlining why they are attractive for hosts and guests, along with notable local attractions. Consider these locations based on your target guest profile and investment strategy.
| Neighborhood / Area | Why Host Here? (Target Guests & Appeal) | Key Attractions & Landmarks |
|---|---|---|
| Thueyts Center | Charming center of Thueyts with quaint streets and local shops, ideal for visitors seeking an authentic French village experience. | Église Saint-Pierre, Local markets, Village square |
| Monts d'Ardèche | Stunning natural park area with amazing views and outdoor activities, perfect for nature lovers and adventure seekers. | Canoeing on the Ardèche River, Hiking trails, Wildlife watching |
| Château de Thueyts | A historical site that captivates visitors looking to explore the heritage and architecture of the area. | Ancient castle ruins, Near vineyards, Beautiful landscapes |
| Le Cheylard | Nearby small town with beautiful scenery and a rich cultural scene, suitable for guests wanting to explore rural France. | Local art galleries, Historic architecture, Cafés and restaurants |
| Barrage de Devesset | A beautiful lake area for sports and relaxation, attracting families and outdoor enthusiasts to the region. | Fishing, Kayaking, Picnic spots |
| Beaux Villages | Famous for its picturesque villages, this area draws visitors looking for charming and scenic surroundings. | Scenic drives, Local cuisine, Artisan shops |
| Vals-les-Bains | A popular spa town known for its thermal waters, attracting wellness tourists and relaxation seekers. | Thermal spa resorts, River activities, Shopping |
| Grottes de la Cocalière | Remarkable cave system that attracts those interested in geology and natural wonders, perfect for family outings. | Guided cave tours, Stunning rock formations, Visitor center |
Understanding Airbnb License Requirements & STR Laws in Thueyts (2025)
Yes, Thueyts, Auvergne-Rhône-Alpes, France enforces high STR regulations. Obtaining a license and ensuring compliance is almost certainly required according to current 2025 STR laws. Always verify the latest short term rental regulations and Airbnb license requirements directly with local government authorities for Thueyts to ensure full compliance before hosting.
(Source: AirROI data, 2025, based on 47% licensed listings)
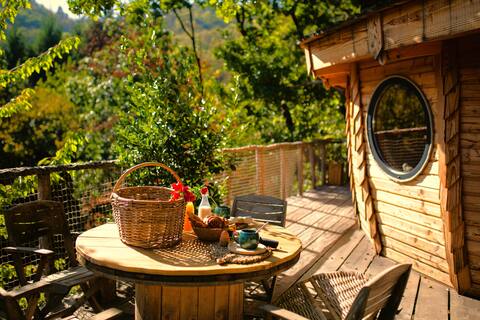
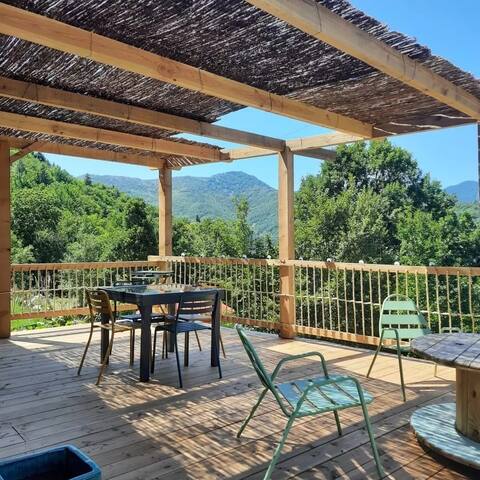
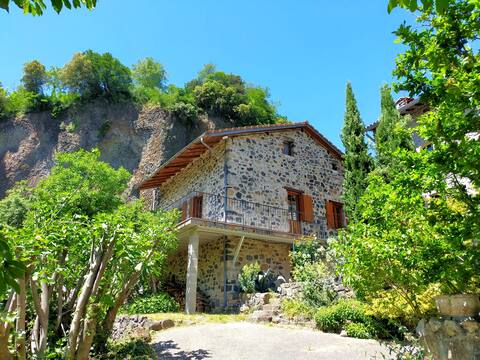
Top Performing Airbnb Properties in Thueyts (2025)
Benchmark your potential! Explore examples of top-performing Airbnb properties in Thueytsbased on Trailing Twelve Month (TTM) revenue. Analyze their characteristics, revenue, occupancy rate, and ADR to understand what drives success in this market.
Cabane du Mas de Dardet
Entire Place • 1 bedroom

Large stone family farmhouse in the chestnut trees
Entire Place • 3 bedrooms
House in Ardèche Pont du Diable Terrace with a view
Entire Place • 2 bedrooms

Gîte de Serrecourt ⭐⭐⭐
Entire Place • 2 bedrooms
3* country house on the Devil's Bridge website.
Entire Place • 3 bedrooms
cherry trees from the mas de dardet
Entire Place • 2 bedrooms
Note: Performance varies based on location, size, amenities, seasonality, and management quality. Data reflects the past 12 months.
Top Performing Airbnb Hosts in Thueyts (2025)
Learn from the best! This table showcases top-performing Airbnb hosts in Thueyts based on the number of properties managed and estimated total revenue over the past year. Analyze their scale and performance metrics.
| Host Name | Properties | Grossing Revenue | Stay Reviews | Avg Rating |
|---|---|---|---|---|
| Nathalie | 2 | $64,377 | 16 | 5.00/5.0 |
| Hortense | 1 | $32,798 | 53 | 4.89/5.0 |
| Peggy | 1 | $17,729 | 16 | 4.88/5.0 |
| Sophie | 1 | $15,857 | 47 | 4.89/5.0 |
| Eliane | 2 | $15,583 | 139 | 4.87/5.0 |
| Philippe | 1 | $14,677 | 29 | 4.93/5.0 |
| Michel | 1 | $11,990 | 12 | 4.75/5.0 |
| Guy | 1 | $9,721 | 72 | 4.86/5.0 |
| Eric | 1 | $9,368 | 14 | 4.14/5.0 |
| Pascale | 1 | $7,970 | 6 | 4.00/5.0 |
Analyzing the strategies of top hosts, such as their property selection, pricing, and guest communication, can offer valuable lessons for optimizing your own Airbnb operations in Thueyts.
Dive Deeper: Advanced Thueyts STR Market Data (2025)
Ready to unlock more insights? AirROI provides access to advanced metrics and comprehensive Airbnb data for Thueyts. Explore detailed analytics beyond this report to refine your investment strategy, optimize pricing, and maximize your vacation rental profits.
Explore Advanced MetricsThueyts Short-Term Rental Market Composition (2025): Property & Room Types
Room Type Distribution
Property Type Distribution
Market Composition Insights for Thueyts
- The Thueyts Airbnb market composition is heavily skewed towards Entire Home/Apt listings, which make up 100% of the 19 active rentals. This indicates strong guest preference for privacy and space.
- Looking at the property type distribution in Thueyts, House properties are the most common (73.7%), reflecting the local real estate landscape.
- Houses represent a significant 73.7% portion, catering likely to families or larger groups.
- The presence of 5.3% Hotel/Boutique listings indicates integration with traditional hospitality.
Thueyts Airbnb Room Capacity Analysis (2025): Bedroom Distribution
Distribution of Listings by Number of Bedrooms
Room Capacity Insights for Thueyts
- The dominant room capacity in Thueyts is 2 bedrooms listings, making up 36.8% of the market. This suggests a strong demand for properties suitable for couples or solo travelers.
- Together, 2 bedrooms and 1 bedroom properties represent 63.1% of the active Airbnb listings in Thueyts, indicating a high concentration in these sizes.
- A significant 31.6% of listings offer 3+ bedrooms, catering to larger groups and families seeking more space in Thueyts.
Thueyts Vacation Rental Guest Capacity Trends (2025)
Distribution of Listings by Guest Capacity
Guest Capacity Insights for Thueyts
- The most common guest capacity trend in Thueyts vacation rentals is listings accommodating 4 guests (31.6%). This suggests the primary traveler segment is likely small families or groups.
- Properties designed for 4 guests and 8+ guests dominate the Thueyts STR market, accounting for 52.7% of listings.
- 31.6% of properties accommodate 6+ guests, serving the market segment for larger families or group travel in Thueyts.
- On average, properties in Thueyts are equipped to host 4.8 guests.
Thueyts Airbnb Booking Patterns (2025): Available vs. Booked Days
Available Days Distribution
Booked Days Distribution
Booking Pattern Insights for Thueyts
- The most common availability pattern in Thueyts falls within the 181-270 days range, representing 63.2% of listings. This suggests many properties have significant open periods on their calendars.
- Approximately 94.8% of listings show high availability (181+ days open annually), indicating potential for increased bookings or specific owner usage patterns.
- For booked days, the 91-180 days range is most frequent in Thueyts (63.2%), reflecting common guest stay durations or potential owner blocking patterns.
- A notable 5.3% of properties secure long booking periods (181+ days booked per year), highlighting successful long-term rental strategies or significant owner usage.
Thueyts Airbnb Minimum Stay Requirements Analysis
Distribution of Listings by Minimum Night Requirement
1 Night
9 listings
50% of total
2 Nights
4 listings
22.2% of total
3 Nights
2 listings
11.1% of total
7-29 Nights
1 listings
5.6% of total
30+ Nights
2 listings
11.1% of total
Key Insights
- The most prevalent minimum stay requirement in Thueyts is 1 Night, adopted by 50% of listings. This highlights the market's preference for shorter, flexible bookings.
- A strong majority (72.2%) of the Thueyts Airbnb data shows acceptance of very short stays (1-2 nights), indicating a dynamic, high-turnover market.
- A significant segment (11.1%) caters to monthly stays (30+ nights) in Thueyts, pointing to opportunities in the extended-stay market.
Recommendations
- Align with the market by considering a 1 Night minimum stay, as 50% of Thueyts hosts use this setting.
- Explore offering discounts for stays of 30+ nights to attract the 11.1% of the market seeking extended stays.
- Adjust minimum nights based on seasonality – potentially shorter during low season and longer during peak demand periods in Thueyts.
Thueyts Airbnb Cancellation Policy Trends Analysis (2025)
Super Strict 60 Days
1 listings
5.9% of total
Moderate
7 listings
41.2% of total
Firm
7 listings
41.2% of total
Strict
2 listings
11.8% of total
Cancellation Policy Insights for Thueyts
- The prevailing Airbnb cancellation policy trend in Thueyts is Moderate, used by 41.2% of listings.
- A majority (53.0%) of hosts in Thueyts utilize Firm or Strict policies, indicating a market where hosts prioritize booking security.
Recommendations for Hosts
- Consider adopting a Moderate policy to align with the 41.2% market standard in Thueyts.
- Using a Strict policy might deter some guests, as only 11.8% of listings use it. Evaluate if potential revenue protection outweighs possible lower booking rates.
- Regularly review your cancellation policy against competitors and market demand shifts in Thueyts.
Thueyts STR Booking Lead Time Analysis (2025)
Average Booking Lead Time by Month
Booking Lead Time Insights for Thueyts
- The overall average booking lead time for vacation rentals in Thueyts is 64 days.
- Guests book furthest in advance for stays during August (average 123 days), likely coinciding with peak travel demand or local events.
- The shortest booking windows occur for stays in February (average 10 days), indicating more last-minute travel plans during this time.
- Seasonally, Summer (100 days avg.) sees the longest lead times, while Winter (22 days avg.) has the shortest, reflecting typical travel planning cycles.
Recommendations for Hosts
- Use the overall average lead time (64 days) as a baseline for your pricing and availability strategy in Thueyts.
- For August stays, consider implementing length-of-stay discounts or slightly higher rates for bookings made less than 123 days out to capitalize on advance planning.
- During February, focus on last-minute booking availability and promotions, as guests book with very short notice (10 days avg.).
- Target marketing efforts for the Summer season well in advance (at least 100 days) to capture early planners.
- Monitor your own booking lead times against these Thueyts averages to identify opportunities for dynamic pricing adjustments.
Popular & Essential Airbnb Amenities in Thueyts (2025)
Amenity Prevalence
Amenity Insights for Thueyts
- Popular amenities like Coffee maker, Kitchen, Heating are common but not universal. Offering these can provide a competitive edge.
Recommendations for Hosts
- Consider adding popular differentiators like Coffee maker or Kitchen to increase appeal.
- Highlight unique or less common amenities you offer (e.g., hot tub, dedicated workspace, EV charger) in your listing description and photos.
- Regularly check competitor amenities in Thueyts to stay competitive.
Thueyts Airbnb Guest Demographics & Profile Analysis (2025)
Guest Profile Summary for Thueyts
- The typical guest profile for Airbnb in Thueyts consists of primarily domestic travelers (86%), often arriving from nearby Lyon, typically belonging to the Post-2000s (Gen Z/Alpha) group (50%), primarily speaking French or English.
- Domestic travelers account for 86.2% of guests.
- Key international markets include France (86.2%) and Netherlands (4.6%).
- Top languages spoken are French (41%) followed by English (34%).
- A significant demographic segment is the Post-2000s (Gen Z/Alpha) group, representing 50% of guests.
Recommendations for Hosts
- Target domestic marketing efforts towards travelers from Lyon and Paris.
- Tailor amenities and listing descriptions to appeal to the dominant Post-2000s (Gen Z/Alpha) demographic (e.g., highlight fast WiFi, smart home features, local guides).
- Highlight unique local experiences or amenities relevant to the primary guest profile.
- Consider seasonal promotions aligned with peak travel times for key origin markets.
Nearby Short-Term Rental Market Comparison
How does the Thueyts Airbnb market stack up against its neighbors? Compare key performance metrics like average monthly revenue, ADR, and occupancy rates in surrounding areas to understand the broader regional STR landscape.
| Market | Active Properties | Monthly Revenue | Daily Rate | Avg. Occupancy |
|---|---|---|---|---|
| Villeneuvette | 13 | $4,150 | $337.56 | 44% |
| Divajeu | 19 | $3,941 | $410.65 | 42% |
| Saint-Germain-au-Mont-d'Or | 10 | $3,928 | $316.02 | 40% |
| Dommartin | 11 | $3,905 | $327.00 | 36% |
| Courzieu | 11 | $3,267 | $287.83 | 52% |
| Vanosc | 13 | $3,072 | $224.52 | 44% |
| Chantepérier | 20 | $3,057 | $281.60 | 37% |
| Gordes | 225 | $2,913 | $366.32 | 43% |
| Redessan | 19 | $2,834 | $334.82 | 34% |
| Fontarèches | 11 | $2,802 | $525.31 | 34% |