Sanilhac Airbnb Market Analysis 2025: Short Term Rental Data & Vacation Rental Statistics in Auvergne-Rhône-Alpes, France
Is Airbnb profitable in Sanilhac in 2025? Explore comprehensive Airbnb analytics for Sanilhac, Auvergne-Rhône-Alpes, France to uncover income potential. This 2025 STR market report for Sanilhac, based on AirROI data from April 2024 to March 2025, reveals key trends in the niche market of 32 active listings.
Whether you're considering an Airbnb investment in Sanilhac, optimizing your existing vacation rental, or exploring rental arbitrage opportunities, understanding the Sanilhac Airbnb data is crucial. Leveraging the low regulation environment is key to maximizing your short term rental income potential. Let's dive into the specifics.
Key Sanilhac Airbnb Performance Metrics Overview
Monthly Airbnb Revenue Variations & Income Potential in Sanilhac (2025)
Understanding the monthly revenue variations for Airbnb listings in Sanilhac is key to maximizing your short term rental income potential. Seasonality significantly impacts earnings. Our analysis, based on data from the past 12 months, shows that the peak revenue month for STRs in Sanilhac is typically August, while March often presents the lowest earnings, highlighting opportunities for strategic pricing adjustments during shoulder and low seasons. Explore the typical Airbnb income in Sanilhac across different performance tiers:
- Best-in-class properties (Top 10%) achieve $4,427+ monthly, often utilizing dynamic pricing and superior guest experiences.
- Strong performing properties (Top 25%) earn $3,169 or more, indicating effective management and desirable locations/amenities.
- Typical properties (Median) generate around $1,504 per month, representing the average market performance.
- Entry-level properties (Bottom 25%) see earnings around $697, often with potential for optimization.
Average Monthly Airbnb Earnings Trend in Sanilhac
Sanilhac Airbnb Occupancy Rate Trends (2025)
Maximize your bookings by understanding the Sanilhac STR occupancy trends. Seasonal demand shifts significantly influence how often properties are booked. Typically, Augustsees the highest demand (peak season occupancy), while March experiences the lowest (low season). Effective strategies, like adjusting minimum stays or offering promotions, can boost occupancy during slower periods. Here's how different property tiers perform in Sanilhac:
- Best-in-class properties (Top 10%) achieve 65%+ occupancy, indicating high desirability and potentially optimized availability.
- Strong performing properties (Top 25%) maintain 46% or higher occupancy, suggesting good market fit and guest satisfaction.
- Typical properties (Median) have an occupancy rate around 32%.
- Entry-level properties (Bottom 25%) average 15% occupancy, potentially facing higher vacancy.
Average Monthly Occupancy Rate Trend in Sanilhac
Average Daily Rate (ADR) Airbnb Trends in Sanilhac (2025)
Effective short term rental pricing strategy in Sanilhac involves understanding monthly ADR fluctuations. The Average Daily Rate (ADR) for Airbnb in Sanilhac typically peaks in August and dips lowest during March. Leveraging Airbnb dynamic pricing tools or strategies based on this seasonality can significantly boost revenue. Here's a look at the typical nightly rates achieved:
- Best-in-class properties (Top 10%) command rates of $324+ per night, often due to premium features or locations.
- Strong performing properties (Top 25%) achieve nightly rates of $192 or more.
- Typical properties (Median) charge around $114 per night.
- Entry-level properties (Bottom 25%) earn around $87 per night.
Average Daily Rate (ADR) Trend by Month in Sanilhac
Get Live Sanilhac Market Intelligence 👇

Explore Real-time Analytics
Airbnb Seasonality Analysis & Trends in Sanilhac (2025)
Peak Season (August, July, May)
- Revenue averages $3,370 per month
- Occupancy rates average 50.5%
- Daily rates average $176
Shoulder Season
- Revenue averages $2,027 per month
- Occupancy maintains around 33.9%
- Daily rates hold near $165
Low Season (January, February, March)
- Revenue drops to average $885 per month
- Occupancy decreases to average 17.7%
- Daily rates adjust to average $147
Seasonality Insights for Sanilhac
- The Airbnb seasonality in Sanilhac shows highly seasonal trends requiring careful strategy. While the sections above show seasonal averages, it's also insightful to look at the extremes:
- During the high season, the absolute peak month showcases Sanilhac's highest earning potential, with monthly revenues capable of climbing to $3,783, occupancy reaching a high of 59.7%, and ADRs peaking at $180.
- Conversely, the slowest single month of the year, typically falling within the low season, marks the market's lowest point. In this month, revenue might dip to $833, occupancy could drop to 15.8%, and ADRs may adjust down to $147.
- Understanding both the seasonal averages and these monthly peaks and troughs in revenue, occupancy, and ADR is crucial for maximizing your Airbnb profit potential in Sanilhac.
Seasonal Strategies for Maximizing Profit
- Peak Season: Maximize revenue through premium pricing and potentially longer minimum stays. Ensure high availability.
- Low Season: Offer competitive pricing, special promotions (e.g., extended stay discounts), and flexible cancellation policies. Target off-season travelers like remote workers or budget-conscious guests.
- Shoulder Seasons: Implement dynamic pricing that balances peak and low rates. Target weekend travelers or specific events. Offer slightly more flexible terms than peak season.
- Regularly analyze your own performance against these Sanilhac seasonality benchmarks and adjust your pricing and availability strategy accordingly.
Best Areas for Airbnb Investment in Sanilhac (2025)
Exploring the top neighborhoods for short-term rentals in Sanilhac? This section highlights key areas, outlining why they are attractive for hosts and guests, along with notable local attractions. Consider these locations based on your target guest profile and investment strategy.
| Neighborhood / Area | Why Host Here? (Target Guests & Appeal) | Key Attractions & Landmarks |
|---|---|---|
| Le Puy-en-Velay | A historic town known for its beautiful architecture and cultural heritage. It attracts tourists who want to experience history and nature, being a gateway to hiking trails like the Camino de Santiago. | St. Michel d'Aiguilhe, Le Puy Cathedral, Croix de Guerre, Rocher St. Michel, Château de Poitiers |
| Saint-Étienne | An industrial city reinventing itself with a vibrant arts scene and cultural events. Great for business travelers and urban explorers looking for affordable accommodations near attractions. | Cité du Design, Saint-Étienne Museum of Modern Art, Parc de la Tête d'Or, Football Stadium Geoffroy-Guichard, Saint-Étienne Cathedral |
| Mont Mézenc | A popular destination for nature enthusiasts and outdoor activities, such as hiking, cycling, and enjoying the scenic views. Ideal for those seeking tranquility and adventure. | Mont Mézenc summit, Hiking trails, Les sources de la Loire, Mont Gerbier de Jonc |
| Yssingeaux | A charming small town in the heart of the Livradois-Forez Regional Natural Park, known for its scenic landscapes and opportunities for outdoor recreation. | La Devisme Falls, Château d'Yssingeaux, Local artisan shops, Hiking paths |
| Errries | Nestled in the mountains, this village is perfect for winter sports and summer hiking. It attracts visitors looking for rustic charm and outdoor activities. | Ski slopes, Mountain hiking trails, Jogging tracks, Scenic views |
| Sainte-Sigolène | A picturesque town known for its natural beauty and cultural richness. It attracts visitors with its artistic events and local crafts. | Cultural festivals, Local markets, Artisan workshops, Beautiful parks |
| Tence | A small town with a rich history, offering a peaceful countryside experience. Perfect for families and weekend getaways, with access to outdoor activities. | Historic sites, Local parks, Nearby rivers for fishing, Scenic countryside |
| Lac de Devesset | A stunning natural lake area offering water sports and relaxation in nature. Great for families and groups looking for outdoor recreational opportunities. | Water activities, Picnic areas, Cycling paths, Scenic walking trails |
Understanding Airbnb License Requirements & STR Laws in Sanilhac (2025)
While Sanilhac, Auvergne-Rhône-Alpes, France currently shows low STR regulations, specific Airbnb license requirements might still exist or change. Always verify the latest short term rental regulations and Airbnb license requirements directly with local government authorities for Sanilhac to ensure full compliance before hosting.
(Source: AirROI data, 2025, based on 3% licensed listings)
Top Performing Airbnb Properties in Sanilhac (2025)
Benchmark your potential! Explore examples of top-performing Airbnb properties in Sanilhacbased on Trailing Twelve Month (TTM) revenue. Analyze their characteristics, revenue, occupancy rate, and ADR to understand what drives success in this market.
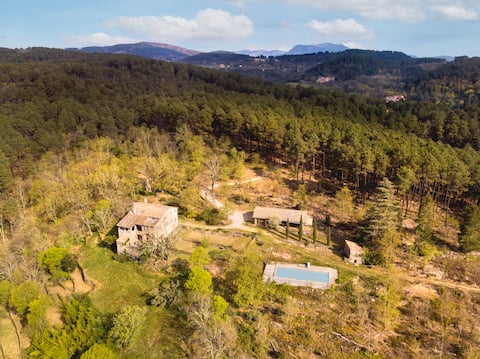
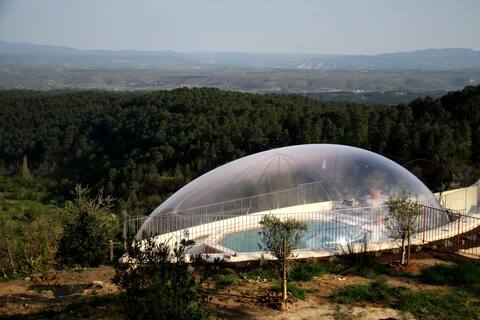
Property in the middle of 12 ha, private pool, 22p
Entire Place • 8 bedrooms
Chez Paul, 12p, pool, and spa
Entire Place • 6 bedrooms
Chez Marcel, house 18 p, private pool 11x5m
Entire Place • 7 bedrooms
Hortense, 2/4 pers barn in "ÔRacines du Calme"
Entire Place • 1 bedroom
Maison Rose, 13 people, air conditioning, pool, and spa
Entire Place • 5 bedrooms
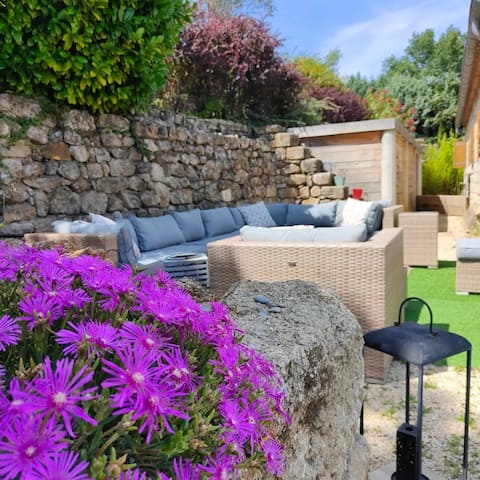
Private Villa with Heated Pool, South Ardèche
Entire Place • 3 bedrooms
Note: Performance varies based on location, size, amenities, seasonality, and management quality. Data reflects the past 12 months.
Top Performing Airbnb Hosts in Sanilhac (2025)
Learn from the best! This table showcases top-performing Airbnb hosts in Sanilhac based on the number of properties managed and estimated total revenue over the past year. Analyze their scale and performance metrics.
| Host Name | Properties | Grossing Revenue | Stay Reviews | Avg Rating |
|---|---|---|---|---|
| Claude | 12 | $272,315 | 289 | 4.75/5.0 |
| Laetitia | 4 | $51,390 | 170 | 4.95/5.0 |
| Natacha | 2 | $43,954 | 48 | 5.00/5.0 |
| Johann | 3 | $39,115 | 46 | 4.87/5.0 |
| Laurent Et Anne Sophie | 1 | $31,139 | 41 | 4.98/5.0 |
| Thibault | 1 | $26,447 | 4 | 5.00/5.0 |
| Laetitia | 1 | $22,256 | 62 | 4.85/5.0 |
| Monique | 1 | $20,881 | 13 | 4.69/5.0 |
| Susanna | 2 | $13,481 | 13 | 4.74/5.0 |
| Nelly Et Antoine | 1 | $8,710 | 122 | 4.91/5.0 |
Analyzing the strategies of top hosts, such as their property selection, pricing, and guest communication, can offer valuable lessons for optimizing your own Airbnb operations in Sanilhac.
Dive Deeper: Advanced Sanilhac STR Market Data (2025)
Ready to unlock more insights? AirROI provides access to advanced metrics and comprehensive Airbnb data for Sanilhac. Explore detailed analytics beyond this report to refine your investment strategy, optimize pricing, and maximize your vacation rental profits.
Explore Advanced MetricsSanilhac Short-Term Rental Market Composition (2025): Property & Room Types
Room Type Distribution
Property Type Distribution
Market Composition Insights for Sanilhac
- The Sanilhac Airbnb market composition is heavily skewed towards Entire Home/Apt listings, which make up 71.9% of the 32 active rentals. This indicates strong guest preference for privacy and space.
- Looking at the property type distribution in Sanilhac, House properties are the most common (53.1%), reflecting the local real estate landscape.
- Houses represent a significant 53.1% portion, catering likely to families or larger groups.
- The presence of 28.1% Hotel/Boutique listings indicates integration with traditional hospitality.
- Smaller segments like unique stays, outdoor/unique (combined 6.2%) offer potential for unique stay experiences.
Sanilhac Airbnb Room Capacity Analysis (2025): Bedroom Distribution
Distribution of Listings by Number of Bedrooms
Room Capacity Insights for Sanilhac
- The dominant room capacity in Sanilhac is 1 bedroom listings, making up 25% of the market. This suggests a strong demand for properties suitable for couples or solo travelers.
- Together, 1 bedroom and 2 bedrooms properties represent 46.9% of the active Airbnb listings in Sanilhac, indicating a high concentration in these sizes.
- A significant 40.7% of listings offer 3+ bedrooms, catering to larger groups and families seeking more space in Sanilhac.
Sanilhac Vacation Rental Guest Capacity Trends (2025)
Distribution of Listings by Guest Capacity
Guest Capacity Insights for Sanilhac
- The most common guest capacity trend in Sanilhac vacation rentals is listings accommodating 8+ guests (31.3%). This suggests the primary traveler segment is likely larger groups.
- Properties designed for 8+ guests and 4 guests dominate the Sanilhac STR market, accounting for 53.2% of listings.
- 40.7% of properties accommodate 6+ guests, serving the market segment for larger families or group travel in Sanilhac.
- On average, properties in Sanilhac are equipped to host 4.8 guests.
Sanilhac Airbnb Booking Patterns (2025): Available vs. Booked Days
Available Days Distribution
Booked Days Distribution
Booking Pattern Insights for Sanilhac
- The most common availability pattern in Sanilhac falls within the 271-366 days range, representing 62.5% of listings. This suggests many properties have significant open periods on their calendars.
- Approximately 90.6% of listings show high availability (181+ days open annually), indicating potential for increased bookings or specific owner usage patterns.
- For booked days, the 31-90 days range is most frequent in Sanilhac (40.6%), reflecting common guest stay durations or potential owner blocking patterns.
- A notable 9.4% of properties secure long booking periods (181+ days booked per year), highlighting successful long-term rental strategies or significant owner usage.
Sanilhac Airbnb Minimum Stay Requirements Analysis
Distribution of Listings by Minimum Night Requirement
1 Night
11 listings
34.4% of total
2 Nights
12 listings
37.5% of total
3 Nights
3 listings
9.4% of total
4-6 Nights
3 listings
9.4% of total
7-29 Nights
3 listings
9.4% of total
Key Insights
- The most prevalent minimum stay requirement in Sanilhac is 2 Nights, adopted by 37.5% of listings. This highlights the market's preference for shorter, flexible bookings.
- A strong majority (71.9%) of the Sanilhac Airbnb data shows acceptance of very short stays (1-2 nights), indicating a dynamic, high-turnover market.
Recommendations
- Align with the market by considering a 2 Nights minimum stay, as 37.5% of Sanilhac hosts use this setting.
- Adjust minimum nights based on seasonality – potentially shorter during low season and longer during peak demand periods in Sanilhac.
Sanilhac Airbnb Cancellation Policy Trends Analysis (2025)
Flexible
10 listings
31.3% of total
Moderate
3 listings
9.4% of total
Firm
2 listings
6.3% of total
Strict
17 listings
53.1% of total
Cancellation Policy Insights for Sanilhac
- The prevailing Airbnb cancellation policy trend in Sanilhac is Strict, used by 53.1% of listings.
- A majority (59.4%) of hosts in Sanilhac utilize Firm or Strict policies, indicating a market where hosts prioritize booking security.
Recommendations for Hosts
- Consider adopting a Strict policy to align with the 53.1% market standard in Sanilhac.
- With 53.1% using Strict terms, this is a viable option in Sanilhac, particularly for high-value properties or during peak demand periods.
- Regularly review your cancellation policy against competitors and market demand shifts in Sanilhac.
Sanilhac STR Booking Lead Time Analysis (2025)
Average Booking Lead Time by Month
Booking Lead Time Insights for Sanilhac
- The overall average booking lead time for vacation rentals in Sanilhac is 99 days.
- Guests book furthest in advance for stays during July (average 132 days), likely coinciding with peak travel demand or local events.
- The shortest booking windows occur for stays in February (average 18 days), indicating more last-minute travel plans during this time.
- Seasonally, Summer (124 days avg.) sees the longest lead times, while Winter (58 days avg.) has the shortest, reflecting typical travel planning cycles.
Recommendations for Hosts
- Use the overall average lead time (99 days) as a baseline for your pricing and availability strategy in Sanilhac.
- For July stays, consider implementing length-of-stay discounts or slightly higher rates for bookings made less than 132 days out to capitalize on advance planning.
- Target marketing efforts for the Summer season well in advance (at least 124 days) to capture early planners.
- Monitor your own booking lead times against these Sanilhac averages to identify opportunities for dynamic pricing adjustments.
Popular & Essential Airbnb Amenities in Sanilhac (2025)
Amenity Prevalence
Amenity Insights for Sanilhac
- Essential amenities in Sanilhac that guests expect include: Free parking on premises. Lacking these (this) could significantly impact bookings.
- Popular amenities like Heating, Kitchen, Cooking basics are common but not universal. Offering these can provide a competitive edge.
Recommendations for Hosts
- Ensure your listing includes all essential amenities for Sanilhac: Free parking on premises.
- Consider adding popular differentiators like Heating or Kitchen to increase appeal.
- Highlight unique or less common amenities you offer (e.g., hot tub, dedicated workspace, EV charger) in your listing description and photos.
- Regularly check competitor amenities in Sanilhac to stay competitive.
Sanilhac Airbnb Guest Demographics & Profile Analysis (2025)
Guest Profile Summary for Sanilhac
- The typical guest profile for Airbnb in Sanilhac consists of primarily domestic travelers (74%), often arriving from nearby Paris, typically belonging to the Post-2000s (Gen Z/Alpha) group (50%), primarily speaking French or English.
- Domestic travelers account for 74.4% of guests.
- Key international markets include France (74.4%) and Germany (7.1%).
- Top languages spoken are French (38.7%) followed by English (33.1%).
- A significant demographic segment is the Post-2000s (Gen Z/Alpha) group, representing 50% of guests.
Recommendations for Hosts
- Target domestic marketing efforts towards travelers from Paris and Lyon.
- Tailor amenities and listing descriptions to appeal to the dominant Post-2000s (Gen Z/Alpha) demographic (e.g., highlight fast WiFi, smart home features, local guides).
- Highlight unique local experiences or amenities relevant to the primary guest profile.
- Consider seasonal promotions aligned with peak travel times for key origin markets.
Nearby Short-Term Rental Market Comparison
How does the Sanilhac Airbnb market stack up against its neighbors? Compare key performance metrics like average monthly revenue, ADR, and occupancy rates in surrounding areas to understand the broader regional STR landscape.
| Market | Active Properties | Monthly Revenue | Daily Rate | Avg. Occupancy |
|---|---|---|---|---|
| Villeneuvette | 13 | $4,150 | $337.56 | 44% |
| Divajeu | 19 | $3,941 | $410.65 | 42% |
| Saint-Germain-au-Mont-d'Or | 10 | $3,928 | $316.02 | 40% |
| Dommartin | 11 | $3,905 | $327.00 | 36% |
| Courzieu | 11 | $3,267 | $287.83 | 52% |
| Vanosc | 13 | $3,072 | $224.52 | 44% |
| Chantepérier | 20 | $3,057 | $281.60 | 37% |
| Gordes | 225 | $2,913 | $366.32 | 43% |
| Redessan | 19 | $2,834 | $334.82 | 34% |
| Fontarèches | 11 | $2,802 | $525.31 | 34% |