Saint-Étienne-de-Fontbellon Airbnb Market Analysis 2025: Short Term Rental Data & Vacation Rental Statistics in Auvergne-Rhône-Alpes, France
Is Airbnb profitable in Saint-Étienne-de-Fontbellon in 2025? Explore comprehensive Airbnb analytics for Saint-Étienne-de-Fontbellon, Auvergne-Rhône-Alpes, France to uncover income potential. This 2025 STR market report for Saint-Étienne-de-Fontbellon, based on AirROI data from April 2024 to March 2025, reveals key trends in the niche market of 35 active listings.
Whether you're considering an Airbnb investment in Saint-Étienne-de-Fontbellon, optimizing your existing vacation rental, or exploring rental arbitrage opportunities, understanding the Saint-Étienne-de-Fontbellon Airbnb data is crucial. Understanding the local regulations is key to maximizing your short term rental income potential. Let's dive into the specifics.
Key Saint-Étienne-de-Fontbellon Airbnb Performance Metrics Overview
Monthly Airbnb Revenue Variations & Income Potential in Saint-Étienne-de-Fontbellon (2025)
Understanding the monthly revenue variations for Airbnb listings in Saint-Étienne-de-Fontbellon is key to maximizing your short term rental income potential. Seasonality significantly impacts earnings. Our analysis, based on data from the past 12 months, shows that the peak revenue month for STRs in Saint-Étienne-de-Fontbellon is typically August, while January often presents the lowest earnings, highlighting opportunities for strategic pricing adjustments during shoulder and low seasons. Explore the typical Airbnb income in Saint-Étienne-de-Fontbellon across different performance tiers:
- Best-in-class properties (Top 10%) achieve $3,401+ monthly, often utilizing dynamic pricing and superior guest experiences.
- Strong performing properties (Top 25%) earn $2,019 or more, indicating effective management and desirable locations/amenities.
- Typical properties (Median) generate around $1,230 per month, representing the average market performance.
- Entry-level properties (Bottom 25%) see earnings around $666, often with potential for optimization.
Average Monthly Airbnb Earnings Trend in Saint-Étienne-de-Fontbellon
Saint-Étienne-de-Fontbellon Airbnb Occupancy Rate Trends (2025)
Maximize your bookings by understanding the Saint-Étienne-de-Fontbellon STR occupancy trends. Seasonal demand shifts significantly influence how often properties are booked. Typically, Augustsees the highest demand (peak season occupancy), while January experiences the lowest (low season). Effective strategies, like adjusting minimum stays or offering promotions, can boost occupancy during slower periods. Here's how different property tiers perform in Saint-Étienne-de-Fontbellon:
- Best-in-class properties (Top 10%) achieve 64%+ occupancy, indicating high desirability and potentially optimized availability.
- Strong performing properties (Top 25%) maintain 50% or higher occupancy, suggesting good market fit and guest satisfaction.
- Typical properties (Median) have an occupancy rate around 34%.
- Entry-level properties (Bottom 25%) average 18% occupancy, potentially facing higher vacancy.
Average Monthly Occupancy Rate Trend in Saint-Étienne-de-Fontbellon
Average Daily Rate (ADR) Airbnb Trends in Saint-Étienne-de-Fontbellon (2025)
Effective short term rental pricing strategy in Saint-Étienne-de-Fontbellon involves understanding monthly ADR fluctuations. The Average Daily Rate (ADR) for Airbnb in Saint-Étienne-de-Fontbellon typically peaks in December and dips lowest during October. Leveraging Airbnb dynamic pricing tools or strategies based on this seasonality can significantly boost revenue. Here's a look at the typical nightly rates achieved:
- Best-in-class properties (Top 10%) command rates of $327+ per night, often due to premium features or locations.
- Strong performing properties (Top 25%) achieve nightly rates of $213 or more.
- Typical properties (Median) charge around $115 per night.
- Entry-level properties (Bottom 25%) earn around $82 per night.
Average Daily Rate (ADR) Trend by Month in Saint-Étienne-de-Fontbellon
Get Live Saint-Étienne-de-Fontbellon Market Intelligence 👇

Explore Real-time Analytics
Airbnb Seasonality Analysis & Trends in Saint-Étienne-de-Fontbellon (2025)
Peak Season (August, July, September)
- Revenue averages $2,625 per month
- Occupancy rates average 53.5%
- Daily rates average $169
Shoulder Season
- Revenue averages $1,321 per month
- Occupancy maintains around 31.4%
- Daily rates hold near $171
Low Season (January, February, October)
- Revenue drops to average $1,084 per month
- Occupancy decreases to average 27.0%
- Daily rates adjust to average $171
Seasonality Insights for Saint-Étienne-de-Fontbellon
- The Airbnb seasonality in Saint-Étienne-de-Fontbellon shows highly seasonal trends requiring careful strategy. While the sections above show seasonal averages, it's also insightful to look at the extremes:
- During the high season, the absolute peak month showcases Saint-Étienne-de-Fontbellon's highest earning potential, with monthly revenues capable of climbing to $3,512, occupancy reaching a high of 68.8%, and ADRs peaking at $179.
- Conversely, the slowest single month of the year, typically falling within the low season, marks the market's lowest point. In this month, revenue might dip to $944, occupancy could drop to 19.9%, and ADRs may adjust down to $162.
- Understanding both the seasonal averages and these monthly peaks and troughs in revenue, occupancy, and ADR is crucial for maximizing your Airbnb profit potential in Saint-Étienne-de-Fontbellon.
Seasonal Strategies for Maximizing Profit
- Peak Season: Maximize revenue through premium pricing and potentially longer minimum stays. Ensure high availability.
- Low Season: Offer competitive pricing, special promotions (e.g., extended stay discounts), and flexible cancellation policies. Target off-season travelers like remote workers or budget-conscious guests.
- Shoulder Seasons: Implement dynamic pricing that balances peak and low rates. Target weekend travelers or specific events. Offer slightly more flexible terms than peak season.
- Regularly analyze your own performance against these Saint-Étienne-de-Fontbellon seasonality benchmarks and adjust your pricing and availability strategy accordingly.
Best Areas for Airbnb Investment in Saint-Étienne-de-Fontbellon (2025)
Exploring the top neighborhoods for short-term rentals in Saint-Étienne-de-Fontbellon? This section highlights key areas, outlining why they are attractive for hosts and guests, along with notable local attractions. Consider these locations based on your target guest profile and investment strategy.
| Neighborhood / Area | Why Host Here? (Target Guests & Appeal) | Key Attractions & Landmarks |
|---|---|---|
| Historic City Center | The heart of Saint-Étienne-de-Fontbellon, featuring charming streets, local shops, and cafes. It attracts visitors looking to experience the local culture and history. | Saint-Étienne Cathedral, Place Jean Jaurès, Musee d'Art et d'Industrie, The Cité du Design, Château de Rochetaillée |
| Parc du Pilat | A beautiful regional park offering nature trails and outdoor activities. Ideal for guests interested in hiking and exploring the natural beauty of the region. | Parc Naturel Régional du Pilat, Gorges de la Loire, Bessey Waterfall, Panorama Point at Crêt de la Perdrix |
| Les Terrasses | A modern residential area with scenic views and parks, popular with families and those seeking a quieter stay. | Parc de la Tête d'Or, Le Golf de Saint-Étienne, Shops and restaurants in the area |
| Cité du Design | A unesco recognized site, it attracts design enthusiasts and hosts various cultural events throughout the year. | Cité du Design, Design Museum, Various art galleries, Workshops and exhibitions |
| La vallée de l'Écotay | Known for its serene landscapes, it's perfect for those looking to escape the hustle and bustle and enjoy peaceful surroundings. | Écotay River, Nature walks, Local farms and markets |
| Les Quartiers de la Gare | This area near the train station is convenient for travelers and features a variety of accommodations and amenities. | Gare de Saint-Étienne-Châteaucreux, Local shops and eateries, Transportation links |
| Saint-Galmier | A charming nearby town known for its thermal spa and historical sites. It's an excellent option for wellness tourism and relaxation. | Thermes de Saint-Galmier, La Ruchelle, Local vineyards and culinary tours |
| Reculée de la Loire | A picturesque area along the Loire River, great for riverside activities and enjoying the natural beauty of the region. | Loire River activities, Scenic walking paths, Local fishing spots |
Understanding Airbnb License Requirements & STR Laws in Saint-Étienne-de-Fontbellon (2025)
With 14% of listings showing registration in 2025, understanding potential Airbnb license requirements is crucial in Saint-Étienne-de-Fontbellon. Always verify the latest short term rental regulations and Airbnb license requirements directly with local government authorities for Saint-Étienne-de-Fontbellon to ensure full compliance before hosting.
(Source: AirROI data, 2025, based on 14% licensed listings)
Top Performing Airbnb Properties in Saint-Étienne-de-Fontbellon (2025)
Benchmark your potential! Explore examples of top-performing Airbnb properties in Saint-Étienne-de-Fontbellonbased on Trailing Twelve Month (TTM) revenue. Analyze their characteristics, revenue, occupancy rate, and ADR to understand what drives success in this market.
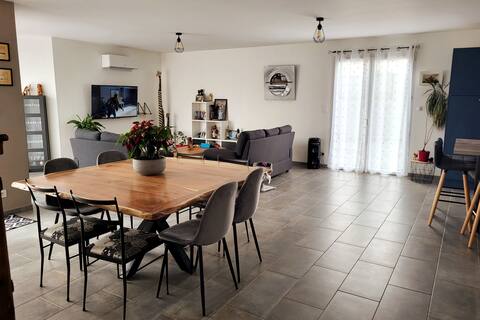
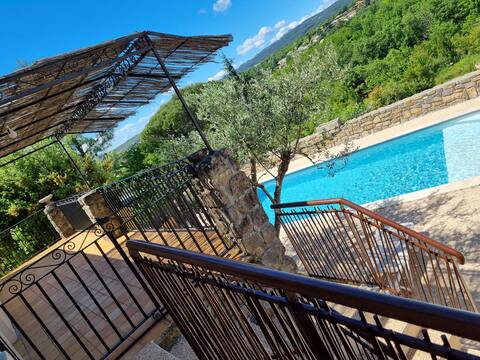
Villa de 130m² avec piscine
Entire Place • 3 bedrooms
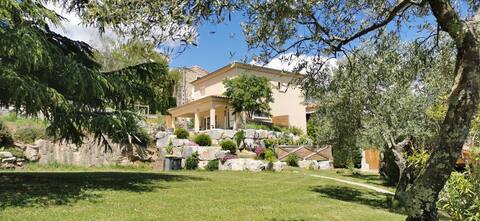
Villa 6 pers comfortable South Aubenas wifi pool
Entire Place • 3 bedrooms
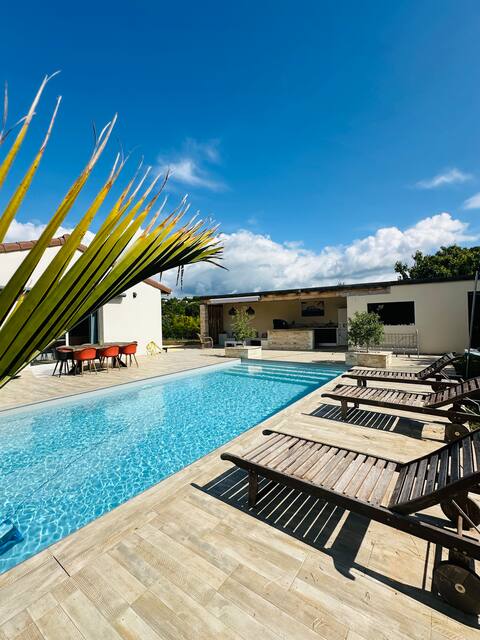
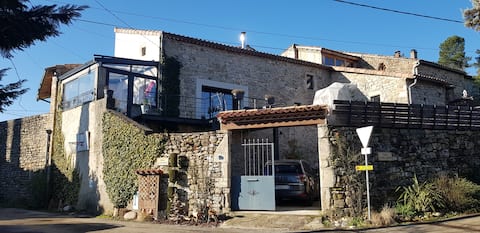
Maison Macacy
Entire Place • 4 bedrooms
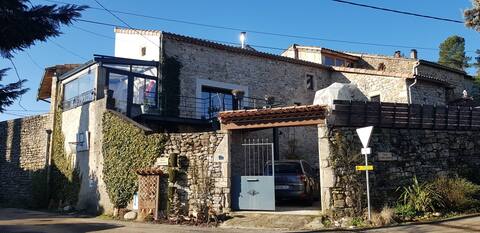
Gîte Les Hirondelles Ardéchoises 12 people
Entire Place ��• 4 bedrooms
Gîte de Giulia
Entire Place • 3 bedrooms
Very nice house with a pool for up to 8 guests
Entire Place • 3 bedrooms
Note: Performance varies based on location, size, amenities, seasonality, and management quality. Data reflects the past 12 months.
Top Performing Airbnb Hosts in Saint-Étienne-de-Fontbellon (2025)
Learn from the best! This table showcases top-performing Airbnb hosts in Saint-Étienne-de-Fontbellon based on the number of properties managed and estimated total revenue over the past year. Analyze their scale and performance metrics.
| Host Name | Properties | Grossing Revenue | Stay Reviews | Avg Rating |
|---|---|---|---|---|
| L Bernard | 4 | $57,737 | 146 | 4.97/5.0 |
| Marie Jose | 2 | $41,814 | 82 | 4.84/5.0 |
| Elodie | 3 | $41,494 | 130 | 4.90/5.0 |
| Host #25422097 | 1 | $30,661 | 0 | 0.00/5.0 |
| Céline | 4 | $26,808 | 10 | 1.25/5.0 |
| Isabelle | 3 | $26,182 | 80 | 3.29/5.0 |
| Magali | 1 | $24,371 | 5 | 4.80/5.0 |
| Yohan-Oksana | 1 | $22,428 | 29 | 5.00/5.0 |
| Cyrille | 1 | $18,086 | 69 | 4.87/5.0 |
| Atika | 1 | $17,605 | 9 | 4.89/5.0 |
Analyzing the strategies of top hosts, such as their property selection, pricing, and guest communication, can offer valuable lessons for optimizing your own Airbnb operations in Saint-Étienne-de-Fontbellon.
Dive Deeper: Advanced Saint-Étienne-de-Fontbellon STR Market Data (2025)
Ready to unlock more insights? AirROI provides access to advanced metrics and comprehensive Airbnb data for Saint-Étienne-de-Fontbellon. Explore detailed analytics beyond this report to refine your investment strategy, optimize pricing, and maximize your vacation rental profits.
Explore Advanced MetricsSaint-Étienne-de-Fontbellon Short-Term Rental Market Composition (2025): Property & Room Types
Room Type Distribution
Property Type Distribution
Market Composition Insights for Saint-Étienne-de-Fontbellon
- The Saint-Étienne-de-Fontbellon Airbnb market composition is heavily skewed towards Entire Home/Apt listings, which make up 100% of the 35 active rentals. This indicates strong guest preference for privacy and space.
- Looking at the property type distribution in Saint-Étienne-de-Fontbellon, House properties are the most common (85.7%), reflecting the local real estate landscape.
- Houses represent a significant 85.7% portion, catering likely to families or larger groups.
- The presence of 8.6% Hotel/Boutique listings indicates integration with traditional hospitality.
Saint-Étienne-de-Fontbellon Airbnb Room Capacity Analysis (2025): Bedroom Distribution
Distribution of Listings by Number of Bedrooms
Room Capacity Insights for Saint-Étienne-de-Fontbellon
- The dominant room capacity in Saint-Étienne-de-Fontbellon is 1 bedroom listings, making up 25.7% of the market. This suggests a strong demand for properties suitable for couples or solo travelers.
- Together, 1 bedroom and 3 bedrooms properties represent 51.4% of the active Airbnb listings in Saint-Étienne-de-Fontbellon, indicating a high concentration in these sizes.
- A significant 51.4% of listings offer 3+ bedrooms, catering to larger groups and families seeking more space in Saint-Étienne-de-Fontbellon.
Saint-Étienne-de-Fontbellon Vacation Rental Guest Capacity Trends (2025)
Distribution of Listings by Guest Capacity
Guest Capacity Insights for Saint-Étienne-de-Fontbellon
- The most common guest capacity trend in Saint-Étienne-de-Fontbellon vacation rentals is listings accommodating 8+ guests (28.6%). This suggests the primary traveler segment is likely larger groups.
- Properties designed for 8+ guests and 6 guests dominate the Saint-Étienne-de-Fontbellon STR market, accounting for 45.7% of listings.
- 51.4% of properties accommodate 6+ guests, serving the market segment for larger families or group travel in Saint-Étienne-de-Fontbellon.
- On average, properties in Saint-Étienne-de-Fontbellon are equipped to host 5.3 guests.
Saint-Étienne-de-Fontbellon Airbnb Booking Patterns (2025): Available vs. Booked Days
Available Days Distribution
Booked Days Distribution
Booking Pattern Insights for Saint-Étienne-de-Fontbellon
- The most common availability pattern in Saint-Étienne-de-Fontbellon falls within the 271-366 days range, representing 54.3% of listings. This suggests many properties have significant open periods on their calendars.
- Approximately 94.3% of listings show high availability (181+ days open annually), indicating potential for increased bookings or specific owner usage patterns.
- For booked days, the 91-180 days range is most frequent in Saint-Étienne-de-Fontbellon (42.9%), reflecting common guest stay durations or potential owner blocking patterns.
- A notable 5.7% of properties secure long booking periods (181+ days booked per year), highlighting successful long-term rental strategies or significant owner usage.
Saint-Étienne-de-Fontbellon Airbnb Minimum Stay Requirements Analysis
Distribution of Listings by Minimum Night Requirement
1 Night
3 listings
8.6% of total
2 Nights
14 listings
40% of total
3 Nights
5 listings
14.3% of total
4-6 Nights
4 listings
11.4% of total
7-29 Nights
6 listings
17.1% of total
30+ Nights
3 listings
8.6% of total
Key Insights
- The most prevalent minimum stay requirement in Saint-Étienne-de-Fontbellon is 2 Nights, adopted by 40% of listings. This highlights the market's preference for shorter, flexible bookings.
Recommendations
- Align with the market by considering a 2 Nights minimum stay, as 40% of Saint-Étienne-de-Fontbellon hosts use this setting.
- If feasible, allowing 1-night stays, especially midweek or during low season, could capture last-minute bookings, as only 8.6% currently do.
- A 2-night minimum appears standard (40%). Consider this for weekends or peak periods.
- Explore offering discounts for stays of 30+ nights to attract the 8.6% of the market seeking extended stays.
- Adjust minimum nights based on seasonality – potentially shorter during low season and longer during peak demand periods in Saint-Étienne-de-Fontbellon.
Saint-Étienne-de-Fontbellon Airbnb Cancellation Policy Trends Analysis (2025)
Flexible
9 listings
33.3% of total
Moderate
11 listings
40.7% of total
Firm
1 listings
3.7% of total
Strict
6 listings
22.2% of total
Cancellation Policy Insights for Saint-Étienne-de-Fontbellon
- The prevailing Airbnb cancellation policy trend in Saint-Étienne-de-Fontbellon is Moderate, used by 40.7% of listings.
- The market strongly favors guest-friendly terms, with 74.0% of listings offering Flexible or Moderate policies. This suggests guests in Saint-Étienne-de-Fontbellon may expect booking flexibility.
Recommendations for Hosts
- Consider adopting a Moderate policy to align with the 40.7% market standard in Saint-Étienne-de-Fontbellon.
- Regularly review your cancellation policy against competitors and market demand shifts in Saint-Étienne-de-Fontbellon.
Saint-Étienne-de-Fontbellon STR Booking Lead Time Analysis (2025)
Average Booking Lead Time by Month
Booking Lead Time Insights for Saint-Étienne-de-Fontbellon
- The overall average booking lead time for vacation rentals in Saint-Étienne-de-Fontbellon is 50 days.
- Guests book furthest in advance for stays during August (average 92 days), likely coinciding with peak travel demand or local events.
- The shortest booking windows occur for stays in December (average 17 days), indicating more last-minute travel plans during this time.
- Seasonally, Summer (80 days avg.) sees the longest lead times, while Winter (18 days avg.) has the shortest, reflecting typical travel planning cycles.
Recommendations for Hosts
- Use the overall average lead time (50 days) as a baseline for your pricing and availability strategy in Saint-Étienne-de-Fontbellon.
- For August stays, consider implementing length-of-stay discounts or slightly higher rates for bookings made less than 92 days out to capitalize on advance planning.
- Target marketing efforts for the Summer season well in advance (at least 80 days) to capture early planners.
- Monitor your own booking lead times against these Saint-Étienne-de-Fontbellon averages to identify opportunities for dynamic pricing adjustments.
Popular & Essential Airbnb Amenities in Saint-Étienne-de-Fontbellon (2025)
Amenity Prevalence
Amenity Insights for Saint-Étienne-de-Fontbellon
- Essential amenities in Saint-Étienne-de-Fontbellon that guests expect include: Kitchen, Free parking on premises, Wifi, Hot water. Lacking these (any) could significantly impact bookings.
- Popular amenities like Smoke alarm, TV, Heating are common but not universal. Offering these can provide a competitive edge.
Recommendations for Hosts
- Ensure your listing includes all essential amenities for Saint-Étienne-de-Fontbellon: Kitchen, Free parking on premises, Wifi, Hot water.
- Prioritize adding missing essentials: Wifi, Hot water.
- Consider adding popular differentiators like Smoke alarm or TV to increase appeal.
- Highlight unique or less common amenities you offer (e.g., hot tub, dedicated workspace, EV charger) in your listing description and photos.
- Regularly check competitor amenities in Saint-Étienne-de-Fontbellon to stay competitive.
Saint-Étienne-de-Fontbellon Airbnb Guest Demographics & Profile Analysis (2025)
Guest Profile Summary for Saint-Étienne-de-Fontbellon
- The typical guest profile for Airbnb in Saint-Étienne-de-Fontbellon consists of primarily domestic travelers (85%), often arriving from nearby Lyon, typically belonging to the Post-2000s (Gen Z/Alpha) group (50%), primarily speaking French or English.
- Domestic travelers account for 84.5% of guests.
- Key international markets include France (84.5%) and Belgium (5.2%).
- Top languages spoken are French (41%) followed by English (33.6%).
- A significant demographic segment is the Post-2000s (Gen Z/Alpha) group, representing 50% of guests.
Recommendations for Hosts
- Target domestic marketing efforts towards travelers from Lyon and Paris.
- Tailor amenities and listing descriptions to appeal to the dominant Post-2000s (Gen Z/Alpha) demographic (e.g., highlight fast WiFi, smart home features, local guides).
- Highlight unique local experiences or amenities relevant to the primary guest profile.
- Consider seasonal promotions aligned with peak travel times for key origin markets.
Nearby Short-Term Rental Market Comparison
How does the Saint-Étienne-de-Fontbellon Airbnb market stack up against its neighbors? Compare key performance metrics like average monthly revenue, ADR, and occupancy rates in surrounding areas to understand the broader regional STR landscape.
| Market | Active Properties | Monthly Revenue | Daily Rate | Avg. Occupancy |
|---|---|---|---|---|
| Villeneuvette | 13 | $4,150 | $337.56 | 44% |
| Divajeu | 19 | $3,941 | $410.65 | 42% |
| Saint-Germain-au-Mont-d'Or | 10 | $3,928 | $316.02 | 40% |
| Dommartin | 11 | $3,905 | $327.00 | 36% |
| Courzieu | 11 | $3,267 | $287.83 | 52% |
| Vanosc | 13 | $3,072 | $224.52 | 44% |
| Chantepérier | 20 | $3,057 | $281.60 | 37% |
| Gordes | 225 | $2,913 | $366.32 | 43% |
| Redessan | 19 | $2,834 | $334.82 | 34% |
| Fontarèches | 11 | $2,802 | $525.31 | 34% |