Ornex Airbnb Market Analysis 2025: Short Term Rental Data & Vacation Rental Statistics in Auvergne-Rhône-Alpes, France
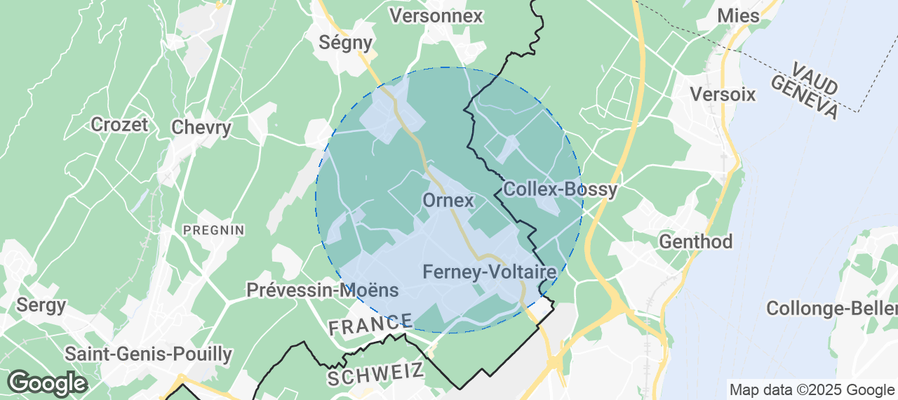
Is Airbnb profitable in Ornex in 2025? Explore comprehensive Airbnb analytics for Ornex, Auvergne-Rhône-Alpes, France to uncover income potential. This 2025 STR market report for Ornex, based on AirROI data from April 2024 to March 2025, reveals key trends in the niche market of 19 active listings.
Whether you're considering an Airbnb investment in Ornex, optimizing your existing vacation rental, or exploring rental arbitrage opportunities, understanding the Ornex Airbnb data is crucial. Leveraging the low regulation environment is key to maximizing your short term rental income potential. Let's dive into the specifics.
Key Ornex Airbnb Performance Metrics Overview
Monthly Airbnb Revenue Variations & Income Potential in Ornex (2025)
Understanding the monthly revenue variations for Airbnb listings in Ornex is key to maximizing your short term rental income potential. Seasonality significantly impacts earnings. Our analysis, based on data from the past 12 months, shows that the peak revenue month for STRs in Ornex is typically May, while March often presents the lowest earnings, highlighting opportunities for strategic pricing adjustments during shoulder and low seasons. Explore the typical Airbnb income in Ornex across different performance tiers:
- Best-in-class properties (Top 10%) achieve $2,783+ monthly, often utilizing dynamic pricing and superior guest experiences.
- Strong performing properties (Top 25%) earn $1,956 or more, indicating effective management and desirable locations/amenities.
- Typical properties (Median) generate around $1,219 per month, representing the average market performance.
- Entry-level properties (Bottom 25%) see earnings around $647, often with potential for optimization.
Average Monthly Airbnb Earnings Trend in Ornex
Ornex Airbnb Occupancy Rate Trends (2025)
Maximize your bookings by understanding the Ornex STR occupancy trends. Seasonal demand shifts significantly influence how often properties are booked. Typically, Septembersees the highest demand (peak season occupancy), while March experiences the lowest (low season). Effective strategies, like adjusting minimum stays or offering promotions, can boost occupancy during slower periods. Here's how different property tiers perform in Ornex:
- Best-in-class properties (Top 10%) achieve 83%+ occupancy, indicating high desirability and potentially optimized availability.
- Strong performing properties (Top 25%) maintain 68% or higher occupancy, suggesting good market fit and guest satisfaction.
- Typical properties (Median) have an occupancy rate around 47%.
- Entry-level properties (Bottom 25%) average 26% occupancy, potentially facing higher vacancy.
Average Monthly Occupancy Rate Trend in Ornex
Average Daily Rate (ADR) Airbnb Trends in Ornex (2025)
Effective short term rental pricing strategy in Ornex involves understanding monthly ADR fluctuations. The Average Daily Rate (ADR) for Airbnb in Ornex typically peaks in November and dips lowest during April. Leveraging Airbnb dynamic pricing tools or strategies based on this seasonality can significantly boost revenue. Here's a look at the typical nightly rates achieved:
- Best-in-class properties (Top 10%) command rates of $172+ per night, often due to premium features or locations.
- Strong performing properties (Top 25%) achieve nightly rates of $100 or more.
- Typical properties (Median) charge around $78 per night.
- Entry-level properties (Bottom 25%) earn around $56 per night.
Average Daily Rate (ADR) Trend by Month in Ornex
Get Live Ornex Market Intelligence 👇
Explore Real-time Analytics
Airbnb Seasonality Analysis & Trends in Ornex (2025)
Peak Season (May, July, September)
- Revenue averages $1,924 per month
- Occupancy rates average 58.2%
- Daily rates average $85
Shoulder Season
- Revenue averages $1,474 per month
- Occupancy maintains around 49.7%
- Daily rates hold near $92
Low Season (February, March, November)
- Revenue drops to average $893 per month
- Occupancy decreases to average 34.2%
- Daily rates adjust to average $105
Seasonality Insights for Ornex
- The Airbnb seasonality in Ornex shows highly seasonal trends requiring careful strategy. While the sections above show seasonal averages, it's also insightful to look at the extremes:
- During the high season, the absolute peak month showcases Ornex's highest earning potential, with monthly revenues capable of climbing to $1,966, occupancy reaching a high of 63.9%, and ADRs peaking at $110.
- Conversely, the slowest single month of the year, typically falling within the low season, marks the market's lowest point. In this month, revenue might dip to $708, occupancy could drop to 29.8%, and ADRs may adjust down to $82.
- Understanding both the seasonal averages and these monthly peaks and troughs in revenue, occupancy, and ADR is crucial for maximizing your Airbnb profit potential in Ornex.
Seasonal Strategies for Maximizing Profit
- Peak Season: Maximize revenue through premium pricing and potentially longer minimum stays. Ensure high availability.
- Low Season: Offer competitive pricing, special promotions (e.g., extended stay discounts), and flexible cancellation policies. Target off-season travelers like remote workers or budget-conscious guests.
- Shoulder Seasons: Implement dynamic pricing that balances peak and low rates. Target weekend travelers or specific events. Offer slightly more flexible terms than peak season.
- Regularly analyze your own performance against these Ornex seasonality benchmarks and adjust your pricing and availability strategy accordingly.
Best Areas for Airbnb Investment in Ornex (2025)
Exploring the top neighborhoods for short-term rentals in Ornex? This section highlights key areas, outlining why they are attractive for hosts and guests, along with notable local attractions. Consider these locations based on your target guest profile and investment strategy.
| Neighborhood / Area | Why Host Here? (Target Guests & Appeal) | Key Attractions & Landmarks |
|---|---|---|
| Ornex Centre | Charming town center ideal for visitors seeking a quaint French experience with local shops and restaurants. Convenient access to public transportation makes it easy to explore the region. | Local markets, Café de l'Atelier, Flowery park, Historic architecture |
| Lac Léman | Beautiful lakeside area that offers a serene environment for vacationers. It attracts nature lovers and those looking for water activities like sailing and fishing. | Lake Geneva, Beach parks, Water sports, Walking trails, Scenic views |
| Swiss Border | Proximity to Switzerland makes this area attractive for international tourists and business travelers alike. Excellent for those seeking luxury experiences with easy access to Geneva. | Geneva accessibility, Nature parks, Cultural events, Shopping |
| Monts Jura | A stunning mountainous region perfect for outdoor enthusiasts. Ideal for tourists looking for hiking, skiing, and nature retreats. | Ski resorts, Hiking trails, Panoramic views, Nature reserves |
| Ferney-Voltaire | A neighboring town to Ornex with rich history and cultural sites. Attracts both tourists and expatriates working in Geneva. | Voltaire's house, Local cafés, Cultural festivals, Historic sites |
| Val Serine | A quaint rural setting offering a peaceful retreat. Visitors looking for a countryside experience with beautiful landscapes will find it attractive. | Scenic countryside, Wine tours, Cycling routes, Local farms |
| Pérouges | A medieval village nearby that draws visitors for its well-preserved architecture and historic charm. This area is perfect for those interested in history and culture. | Historical village, Cobbled streets, Traditional restaurants, Cultural heritage |
| Saint-Genis-Pouilly | An urban area with close ties to scientific research and technology parks. Popular with business travelers and those seeking modern amenities. | CERN, Public parks, Shopping centers, Cultural events |
Understanding Airbnb License Requirements & STR Laws in Ornex (2025)
While Ornex, Auvergne-Rhône-Alpes, France currently shows low STR regulations, specific Airbnb license requirements might still exist or change. Always verify the latest short term rental regulations and Airbnb license requirements directly with local government authorities for Ornex to ensure full compliance before hosting.
(Source: AirROI data, 2025, finding no licensed listings among those analyzed)
Top Performing Airbnb Properties in Ornex (2025)
Benchmark your potential! Explore examples of top-performing Airbnb properties in Ornexbased on Trailing Twelve Month (TTM) revenue. Analyze their characteristics, revenue, occupancy rate, and ADR to understand what drives success in this market.
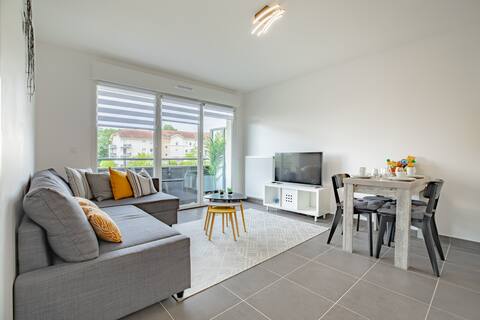
Superbe appart ORNEX, GE Cern ONU Palexpo *free P*
Entire Place • 1 bedroom
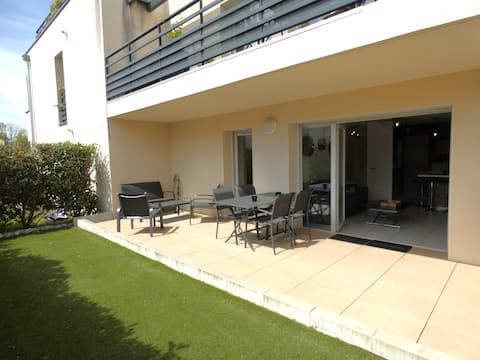
Terrace near Geneva
Entire Place • 1 bedroom
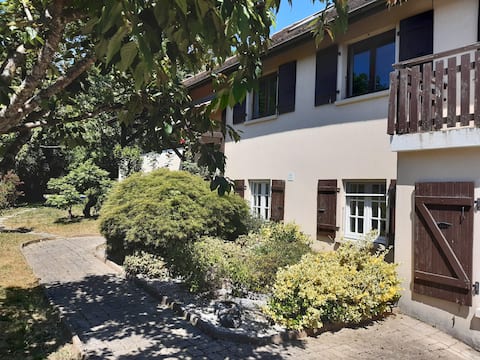
House between lake and mountain.
Entire Place • 5 bedrooms

Cosy studio - Geneva - Free parking
Entire Place • 1 bedroom

Cosy Loft near Geneva with Wi-Fi and Netflix
Entire Place • N/A
Bus to Airport, UN, CERN, Geneva, Palexpo, Arena
Entire Place • N/A
Note: Performance varies based on location, size, amenities, seasonality, and management quality. Data reflects the past 12 months.
Top Performing Airbnb Hosts in Ornex (2025)
Learn from the best! This table showcases top-performing Airbnb hosts in Ornex based on the number of properties managed and estimated total revenue over the past year. Analyze their scale and performance metrics.
| Host Name | Properties | Grossing Revenue | Stay Reviews | Avg Rating |
|---|---|---|---|---|
| Laura Et Maxime | 2 | $29,770 | 16 | 4.32/5.0 |
| Carlos | 1 | $25,463 | 55 | 4.85/5.0 |
| Swann | 1 | $21,703 | 8 | 4.00/5.0 |
| Axelle | 1 | $20,868 | 5 | 4.60/5.0 |
| Lenka | 2 | $17,323 | 346 | 4.71/5.0 |
| Host #455221372 | 1 | $16,994 | 10 | 4.50/5.0 |
| Pascal Et Linda | 1 | $15,929 | 163 | 4.95/5.0 |
| Alicia | 1 | $15,477 | 6 | 4.17/5.0 |
| Mouloud | 1 | $14,233 | 42 | 4.83/5.0 |
| Anne-Claire Et Alexis | 1 | $13,828 | 40 | 4.90/5.0 |
Analyzing the strategies of top hosts, such as their property selection, pricing, and guest communication, can offer valuable lessons for optimizing your own Airbnb operations in Ornex.
Dive Deeper: Advanced Ornex STR Market Data (2025)
Ready to unlock more insights? AirROI provides access to advanced metrics and comprehensive Airbnb data for Ornex. Explore detailed analytics beyond this report to refine your investment strategy, optimize pricing, and maximize your vacation rental profits.
Explore Advanced MetricsOrnex Short-Term Rental Market Composition (2025): Property & Room Types
Room Type Distribution
Property Type Distribution
Market Composition Insights for Ornex
- The Ornex Airbnb market composition is heavily skewed towards Entire Home/Apt listings, which make up 68.4% of the 19 active rentals. This indicates strong guest preference for privacy and space.
- However, a notable 31.6% share for Private Rooms suggests opportunities for budget-conscious travelers or hosts renting out spare rooms.
- Looking at the property type distribution in Ornex, Apartment/Condo properties are the most common (63.2%), reflecting the local real estate landscape.
- Houses represent a significant 31.6% portion, catering likely to families or larger groups.
- The presence of 5.3% Hotel/Boutique listings indicates integration with traditional hospitality.
Ornex Airbnb Room Capacity Analysis (2025): Bedroom Distribution
Distribution of Listings by Number of Bedrooms
Room Capacity Insights for Ornex
- The dominant room capacity in Ornex is 1 bedroom listings, making up 42.1% of the market. This suggests a strong demand for properties suitable for couples or solo travelers.
- Together, 1 bedroom and 3 bedrooms properties represent 47.4% of the active Airbnb listings in Ornex, indicating a high concentration in these sizes.
Ornex Vacation Rental Guest Capacity Trends (2025)
Distribution of Listings by Guest Capacity
Guest Capacity Insights for Ornex
- The most common guest capacity trend in Ornex vacation rentals is listings accommodating 2 guests (31.6%). This suggests the primary traveler segment is likely couples or solo travelers.
- Properties designed for 2 guests and 4 guests dominate the Ornex STR market, accounting for 52.7% of listings.
- On average, properties in Ornex are equipped to host 2.0 guests.
Ornex Airbnb Booking Patterns (2025): Available vs. Booked Days
Available Days Distribution
Booked Days Distribution
Booking Pattern Insights for Ornex
- The most common availability pattern in Ornex falls within the 181-270 days range, representing 47.4% of listings. This suggests many properties have significant open periods on their calendars.
- Approximately 63.2% of listings show high availability (181+ days open annually), indicating potential for increased bookings or specific owner usage patterns.
- For booked days, the 91-180 days range is most frequent in Ornex (47.4%), reflecting common guest stay durations or potential owner blocking patterns.
- A notable 36.8% of properties secure long booking periods (181+ days booked per year), highlighting successful long-term rental strategies or significant owner usage.
Ornex Airbnb Minimum Stay Requirements Analysis
Distribution of Listings by Minimum Night Requirement
1 Night
9 listings
52.9% of total
2 Nights
3 listings
17.6% of total
4-6 Nights
2 listings
11.8% of total
30+ Nights
3 listings
17.6% of total
Key Insights
- The most prevalent minimum stay requirement in Ornex is 1 Night, adopted by 52.9% of listings. This highlights the market's preference for shorter, flexible bookings.
- A strong majority (70.5%) of the Ornex Airbnb data shows acceptance of very short stays (1-2 nights), indicating a dynamic, high-turnover market.
- A significant segment (17.6%) caters to monthly stays (30+ nights) in Ornex, pointing to opportunities in the extended-stay market.
Recommendations
- Align with the market by considering a 1 Night minimum stay, as 52.9% of Ornex hosts use this setting.
- Explore offering discounts for stays of 30+ nights to attract the 17.6% of the market seeking extended stays.
- Adjust minimum nights based on seasonality – potentially shorter during low season and longer during peak demand periods in Ornex.
Ornex Airbnb Cancellation Policy Trends Analysis (2025)
Flexible
7 listings
43.8% of total
Moderate
3 listings
18.8% of total
Firm
1 listings
6.3% of total
Strict
5 listings
31.3% of total
Cancellation Policy Insights for Ornex
- The prevailing Airbnb cancellation policy trend in Ornex is Flexible, used by 43.8% of listings.
- There's a relatively balanced mix between guest-friendly (62.6%) and stricter (37.6%) policies, offering choices for different guest needs.
Recommendations for Hosts
- Consider adopting a Flexible policy to align with the 43.8% market standard in Ornex.
- With 31.3% using Strict terms, this is a viable option in Ornex, particularly for high-value properties or during peak demand periods.
- Regularly review your cancellation policy against competitors and market demand shifts in Ornex.
Ornex STR Booking Lead Time Analysis (2025)
Average Booking Lead Time by Month
Booking Lead Time Insights for Ornex
- The overall average booking lead time for vacation rentals in Ornex is 63 days.
- Guests book furthest in advance for stays during August (average 125 days), likely coinciding with peak travel demand or local events.
- The shortest booking windows occur for stays in February (average 27 days), indicating more last-minute travel plans during this time.
- Seasonally, Summer (102 days avg.) sees the longest lead times, while Winter (39 days avg.) has the shortest, reflecting typical travel planning cycles.
Recommendations for Hosts
- Use the overall average lead time (63 days) as a baseline for your pricing and availability strategy in Ornex.
- For August stays, consider implementing length-of-stay discounts or slightly higher rates for bookings made less than 125 days out to capitalize on advance planning.
- Target marketing efforts for the Summer season well in advance (at least 102 days) to capture early planners.
- Monitor your own booking lead times against these Ornex averages to identify opportunities for dynamic pricing adjustments.
Popular & Essential Airbnb Amenities in Ornex (2025)
Amenity Prevalence
Amenity Insights for Ornex
- Essential amenities in Ornex that guests expect include: Free parking on premises. Lacking these (this) could significantly impact bookings.
- Popular amenities like Hot water, Kitchen, Heating are common but not universal. Offering these can provide a competitive edge.
- Warning: Wifi is not universally provided but is considered essential globally. Ensure reliable Wifi is offered.
Recommendations for Hosts
- Ensure your listing includes all essential amenities for Ornex: Free parking on premises.
- Consider adding popular differentiators like Hot water or Kitchen to increase appeal.
- Highlight unique or less common amenities you offer (e.g., hot tub, dedicated workspace, EV charger) in your listing description and photos.
- Regularly check competitor amenities in Ornex to stay competitive.
Ornex Airbnb Guest Demographics & Profile Analysis (2025)
Guest Profile Summary for Ornex
- The typical guest profile for Airbnb in Ornex consists of a mix of domestic (56%) and international guests, often arriving from nearby Lyon, typically belonging to the Post-2000s (Gen Z/Alpha) group (50%), primarily speaking English or French.
- Domestic travelers account for 56.3% of guests.
- Key international markets include France (56.3%) and Switzerland (7.1%).
- Top languages spoken are English (33.5%) followed by French (30.8%).
- A significant demographic segment is the Post-2000s (Gen Z/Alpha) group, representing 50% of guests.
Recommendations for Hosts
- Balance marketing efforts between domestic and international channels based on the guest mix.
- Tailor amenities and listing descriptions to appeal to the dominant Post-2000s (Gen Z/Alpha) demographic (e.g., highlight fast WiFi, smart home features, local guides).
- Highlight unique local experiences or amenities relevant to the primary guest profile.
- Consider seasonal promotions aligned with peak travel times for key origin markets.
Nearby Short-Term Rental Market Comparison
How does the Ornex Airbnb market stack up against its neighbors? Compare key performance metrics like average monthly revenue, ADR, and occupancy rates in surrounding areas to understand the broader regional STR landscape.
| Market | Active Properties | Monthly Revenue | Daily Rate | Avg. Occupancy |
|---|---|---|---|---|
| Lauterbrunnen | 525 | $7,079 | $546.45 | 54% |
| La Rivière-Enverse | 17 | $5,972 | $624.02 | 41% |
| Les Clefs | 30 | $5,741 | $323.11 | 44% |
| Matten bei Interlaken | 52 | $5,674 | $316.63 | 63% |
| Iseltwald | 14 | $5,491 | $331.95 | 58% |
| Habkern | 13 | $5,382 | $344.74 | 50% |
| Interlaken | 288 | $4,987 | $310.52 | 56% |
| Zermatt | 734 | $4,604 | $463.00 | 46% |
| Oberhofen am Thunersee | 24 | $4,572 | $265.94 | 55% |
| Sigriswil | 99 | $4,371 | $271.90 | 58% |