La Mulatière Airbnb Market Analysis 2025: Short Term Rental Data & Vacation Rental Statistics in Auvergne-Rhône-Alpes, France
Is Airbnb profitable in La Mulatière in 2025? Explore comprehensive Airbnb analytics for La Mulatière, Auvergne-Rhône-Alpes, France to uncover income potential. This 2025 STR market report for La Mulatière, based on AirROI data from April 2024 to March 2025, reveals key trends in the niche market of 53 active listings.
Whether you're considering an Airbnb investment in La Mulatière, optimizing your existing vacation rental, or exploring rental arbitrage opportunities, understanding the La Mulatière Airbnb data is crucial. Leveraging the low regulation environment is key to maximizing your short term rental income potential. Let's dive into the specifics.
Key La Mulatière Airbnb Performance Metrics Overview
Monthly Airbnb Revenue Variations & Income Potential in La Mulatière (2025)
Understanding the monthly revenue variations for Airbnb listings in La Mulatière is key to maximizing your short term rental income potential. Seasonality significantly impacts earnings. Our analysis, based on data from the past 12 months, shows that the peak revenue month for STRs in La Mulatière is typically May, while December often presents the lowest earnings, highlighting opportunities for strategic pricing adjustments during shoulder and low seasons. Explore the typical Airbnb income in La Mulatière across different performance tiers:
- Best-in-class properties (Top 10%) achieve $3,161+ monthly, often utilizing dynamic pricing and superior guest experiences.
- Strong performing properties (Top 25%) earn $2,062 or more, indicating effective management and desirable locations/amenities.
- Typical properties (Median) generate around $1,379 per month, representing the average market performance.
- Entry-level properties (Bottom 25%) see earnings around $861, often with potential for optimization.
Average Monthly Airbnb Earnings Trend in La Mulatière
La Mulatière Airbnb Occupancy Rate Trends (2025)
Maximize your bookings by understanding the La Mulatière STR occupancy trends. Seasonal demand shifts significantly influence how often properties are booked. Typically, Octobersees the highest demand (peak season occupancy), while March experiences the lowest (low season). Effective strategies, like adjusting minimum stays or offering promotions, can boost occupancy during slower periods. Here's how different property tiers perform in La Mulatière:
- Best-in-class properties (Top 10%) achieve 86%+ occupancy, indicating high desirability and potentially optimized availability.
- Strong performing properties (Top 25%) maintain 70% or higher occupancy, suggesting good market fit and guest satisfaction.
- Typical properties (Median) have an occupancy rate around 47%.
- Entry-level properties (Bottom 25%) average 28% occupancy, potentially facing higher vacancy.
Average Monthly Occupancy Rate Trend in La Mulatière
Average Daily Rate (ADR) Airbnb Trends in La Mulatière (2025)
Effective short term rental pricing strategy in La Mulatière involves understanding monthly ADR fluctuations. The Average Daily Rate (ADR) for Airbnb in La Mulatière typically peaks in July and dips lowest during March. Leveraging Airbnb dynamic pricing tools or strategies based on this seasonality can significantly boost revenue. Here's a look at the typical nightly rates achieved:
- Best-in-class properties (Top 10%) command rates of $250+ per night, often due to premium features or locations.
- Strong performing properties (Top 25%) achieve nightly rates of $120 or more.
- Typical properties (Median) charge around $79 per night.
- Entry-level properties (Bottom 25%) earn around $56 per night.
Average Daily Rate (ADR) Trend by Month in La Mulatière
Get Live La Mulatière Market Intelligence 👇

Explore Real-time Analytics
Airbnb Seasonality Analysis & Trends in La Mulatière (2025)
Peak Season (May, June, April)
- Revenue averages $2,348 per month
- Occupancy rates average 47.3%
- Daily rates average $130
Shoulder Season
- Revenue averages $1,772 per month
- Occupancy maintains around 51.7%
- Daily rates hold near $125
Low Season (March, November, December)
- Revenue drops to average $1,518 per month
- Occupancy decreases to average 48.3%
- Daily rates adjust to average $115
Seasonality Insights for La Mulatière
- The Airbnb seasonality in La Mulatière shows moderate seasonality with distinct peak and low periods. While the sections above show seasonal averages, it's also insightful to look at the extremes:
- During the high season, the absolute peak month showcases La Mulatière's highest earning potential, with monthly revenues capable of climbing to $2,520, occupancy reaching a high of 60.2%, and ADRs peaking at $136.
- Conversely, the slowest single month of the year, typically falling within the low season, marks the market's lowest point. In this month, revenue might dip to $1,500, occupancy could drop to 42.9%, and ADRs may adjust down to $107.
- Understanding both the seasonal averages and these monthly peaks and troughs in revenue, occupancy, and ADR is crucial for maximizing your Airbnb profit potential in La Mulatière.
Seasonal Strategies for Maximizing Profit
- Peak Season: Maximize revenue through premium pricing and potentially longer minimum stays. Ensure high availability.
- Low Season: Offer competitive pricing, special promotions (e.g., extended stay discounts), and flexible cancellation policies. Target off-season travelers like remote workers or budget-conscious guests.
- Shoulder Seasons: Implement dynamic pricing that balances peak and low rates. Target weekend travelers or specific events. Offer slightly more flexible terms than peak season.
- Regularly analyze your own performance against these La Mulatière seasonality benchmarks and adjust your pricing and availability strategy accordingly.
Best Areas for Airbnb Investment in La Mulatière (2025)
Exploring the top neighborhoods for short-term rentals in La Mulatière? This section highlights key areas, outlining why they are attractive for hosts and guests, along with notable local attractions. Consider these locations based on your target guest profile and investment strategy.
| Neighborhood / Area | Why Host Here? (Target Guests & Appeal) | Key Attractions & Landmarks |
|---|---|---|
| La Mulatière Centre | Convenient access to public transport and local shops, making it easy for guests to explore nearby attractions in Lyon. | Lyon Cathedral, Basilique Notre-Dame de Fourvière, Place Bellecour, Museum of Fine Arts, Parc de la Tête d'Or |
| Parc de la Tête d'Or | A beautiful large park located just a short distance away, perfect for nature lovers and families looking to enjoy outdoor activities. | Botanical Gardens, Zoo de la Tête d'Or, Lakes and picnic areas, Cycling paths, Playgrounds |
| Lyon Confluence | A trendy district known for modern architecture and vibrant culture, attracting visitors interested in contemporary experiences and design. | Confluence Museum, Shopping Centres, Restaurants along the riverside, Lyon's waterfront, Art galleries |
| Vieux Lyon | One of the oldest districts of Lyon, featuring Renaissance architecture and narrow cobblestone streets, ideal for tourists exploring history and culture. | Saint-Jean Cathedral, traboules (hidden passageways), Musee Gadagne, Restaurants serving local cuisine, Place du Gouvernement |
| Les Terreaux | Central area known for its lively square and cultural institutions, appealing to both tourists and locals with its vibrant atmosphere. | Palais des Beaux-Arts, Place des Terreaux, The Lyon Opera House, Local bars and cafes, Art installations |
| Vaise | A residential area that offers a mix of local charm and proximity to the historic center, appealing to guests looking for a quiet stay. | Local markets, Parks and green spaces, Restaurants, The Saône river, Historic architecture |
| La Croix-Rousse | Famous bohemian neighborhood known for its artistic vibes and silk industry history, attracting creatives and alternative tourists. | Croix-Rousse Market, Mur des Canuts, Theater and cultural venues, Artisan shops, Streets with street art |
| Saint-Just | A peaceful residential area with stunning views of Lyon, perfect for guests wanting to enjoy a quieter experience with easy access to main attractions. | Basilique Notre-Dame de Fourvière, Panoramic views of Lyon, Historical sites, Cafes and bistros, Local parks |
Understanding Airbnb License Requirements & STR Laws in La Mulatière (2025)
While La Mulatière, Auvergne-Rhône-Alpes, France currently shows low STR regulations, specific Airbnb license requirements might still exist or change. Always verify the latest short term rental regulations and Airbnb license requirements directly with local government authorities for La Mulatière to ensure full compliance before hosting.
(Source: AirROI data, 2025, based on 2% licensed listings)
Top Performing Airbnb Properties in La Mulatière (2025)
Benchmark your potential! Explore examples of top-performing Airbnb properties in La Mulatièrebased on Trailing Twelve Month (TTM) revenue. Analyze their characteristics, revenue, occupancy rate, and ADR to understand what drives success in this market.
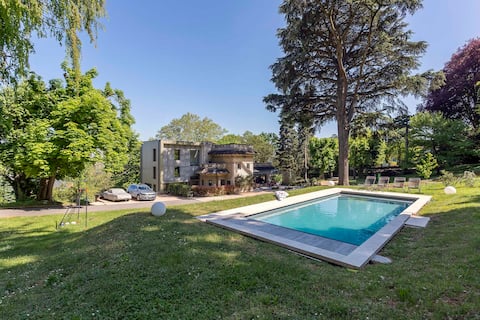
Family home with park+roof top, 5 min from Lyon
Entire Place • 5 bedrooms

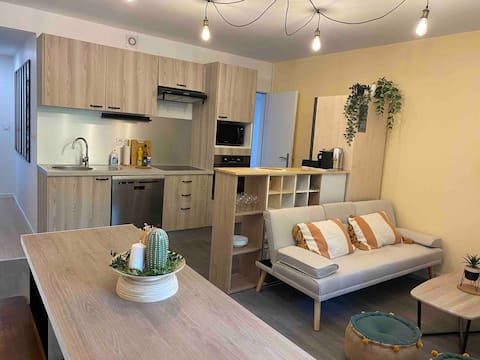
*Maison Lyon Confluence* in pretty condominium
Entire Place • 4 bedrooms
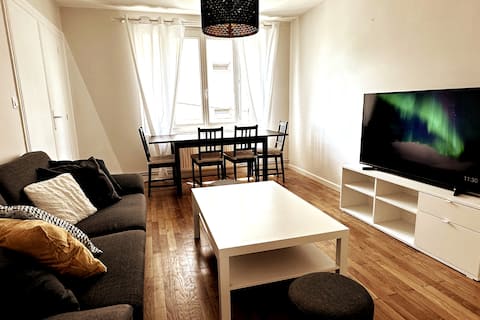
Sleep In La Mulatière
Entire Place • 4 bedrooms

Quiet houseboat in Lyon on the Saône
Entire Place • 3 bedrooms
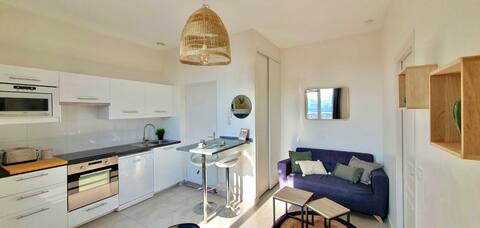
6 seater, 3 bedroom apartment
Entire Place • 3 bedrooms
Le Gone 50 meters metro 4 pers Oullins Confluence
Entire Place • 1 bedroom
Note: Performance varies based on location, size, amenities, seasonality, and management quality. Data reflects the past 12 months.
Top Performing Airbnb Hosts in La Mulatière (2025)
Learn from the best! This table showcases top-performing Airbnb hosts in La Mulatière based on the number of properties managed and estimated total revenue over the past year. Analyze their scale and performance metrics.
| Host Name | Properties | Grossing Revenue | Stay Reviews | Avg Rating |
|---|---|---|---|---|
| Catherine | 1 | $130,366 | 6 | 5.00/5.0 |
| Maison Confluence | 1 | $55,635 | 88 | 4.92/5.0 |
| Jerome | 1 | $54,838 | 68 | 4.84/5.0 |
| Florence | 2 | $48,640 | 337 | 4.91/5.0 |
| Jeremy | 2 | $46,677 | 109 | 4.73/5.0 |
| Jb | 3 | $34,166 | 89 | 4.74/5.0 |
| Florence | 2 | $27,777 | 24 | 4.72/5.0 |
| Xavier Et Stéphanie | 1 | $24,606 | 20 | 4.80/5.0 |
| Marlene | 1 | $23,922 | 260 | 4.86/5.0 |
| Adrien | 1 | $23,683 | 67 | 4.91/5.0 |
Analyzing the strategies of top hosts, such as their property selection, pricing, and guest communication, can offer valuable lessons for optimizing your own Airbnb operations in La Mulatière.
Dive Deeper: Advanced La Mulatière STR Market Data (2025)
Ready to unlock more insights? AirROI provides access to advanced metrics and comprehensive Airbnb data for La Mulatière. Explore detailed analytics beyond this report to refine your investment strategy, optimize pricing, and maximize your vacation rental profits.
Explore Advanced MetricsLa Mulatière Short-Term Rental Market Composition (2025): Property & Room Types
Room Type Distribution
Property Type Distribution
Market Composition Insights for La Mulatière
- The La Mulatière Airbnb market composition is heavily skewed towards Entire Home/Apt listings, which make up 79.2% of the 53 active rentals. This indicates strong guest preference for privacy and space.
- Looking at the property type distribution in La Mulatière, Apartment/Condo properties are the most common (69.8%), reflecting the local real estate landscape.
- Houses represent a significant 20.8% portion, catering likely to families or larger groups.
- Smaller segments like others, hotel/boutique (combined 3.8%) offer potential for unique stay experiences.
La Mulatière Airbnb Room Capacity Analysis (2025): Bedroom Distribution
Distribution of Listings by Number of Bedrooms
Room Capacity Insights for La Mulatière
- The dominant room capacity in La Mulatière is 1 bedroom listings, making up 43.4% of the market. This suggests a strong demand for properties suitable for couples or solo travelers.
- Together, 1 bedroom and 2 bedrooms properties represent 52.8% of the active Airbnb listings in La Mulatière, indicating a high concentration in these sizes.
La Mulatière Vacation Rental Guest Capacity Trends (2025)
Distribution of Listings by Guest Capacity
Guest Capacity Insights for La Mulatière
- The most common guest capacity trend in La Mulatière vacation rentals is listings accommodating 2 guests (26.4%). This suggests the primary traveler segment is likely couples or solo travelers.
- Properties designed for 2 guests and 4 guests dominate the La Mulatière STR market, accounting for 45.3% of listings.
- 18.8% of properties accommodate 6+ guests, serving the market segment for larger families or group travel in La Mulatière.
- On average, properties in La Mulatière are equipped to host 3.0 guests.
La Mulatière Airbnb Booking Patterns (2025): Available vs. Booked Days
Available Days Distribution
Booked Days Distribution
Booking Pattern Insights for La Mulatière
- The most common availability pattern in La Mulatière falls within the 181-270 days range, representing 35.8% of listings. This suggests many properties have significant open periods on their calendars.
- Approximately 60.3% of listings show high availability (181+ days open annually), indicating potential for increased bookings or specific owner usage patterns.
- For booked days, the 91-180 days range is most frequent in La Mulatière (35.8%), reflecting common guest stay durations or potential owner blocking patterns.
- A notable 41.5% of properties secure long booking periods (181+ days booked per year), highlighting successful long-term rental strategies or significant owner usage.
La Mulatière Airbnb Minimum Stay Requirements Analysis
Distribution of Listings by Minimum Night Requirement
1 Night
13 listings
25.5% of total
2 Nights
21 listings
41.2% of total
3 Nights
3 listings
5.9% of total
4-6 Nights
4 listings
7.8% of total
7-29 Nights
2 listings
3.9% of total
30+ Nights
8 listings
15.7% of total
Key Insights
- The most prevalent minimum stay requirement in La Mulatière is 2 Nights, adopted by 41.2% of listings. This highlights the market's preference for shorter, flexible bookings.
- A strong majority (66.7%) of the La Mulatière Airbnb data shows acceptance of very short stays (1-2 nights), indicating a dynamic, high-turnover market.
- A significant segment (15.7%) caters to monthly stays (30+ nights) in La Mulatière, pointing to opportunities in the extended-stay market.
Recommendations
- Align with the market by considering a 2 Nights minimum stay, as 41.2% of La Mulatière hosts use this setting.
- If feasible, allowing 1-night stays, especially midweek or during low season, could capture last-minute bookings, as only 25.5% currently do.
- Explore offering discounts for stays of 30+ nights to attract the 15.7% of the market seeking extended stays.
- Adjust minimum nights based on seasonality – potentially shorter during low season and longer during peak demand periods in La Mulatière.
La Mulatière Airbnb Cancellation Policy Trends Analysis (2025)
Flexible
12 listings
24% of total
Moderate
17 listings
34% of total
Firm
9 listings
18% of total
Strict
12 listings
24% of total
Cancellation Policy Insights for La Mulatière
- The prevailing Airbnb cancellation policy trend in La Mulatière is Moderate, used by 34% of listings.
- There's a relatively balanced mix between guest-friendly (58.0%) and stricter (42.0%) policies, offering choices for different guest needs.
Recommendations for Hosts
- Consider adopting a Moderate policy to align with the 34% market standard in La Mulatière.
- Regularly review your cancellation policy against competitors and market demand shifts in La Mulatière.
La Mulatière STR Booking Lead Time Analysis (2025)
Average Booking Lead Time by Month
Booking Lead Time Insights for La Mulatière
- The overall average booking lead time for vacation rentals in La Mulatière is 40 days.
- Guests book furthest in advance for stays during June (average 61 days), likely coinciding with peak travel demand or local events.
- The shortest booking windows occur for stays in January (average 35 days), indicating more last-minute travel plans during this time.
- Seasonally, Summer (51 days avg.) sees the longest lead times, while Winter (38 days avg.) has the shortest, reflecting typical travel planning cycles.
Recommendations for Hosts
- Use the overall average lead time (40 days) as a baseline for your pricing and availability strategy in La Mulatière.
- For June stays, consider implementing length-of-stay discounts or slightly higher rates for bookings made less than 61 days out to capitalize on advance planning.
- Target marketing efforts for the Summer season well in advance (at least 51 days) to capture early planners.
- Monitor your own booking lead times against these La Mulatière averages to identify opportunities for dynamic pricing adjustments.
Popular & Essential Airbnb Amenities in La Mulatière (2025)
Amenity Prevalence
Amenity Insights for La Mulatière
- Essential amenities in La Mulatière that guests expect include: Heating. Lacking these (this) could significantly impact bookings.
- Popular amenities like Hot water, Kitchen, Wifi are common but not universal. Offering these can provide a competitive edge.
- Warning: Wifi is not universally provided but is considered essential globally. Ensure reliable Wifi is offered.
Recommendations for Hosts
- Ensure your listing includes all essential amenities for La Mulatière: Heating.
- Prioritize adding missing essentials: Heating.
- Consider adding popular differentiators like Hot water or Kitchen to increase appeal.
- Highlight unique or less common amenities you offer (e.g., hot tub, dedicated workspace, EV charger) in your listing description and photos.
- Regularly check competitor amenities in La Mulatière to stay competitive.
La Mulatière Airbnb Guest Demographics & Profile Analysis (2025)
Guest Profile Summary for La Mulatière
- The typical guest profile for Airbnb in La Mulatière consists of primarily domestic travelers (71%), often arriving from nearby Paris, typically belonging to the Post-2000s (Gen Z/Alpha) group (50%), primarily speaking English or French.
- Domestic travelers account for 70.8% of guests.
- Key international markets include France (70.8%) and Germany (5.8%).
- Top languages spoken are English (36%) followed by French (34.9%).
- A significant demographic segment is the Post-2000s (Gen Z/Alpha) group, representing 50% of guests.
Recommendations for Hosts
- Target domestic marketing efforts towards travelers from Paris and Lyon.
- Tailor amenities and listing descriptions to appeal to the dominant Post-2000s (Gen Z/Alpha) demographic (e.g., highlight fast WiFi, smart home features, local guides).
- Highlight unique local experiences or amenities relevant to the primary guest profile.
- Consider seasonal promotions aligned with peak travel times for key origin markets.
Nearby Short-Term Rental Market Comparison
How does the La Mulatière Airbnb market stack up against its neighbors? Compare key performance metrics like average monthly revenue, ADR, and occupancy rates in surrounding areas to understand the broader regional STR landscape.
| Market | Active Properties | Monthly Revenue | Daily Rate | Avg. Occupancy |
|---|---|---|---|---|
| Épinac | 14 | $5,147 | $333.01 | 37% |
| Divajeu | 19 | $3,941 | $410.65 | 42% |
| Saint-Germain-au-Mont-d'Or | 10 | $3,928 | $316.02 | 40% |
| Puligny-Montrachet | 11 | $3,908 | $398.00 | 44% |
| Dommartin | 11 | $3,905 | $327.00 | 36% |
| Juliénas | 11 | $3,378 | $292.32 | 46% |
| Courzieu | 11 | $3,267 | $287.83 | 52% |
| Vanosc | 13 | $3,072 | $224.52 | 44% |
| Chantepérier | 20 | $3,057 | $281.60 | 37% |
| Bligny-lès-Beaune | 24 | $2,930 | $233.89 | 44% |