La Biolle Airbnb Market Analysis 2025: Short Term Rental Data & Vacation Rental Statistics in Auvergne-Rhône-Alpes, France
Is Airbnb profitable in La Biolle in 2025? Explore comprehensive Airbnb analytics for La Biolle, Auvergne-Rhône-Alpes, France to uncover income potential. This 2025 STR market report for La Biolle, based on AirROI data from April 2024 to March 2025, reveals key trends in the niche market of 17 active listings.
Whether you're considering an Airbnb investment in La Biolle, optimizing your existing vacation rental, or exploring rental arbitrage opportunities, understanding the La Biolle Airbnb data is crucial. Understanding the local regulations is key to maximizing your short term rental income potential. Let's dive into the specifics.
Key La Biolle Airbnb Performance Metrics Overview
Monthly Airbnb Revenue Variations & Income Potential in La Biolle (2025)
Understanding the monthly revenue variations for Airbnb listings in La Biolle is key to maximizing your short term rental income potential. Seasonality significantly impacts earnings. Our analysis, based on data from the past 12 months, shows that the peak revenue month for STRs in La Biolle is typically August, while November often presents the lowest earnings, highlighting opportunities for strategic pricing adjustments during shoulder and low seasons. Explore the typical Airbnb income in La Biolle across different performance tiers:
- Best-in-class properties (Top 10%) achieve $5,376+ monthly, often utilizing dynamic pricing and superior guest experiences.
- Strong performing properties (Top 25%) earn $2,808 or more, indicating effective management and desirable locations/amenities.
- Typical properties (Median) generate around $1,393 per month, representing the average market performance.
- Entry-level properties (Bottom 25%) see earnings around $720, often with potential for optimization.
Average Monthly Airbnb Earnings Trend in La Biolle
La Biolle Airbnb Occupancy Rate Trends (2025)
Maximize your bookings by understanding the La Biolle STR occupancy trends. Seasonal demand shifts significantly influence how often properties are booked. Typically, Augustsees the highest demand (peak season occupancy), while November experiences the lowest (low season). Effective strategies, like adjusting minimum stays or offering promotions, can boost occupancy during slower periods. Here's how different property tiers perform in La Biolle:
- Best-in-class properties (Top 10%) achieve 88%+ occupancy, indicating high desirability and potentially optimized availability.
- Strong performing properties (Top 25%) maintain 69% or higher occupancy, suggesting good market fit and guest satisfaction.
- Typical properties (Median) have an occupancy rate around 52%.
- Entry-level properties (Bottom 25%) average 28% occupancy, potentially facing higher vacancy.
Average Monthly Occupancy Rate Trend in La Biolle
Average Daily Rate (ADR) Airbnb Trends in La Biolle (2025)
Effective short term rental pricing strategy in La Biolle involves understanding monthly ADR fluctuations. The Average Daily Rate (ADR) for Airbnb in La Biolle typically peaks in December and dips lowest during September. Leveraging Airbnb dynamic pricing tools or strategies based on this seasonality can significantly boost revenue. Here's a look at the typical nightly rates achieved:
- Best-in-class properties (Top 10%) command rates of $364+ per night, often due to premium features or locations.
- Strong performing properties (Top 25%) achieve nightly rates of $171 or more.
- Typical properties (Median) charge around $66 per night.
- Entry-level properties (Bottom 25%) earn around $51 per night.
Average Daily Rate (ADR) Trend by Month in La Biolle
Get Live La Biolle Market Intelligence 👇
Explore Real-time Analytics
Airbnb Seasonality Analysis & Trends in La Biolle (2025)
Peak Season (August, July, February)
- Revenue averages $3,089 per month
- Occupancy rates average 65.2%
- Daily rates average $131
Shoulder Season
- Revenue averages $2,012 per month
- Occupancy maintains around 45.1%
- Daily rates hold near $133
Low Season (April, October, November)
- Revenue drops to average $1,599 per month
- Occupancy decreases to average 48.7%
- Daily rates adjust to average $120
Seasonality Insights for La Biolle
- The Airbnb seasonality in La Biolle shows highly seasonal trends requiring careful strategy. While the sections above show seasonal averages, it's also insightful to look at the extremes:
- During the high season, the absolute peak month showcases La Biolle's highest earning potential, with monthly revenues capable of climbing to $3,561, occupancy reaching a high of 76.7%, and ADRs peaking at $148.
- Conversely, the slowest single month of the year, typically falling within the low season, marks the market's lowest point. In this month, revenue might dip to $1,287, occupancy could drop to 39.0%, and ADRs may adjust down to $118.
- Understanding both the seasonal averages and these monthly peaks and troughs in revenue, occupancy, and ADR is crucial for maximizing your Airbnb profit potential in La Biolle.
Seasonal Strategies for Maximizing Profit
- Peak Season: Maximize revenue through premium pricing and potentially longer minimum stays. Ensure high availability.
- Low Season: Offer competitive pricing, special promotions (e.g., extended stay discounts), and flexible cancellation policies. Target off-season travelers like remote workers or budget-conscious guests.
- Shoulder Seasons: Implement dynamic pricing that balances peak and low rates. Target weekend travelers or specific events. Offer slightly more flexible terms than peak season.
- Regularly analyze your own performance against these La Biolle seasonality benchmarks and adjust your pricing and availability strategy accordingly.
Best Areas for Airbnb Investment in La Biolle (2025)
Exploring the top neighborhoods for short-term rentals in La Biolle? This section highlights key areas, outlining why they are attractive for hosts and guests, along with notable local attractions. Consider these locations based on your target guest profile and investment strategy.
| Neighborhood / Area | Why Host Here? (Target Guests & Appeal) | Key Attractions & Landmarks |
|---|---|---|
| La Biolle Center | Quaint village center with charming streets and local eateries. Ideal for travelers looking for a peaceful abode close to the beauty of the surrounding countryside. | Local cafés, Nearby hiking trails, Markets, Lake Bourget, Cycle routes |
| Mont Revard | Stunning mountain area with panoramic views and outdoor activities. Perfect for nature lovers and those seeking adventure sports. | Hiking trails, Skiing in winter, Viewpoints, Mountain biking, Nature reserves |
| Aiguebelette Lake | Beautiful lake known for its clear waters and recreational activities. Attracts families and water sports enthusiasts. | Swimming, Boating, Picnic areas, Cycling paths, Scenic walks |
| Chambery | Historic city with rich culture and architecture, offering a lively atmosphere and many amenities. Great for guests wanting a city vibe with access to nature. | Château de Chambéry, Old Town, Local markets, Museums, Parks |
| Les Bauges Regional Natural Park | A natural park offering breathtaking landscapes and biodiversity, great for travelers looking for outdoor experiences. | Wild hikes, Biodiversity, Unique flora and fauna, Transhumance culture, Scenic vistas |
| Albertville | Famous for the 1992 Winter Olympics and a hub for sports tourism. Attracts adventure seekers year-round. | Olympic Museum, Winter sports facilities, Local festivals, Shopping, Cultural heritage sites |
| Saint-Offenge-Dessous | Peaceful rural area, offering a quiet escape and proximity to nature. Perfect for guests looking for tranquility and rural charm. | Scenic farms, Rural landscapes, Tranquil hiking spots, Local wineries, Artisan produce |
| Forges de la Massif du Parmelan | An area known for its historical significance and natural beauty, appealing to history buffs and nature lovers alike. | Historical forges, Nature trails, Dramatic cliffs, Cultural heritage, Photography spots |
Understanding Airbnb License Requirements & STR Laws in La Biolle (2025)
With 12% of listings showing registration in 2025, understanding potential Airbnb license requirements is crucial in La Biolle. Always verify the latest short term rental regulations and Airbnb license requirements directly with local government authorities for La Biolle to ensure full compliance before hosting.
(Source: AirROI data, 2025, based on 12% licensed listings)
Top Performing Airbnb Properties in La Biolle (2025)
Benchmark your potential! Explore examples of top-performing Airbnb properties in La Biollebased on Trailing Twelve Month (TTM) revenue. Analyze their characteristics, revenue, occupancy rate, and ADR to understand what drives success in this market.
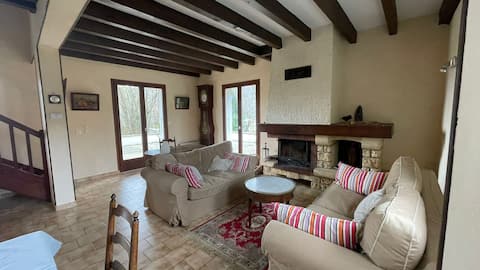
Family House - Bauges view
Entire Place • 6 bedrooms
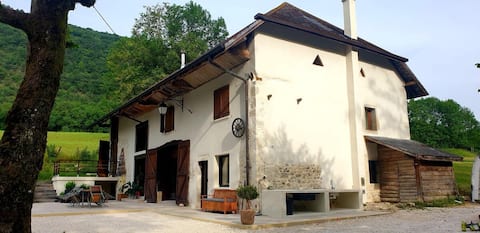
Country home 10 min from Aix
Entire Place • 5 bedrooms
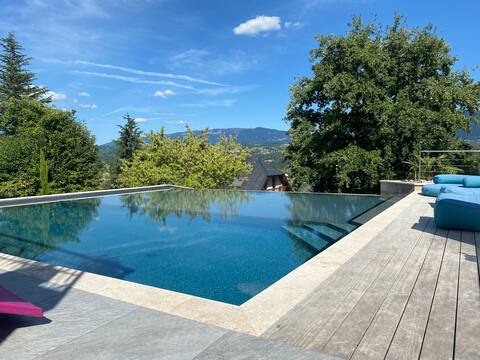
STUNNING VILLA ON THE HEIGHTS
Entire Place • 4 bedrooms
Lovely Villa with Pool
Entire Place • 3 bedrooms
At the hidden cabin, between lakes and mountains,
Entire Place • 2 bedrooms
🍀La Montagnette🍀 T4 with terrace + free parking
Entire Place • 3 bedrooms
Note: Performance varies based on location, size, amenities, seasonality, and management quality. Data reflects the past 12 months.
Top Performing Airbnb Hosts in La Biolle (2025)
Learn from the best! This table showcases top-performing Airbnb hosts in La Biolle based on the number of properties managed and estimated total revenue over the past year. Analyze their scale and performance metrics.
| Host Name | Properties | Grossing Revenue | Stay Reviews | Avg Rating |
|---|---|---|---|---|
| Florence | 1 | $71,773 | 27 | 4.96/5.0 |
| Aydugan | 1 | $51,824 | 34 | 5.00/5.0 |
| Thomas | 1 | $34,810 | 4 | 4.75/5.0 |
| Florian | 1 | $33,241 | 27 | 4.93/5.0 |
| Saïda Et Raphaël | 1 | $26,135 | 71 | 4.96/5.0 |
| Jade | 1 | $18,106 | 58 | 4.71/5.0 |
| Emilie | 1 | $17,774 | 105 | 4.90/5.0 |
| Audrey Et Vincent | 1 | $16,827 | 100 | 4.86/5.0 |
| Valerie | 1 | $12,913 | 54 | 4.59/5.0 |
| Isabelle | 1 | $9,011 | 10 | 4.90/5.0 |
Analyzing the strategies of top hosts, such as their property selection, pricing, and guest communication, can offer valuable lessons for optimizing your own Airbnb operations in La Biolle.
Dive Deeper: Advanced La Biolle STR Market Data (2025)
Ready to unlock more insights? AirROI provides access to advanced metrics and comprehensive Airbnb data for La Biolle. Explore detailed analytics beyond this report to refine your investment strategy, optimize pricing, and maximize your vacation rental profits.
Explore Advanced MetricsLa Biolle Short-Term Rental Market Composition (2025): Property & Room Types
Room Type Distribution
Property Type Distribution
Market Composition Insights for La Biolle
- The La Biolle Airbnb market composition is heavily skewed towards Entire Home/Apt listings, which make up 76.5% of the 17 active rentals. This indicates strong guest preference for privacy and space.
- Looking at the property type distribution in La Biolle, House properties are the most common (70.6%), reflecting the local real estate landscape.
- Houses represent a significant 70.6% portion, catering likely to families or larger groups.
- The presence of 5.9% Hotel/Boutique listings indicates integration with traditional hospitality.
La Biolle Airbnb Room Capacity Analysis (2025): Bedroom Distribution
Distribution of Listings by Number of Bedrooms
Room Capacity Insights for La Biolle
- The dominant room capacity in La Biolle is 1 bedroom listings, making up 23.5% of the market. This suggests a strong demand for properties suitable for couples or solo travelers.
- Together, 1 bedroom and 3 bedrooms properties represent 41.1% of the active Airbnb listings in La Biolle, indicating a high concentration in these sizes.
- A significant 35.3% of listings offer 3+ bedrooms, catering to larger groups and families seeking more space in La Biolle.
La Biolle Vacation Rental Guest Capacity Trends (2025)
Distribution of Listings by Guest Capacity
Guest Capacity Insights for La Biolle
- The most common guest capacity trend in La Biolle vacation rentals is listings accommodating 4 guests (23.5%). This suggests the primary traveler segment is likely small families or groups.
- Properties designed for 4 guests and 8+ guests dominate the La Biolle STR market, accounting for 41.1% of listings.
- 41.1% of properties accommodate 6+ guests, serving the market segment for larger families or group travel in La Biolle.
- On average, properties in La Biolle are equipped to host 4.3 guests.
La Biolle Airbnb Booking Patterns (2025): Available vs. Booked Days
Available Days Distribution
Booked Days Distribution
Booking Pattern Insights for La Biolle
- The most common availability pattern in La Biolle falls within the 271-366 days range, representing 35.3% of listings. This suggests many properties have significant open periods on their calendars.
- Approximately 58.8% of listings show high availability (181+ days open annually), indicating potential for increased bookings or specific owner usage patterns.
- For booked days, the 91-180 days range is most frequent in La Biolle (23.5%), reflecting common guest stay durations or potential owner blocking patterns.
- A notable 41.1% of properties secure long booking periods (181+ days booked per year), highlighting successful long-term rental strategies or significant owner usage.
La Biolle Airbnb Minimum Stay Requirements Analysis
Distribution of Listings by Minimum Night Requirement
2 Nights
8 listings
50% of total
3 Nights
4 listings
25% of total
4-6 Nights
1 listings
6.3% of total
7-29 Nights
1 listings
6.3% of total
30+ Nights
2 listings
12.5% of total
Key Insights
- The most prevalent minimum stay requirement in La Biolle is 2 Nights, adopted by 50% of listings. This highlights the market's preference for shorter, flexible bookings.
- A significant segment (12.5%) caters to monthly stays (30+ nights) in La Biolle, pointing to opportunities in the extended-stay market.
Recommendations
- Align with the market by considering a 2 Nights minimum stay, as 50% of La Biolle hosts use this setting.
- A 2-night minimum appears standard (50%). Consider this for weekends or peak periods.
- Explore offering discounts for stays of 30+ nights to attract the 12.5% of the market seeking extended stays.
- Adjust minimum nights based on seasonality – potentially shorter during low season and longer during peak demand periods in La Biolle.
La Biolle Airbnb Cancellation Policy Trends Analysis (2025)
Flexible
5 listings
29.4% of total
Moderate
7 listings
41.2% of total
Firm
3 listings
17.6% of total
Strict
2 listings
11.8% of total
Cancellation Policy Insights for La Biolle
- The prevailing Airbnb cancellation policy trend in La Biolle is Moderate, used by 41.2% of listings.
- The market strongly favors guest-friendly terms, with 70.6% of listings offering Flexible or Moderate policies. This suggests guests in La Biolle may expect booking flexibility.
Recommendations for Hosts
- Consider adopting a Moderate policy to align with the 41.2% market standard in La Biolle.
- Using a Strict policy might deter some guests, as only 11.8% of listings use it. Evaluate if potential revenue protection outweighs possible lower booking rates.
- Regularly review your cancellation policy against competitors and market demand shifts in La Biolle.
La Biolle STR Booking Lead Time Analysis (2025)
Average Booking Lead Time by Month
Booking Lead Time Insights for La Biolle
- The overall average booking lead time for vacation rentals in La Biolle is 53 days.
- Guests book furthest in advance for stays during July (average 134 days), likely coinciding with peak travel demand or local events.
- The shortest booking windows occur for stays in January (average 15 days), indicating more last-minute travel plans during this time.
- Seasonally, Summer (99 days avg.) sees the longest lead times, while Winter (28 days avg.) has the shortest, reflecting typical travel planning cycles.
Recommendations for Hosts
- Use the overall average lead time (53 days) as a baseline for your pricing and availability strategy in La Biolle.
- For July stays, consider implementing length-of-stay discounts or slightly higher rates for bookings made less than 134 days out to capitalize on advance planning.
- Target marketing efforts for the Summer season well in advance (at least 99 days) to capture early planners.
- Monitor your own booking lead times against these La Biolle averages to identify opportunities for dynamic pricing adjustments.
Popular & Essential Airbnb Amenities in La Biolle (2025)
Amenity Prevalence
Amenity Insights for La Biolle
- Popular amenities like Free parking on premises, Heating, Smoke alarm are common but not universal. Offering these can provide a competitive edge.
- Warning: Wifi is not universally provided but is considered essential globally. Ensure reliable Wifi is offered.
Recommendations for Hosts
- Consider adding popular differentiators like Free parking on premises or Heating to increase appeal.
- Highlight unique or less common amenities you offer (e.g., hot tub, dedicated workspace, EV charger) in your listing description and photos.
- Regularly check competitor amenities in La Biolle to stay competitive.
La Biolle Airbnb Guest Demographics & Profile Analysis (2025)
Guest Profile Summary for La Biolle
- The typical guest profile for Airbnb in La Biolle consists of primarily domestic travelers (87%), often arriving from nearby Lyon, typically belonging to the Post-2000s (Gen Z/Alpha) group (50%), primarily speaking French or English.
- Domestic travelers account for 87.2% of guests.
- Key international markets include France (87.2%) and Switzerland (4.1%).
- Top languages spoken are French (48.6%) followed by English (33.3%).
- A significant demographic segment is the Post-2000s (Gen Z/Alpha) group, representing 50% of guests.
Recommendations for Hosts
- Target domestic marketing efforts towards travelers from Lyon and Saint-Étienne.
- Tailor amenities and listing descriptions to appeal to the dominant Post-2000s (Gen Z/Alpha) demographic (e.g., highlight fast WiFi, smart home features, local guides).
- Highlight unique local experiences or amenities relevant to the primary guest profile.
- Consider seasonal promotions aligned with peak travel times for key origin markets.
Nearby Short-Term Rental Market Comparison
How does the La Biolle Airbnb market stack up against its neighbors? Compare key performance metrics like average monthly revenue, ADR, and occupancy rates in surrounding areas to understand the broader regional STR landscape.
| Market | Active Properties | Monthly Revenue | Daily Rate | Avg. Occupancy |
|---|---|---|---|---|
| La Rivière-Enverse | 17 | $5,972 | $624.02 | 41% |
| Les Clefs | 30 | $5,741 | $323.11 | 44% |
| Épinac | 14 | $5,147 | $333.01 | 37% |
| Manigod | 194 | $4,127 | $427.80 | 40% |
| Divajeu | 19 | $3,941 | $410.65 | 42% |
| Saint-Germain-au-Mont-d'Or | 10 | $3,928 | $316.02 | 40% |
| Puligny-Montrachet | 11 | $3,908 | $398.00 | 44% |
| Dommartin | 11 | $3,905 | $327.00 | 36% |
| Saint-Nicolas-la-Chapelle | 27 | $3,381 | $375.70 | 43% |
| Juliénas | 11 | $3,378 | $292.32 | 46% |