Collonges-sous-Salève Airbnb Market Analysis 2025: Short Term Rental Data & Vacation Rental Statistics in Auvergne-Rhône-Alpes, France
Is Airbnb profitable in Collonges-sous-Salève in 2025? Explore comprehensive Airbnb analytics for Collonges-sous-Salève, Auvergne-Rhône-Alpes, France to uncover income potential. This 2025 STR market report for Collonges-sous-Salève, based on AirROI data from April 2024 to March 2025, reveals key trends in the niche market of 30 active listings.
Whether you're considering an Airbnb investment in Collonges-sous-Salève, optimizing your existing vacation rental, or exploring rental arbitrage opportunities, understanding the Collonges-sous-Salève Airbnb data is crucial. Leveraging the low regulation environment is key to maximizing your short term rental income potential. Let's dive into the specifics.
Key Collonges-sous-Salève Airbnb Performance Metrics Overview
Monthly Airbnb Revenue Variations & Income Potential in Collonges-sous-Salève (2025)
Understanding the monthly revenue variations for Airbnb listings in Collonges-sous-Salève is key to maximizing your short term rental income potential. Seasonality significantly impacts earnings. Our analysis, based on data from the past 12 months, shows that the peak revenue month for STRs in Collonges-sous-Salève is typically August, while March often presents the lowest earnings, highlighting opportunities for strategic pricing adjustments during shoulder and low seasons. Explore the typical Airbnb income in Collonges-sous-Salève across different performance tiers:
- Best-in-class properties (Top 10%) achieve $3,736+ monthly, often utilizing dynamic pricing and superior guest experiences.
- Strong performing properties (Top 25%) earn $2,402 or more, indicating effective management and desirable locations/amenities.
- Typical properties (Median) generate around $1,630 per month, representing the average market performance.
- Entry-level properties (Bottom 25%) see earnings around $896, often with potential for optimization.
Average Monthly Airbnb Earnings Trend in Collonges-sous-Salève
Collonges-sous-Salève Airbnb Occupancy Rate Trends (2025)
Maximize your bookings by understanding the Collonges-sous-Salève STR occupancy trends. Seasonal demand shifts significantly influence how often properties are booked. Typically, Julysees the highest demand (peak season occupancy), while February experiences the lowest (low season). Effective strategies, like adjusting minimum stays or offering promotions, can boost occupancy during slower periods. Here's how different property tiers perform in Collonges-sous-Salève:
- Best-in-class properties (Top 10%) achieve 86%+ occupancy, indicating high desirability and potentially optimized availability.
- Strong performing properties (Top 25%) maintain 69% or higher occupancy, suggesting good market fit and guest satisfaction.
- Typical properties (Median) have an occupancy rate around 40%.
- Entry-level properties (Bottom 25%) average 18% occupancy, potentially facing higher vacancy.
Average Monthly Occupancy Rate Trend in Collonges-sous-Salève
Average Daily Rate (ADR) Airbnb Trends in Collonges-sous-Salève (2025)
Effective short term rental pricing strategy in Collonges-sous-Salève involves understanding monthly ADR fluctuations. The Average Daily Rate (ADR) for Airbnb in Collonges-sous-Salève typically peaks in November and dips lowest during March. Leveraging Airbnb dynamic pricing tools or strategies based on this seasonality can significantly boost revenue. Here's a look at the typical nightly rates achieved:
- Best-in-class properties (Top 10%) command rates of $263+ per night, often due to premium features or locations.
- Strong performing properties (Top 25%) achieve nightly rates of $143 or more.
- Typical properties (Median) charge around $86 per night.
- Entry-level properties (Bottom 25%) earn around $65 per night.
Average Daily Rate (ADR) Trend by Month in Collonges-sous-Salève
Get Live Collonges-sous-Salève Market Intelligence 👇

Explore Real-time Analytics
Airbnb Seasonality Analysis & Trends in Collonges-sous-Salève (2025)
Peak Season (August, July, April)
- Revenue averages $2,453 per month
- Occupancy rates average 53.7%
- Daily rates average $123
Shoulder Season
- Revenue averages $1,919 per month
- Occupancy maintains around 46.0%
- Daily rates hold near $125
Low Season (February, March, October)
- Revenue drops to average $1,175 per month
- Occupancy decreases to average 32.8%
- Daily rates adjust to average $121
Seasonality Insights for Collonges-sous-Salève
- The Airbnb seasonality in Collonges-sous-Salève shows highly seasonal trends requiring careful strategy. While the sections above show seasonal averages, it's also insightful to look at the extremes:
- During the high season, the absolute peak month showcases Collonges-sous-Salève's highest earning potential, with monthly revenues capable of climbing to $2,591, occupancy reaching a high of 56.5%, and ADRs peaking at $134.
- Conversely, the slowest single month of the year, typically falling within the low season, marks the market's lowest point. In this month, revenue might dip to $886, occupancy could drop to 27.3%, and ADRs may adjust down to $120.
- Understanding both the seasonal averages and these monthly peaks and troughs in revenue, occupancy, and ADR is crucial for maximizing your Airbnb profit potential in Collonges-sous-Salève.
Seasonal Strategies for Maximizing Profit
- Peak Season: Maximize revenue through premium pricing and potentially longer minimum stays. Ensure high availability.
- Low Season: Offer competitive pricing, special promotions (e.g., extended stay discounts), and flexible cancellation policies. Target off-season travelers like remote workers or budget-conscious guests.
- Shoulder Seasons: Implement dynamic pricing that balances peak and low rates. Target weekend travelers or specific events. Offer slightly more flexible terms than peak season.
- Regularly analyze your own performance against these Collonges-sous-Salève seasonality benchmarks and adjust your pricing and availability strategy accordingly.
Best Areas for Airbnb Investment in Collonges-sous-Salève (2025)
Exploring the top neighborhoods for short-term rentals in Collonges-sous-Salève? This section highlights key areas, outlining why they are attractive for hosts and guests, along with notable local attractions. Consider these locations based on your target guest profile and investment strategy.
| Neighborhood / Area | Why Host Here? (Target Guests & Appeal) | Key Attractions & Landmarks |
|---|---|---|
| Centre Ville | The heart of Collonges-sous-Salève with easy access to shops, restaurants, and local amenities. Ideal for travelers wanting to experience the local culture and lifestyle. | Église de Collonges-sous-Salève, local markets, La Bergère restaurant, Mont Salève hiking trails, shopping areas |
| Mont Salève | A scenic area known for its outdoor activities and breathtaking views. Attracts nature lovers and adventure tourists looking for hiking and paragliding opportunities. | Mont Salève cable car, Paragliding takeoff points, hiking trails, panoramic viewpoints, nature parks |
| Les Granges | A quiet residential neighborhood that offers a peaceful retreat while still being close to the amenities of the town. Great for families and long-term stays. | local parks, family-friendly playgrounds, calm surroundings, proximity to schools, community events |
| Échirolles | Located near the border of Collonges, this area is popular among business travelers and those visiting nearby industrial zones. Offers convenient accommodation options close to work. | business centers, local dining options, shopping complexes, easy access to public transport, proximity to major highways |
| La Frasse | A charming area that offers rustic accommodations and a taste of local life, attracting couples and those seeking a romantic getaway. | picturesque landscapes, local vineyards, charming bistros, walking trails, peaceful atmosphere |
| Near the Swiss border | Strategically located for international travelers, this area attracts guests looking to explore both France and Switzerland easily. Great for tourist influx. | proximity to Geneva, cross-border sightseeing, cultural exchange options, easy transport access, international dining options |
| Chedde | A peaceful rural area great for visitors seeking tranquility and nature, popular for families and tourists looking to unwind in the countryside. | nature walks, river access, local farms, community events, gorgeous views |
| Servette | An emerging area with modern developments and new attractions, appealing to younger travelers and those looking for modern amenities close to town. | trendy cafes, local shops, urban parks, modern apartments, vibrant atmosphere |
Understanding Airbnb License Requirements & STR Laws in Collonges-sous-Salève (2025)
While Collonges-sous-Salève, Auvergne-Rhône-Alpes, France currently shows low STR regulations, specific Airbnb license requirements might still exist or change. Always verify the latest short term rental regulations and Airbnb license requirements directly with local government authorities for Collonges-sous-Salève to ensure full compliance before hosting.
(Source: AirROI data, 2025, finding no licensed listings among those analyzed)
Top Performing Airbnb Properties in Collonges-sous-Salève (2025)
Benchmark your potential! Explore examples of top-performing Airbnb properties in Collonges-sous-Salèvebased on Trailing Twelve Month (TTM) revenue. Analyze their characteristics, revenue, occupancy rate, and ADR to understand what drives success in this market.
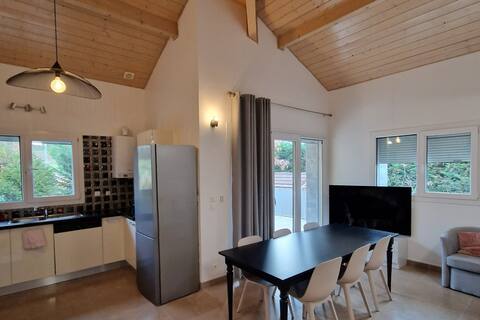
High Standing Duplex near Geneva
Entire Place • 3 bedrooms

House overlooking Geneva, lake view, 250 m2, 3 chs
Entire Place • 3 bedrooms

Beautiful 4bdr family house next to Swiss border
Entire Place • 4 bedrooms
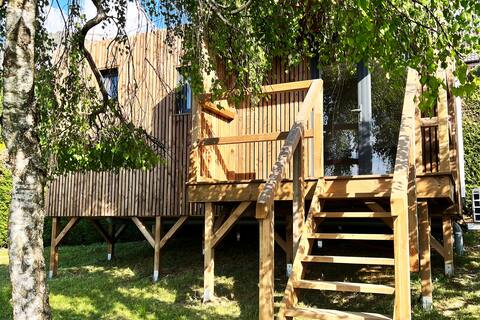
Cabane Jacoméli, Studio just above Geneva
Entire Place • 1 bedroom
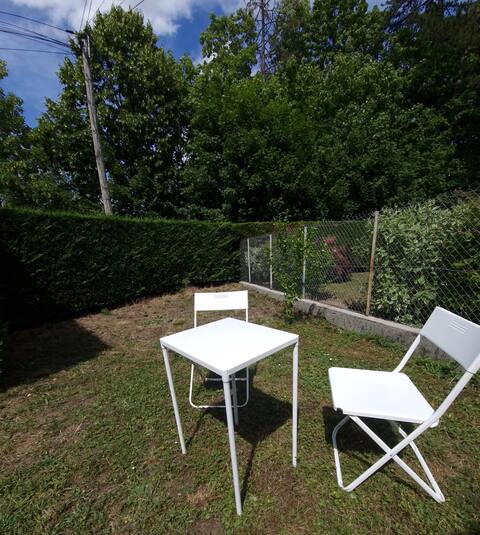
Apartment gates of Geneva. Energy, green household
Entire Place • 2 bedrooms
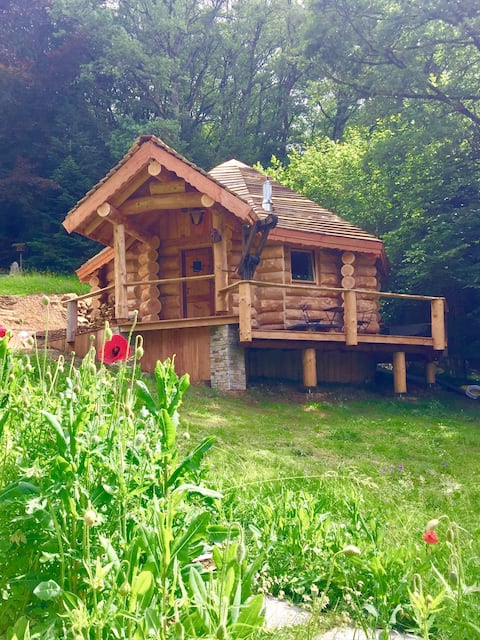
Finnish Kota Orjobet Cave
Entire Place • 1 bedroom
Note: Performance varies based on location, size, amenities, seasonality, and management quality. Data reflects the past 12 months.
Top Performing Airbnb Hosts in Collonges-sous-Salève (2025)
Learn from the best! This table showcases top-performing Airbnb hosts in Collonges-sous-Salève based on the number of properties managed and estimated total revenue over the past year. Analyze their scale and performance metrics.
| Host Name | Properties | Grossing Revenue | Stay Reviews | Avg Rating |
|---|---|---|---|---|
| Melissa | 2 | $68,785 | 42 | 4.83/5.0 |
| Patrick | 3 | $56,380 | 38 | 4.86/5.0 |
| Virginie | 1 | $47,345 | 41 | 4.98/5.0 |
| Filippo | 1 | $41,712 | 33 | 4.88/5.0 |
| Nicolas | 1 | $36,918 | 143 | 4.94/5.0 |
| Fabienne | 1 | $28,106 | 26 | 4.81/5.0 |
| Albert | 1 | $19,269 | 20 | 5.00/5.0 |
| Béatrice | 1 | $18,594 | 33 | 4.79/5.0 |
| Micheline | 1 | $16,846 | 60 | 5.00/5.0 |
| Vincent | 1 | $15,859 | 53 | 4.66/5.0 |
Analyzing the strategies of top hosts, such as their property selection, pricing, and guest communication, can offer valuable lessons for optimizing your own Airbnb operations in Collonges-sous-Salève.
Dive Deeper: Advanced Collonges-sous-Salève STR Market Data (2025)
Ready to unlock more insights? AirROI provides access to advanced metrics and comprehensive Airbnb data for Collonges-sous-Salève. Explore detailed analytics beyond this report to refine your investment strategy, optimize pricing, and maximize your vacation rental profits.
Explore Advanced MetricsCollonges-sous-Salève Short-Term Rental Market Composition (2025): Property & Room Types
Room Type Distribution
Property Type Distribution
Market Composition Insights for Collonges-sous-Salève
- The Collonges-sous-Salève Airbnb market composition is heavily skewed towards Entire Home/Apt listings, which make up 93.3% of the 30 active rentals. This indicates strong guest preference for privacy and space.
- Looking at the property type distribution in Collonges-sous-Salève, Apartment/Condo properties are the most common (66.7%), reflecting the local real estate landscape.
- Houses represent a significant 23.3% portion, catering likely to families or larger groups.
Collonges-sous-Salève Airbnb Room Capacity Analysis (2025): Bedroom Distribution
Distribution of Listings by Number of Bedrooms
Room Capacity Insights for Collonges-sous-Salève
- The dominant room capacity in Collonges-sous-Salève is 1 bedroom listings, making up 53.3% of the market. This suggests a strong demand for properties suitable for couples or solo travelers.
- Together, 1 bedroom and 2 bedrooms properties represent 66.6% of the active Airbnb listings in Collonges-sous-Salève, indicating a high concentration in these sizes.
- With over half the market (53.3%) consisting of studios or 1-bedroom units, Collonges-sous-Salève is particularly well-suited for individuals or couples.
Collonges-sous-Salève Vacation Rental Guest Capacity Trends (2025)
Distribution of Listings by Guest Capacity
Guest Capacity Insights for Collonges-sous-Salève
- The most common guest capacity trend in Collonges-sous-Salève vacation rentals is listings accommodating 2 guests (30%). This suggests the primary traveler segment is likely couples or solo travelers.
- Properties designed for 2 guests and 4 guests dominate the Collonges-sous-Salève STR market, accounting for 60.0% of listings.
- 19.9% of properties accommodate 6+ guests, serving the market segment for larger families or group travel in Collonges-sous-Salève.
- On average, properties in Collonges-sous-Salève are equipped to host 3.5 guests.
Collonges-sous-Salève Airbnb Booking Patterns (2025): Available vs. Booked Days
Available Days Distribution
Booked Days Distribution
Booking Pattern Insights for Collonges-sous-Salève
- The most common availability pattern in Collonges-sous-Salève falls within the 271-366 days range, representing 43.3% of listings. This suggests many properties have significant open periods on their calendars.
- Approximately 76.6% of listings show high availability (181+ days open annually), indicating potential for increased bookings or specific owner usage patterns.
- For booked days, the 91-180 days range is most frequent in Collonges-sous-Salève (30%), reflecting common guest stay durations or potential owner blocking patterns.
- A notable 26.6% of properties secure long booking periods (181+ days booked per year), highlighting successful long-term rental strategies or significant owner usage.
Collonges-sous-Salève Airbnb Minimum Stay Requirements Analysis
Distribution of Listings by Minimum Night Requirement
1 Night
8 listings
27.6% of total
2 Nights
11 listings
37.9% of total
3 Nights
1 listings
3.4% of total
4-6 Nights
7 listings
24.1% of total
7-29 Nights
1 listings
3.4% of total
30+ Nights
1 listings
3.4% of total
Key Insights
- The most prevalent minimum stay requirement in Collonges-sous-Salève is 2 Nights, adopted by 37.9% of listings. This highlights the market's preference for shorter, flexible bookings.
- A strong majority (65.5%) of the Collonges-sous-Salève Airbnb data shows acceptance of very short stays (1-2 nights), indicating a dynamic, high-turnover market.
Recommendations
- Align with the market by considering a 2 Nights minimum stay, as 37.9% of Collonges-sous-Salève hosts use this setting.
- If feasible, allowing 1-night stays, especially midweek or during low season, could capture last-minute bookings, as only 27.6% currently do.
- Adjust minimum nights based on seasonality – potentially shorter during low season and longer during peak demand periods in Collonges-sous-Salève.
Collonges-sous-Salève Airbnb Cancellation Policy Trends Analysis (2025)
Flexible
8 listings
30.8% of total
Moderate
11 listings
42.3% of total
Firm
2 listings
7.7% of total
Strict
5 listings
19.2% of total
Cancellation Policy Insights for Collonges-sous-Salève
- The prevailing Airbnb cancellation policy trend in Collonges-sous-Salève is Moderate, used by 42.3% of listings.
- The market strongly favors guest-friendly terms, with 73.1% of listings offering Flexible or Moderate policies. This suggests guests in Collonges-sous-Salève may expect booking flexibility.
Recommendations for Hosts
- Consider adopting a Moderate policy to align with the 42.3% market standard in Collonges-sous-Salève.
- Regularly review your cancellation policy against competitors and market demand shifts in Collonges-sous-Salève.
Collonges-sous-Salève STR Booking Lead Time Analysis (2025)
Average Booking Lead Time by Month
Booking Lead Time Insights for Collonges-sous-Salève
- The overall average booking lead time for vacation rentals in Collonges-sous-Salève is 40 days.
- Guests book furthest in advance for stays during June (average 78 days), likely coinciding with peak travel demand or local events.
- The shortest booking windows occur for stays in January (average 32 days), indicating more last-minute travel plans during this time.
- Seasonally, Summer (69 days avg.) sees the longest lead times, while Winter (39 days avg.) has the shortest, reflecting typical travel planning cycles.
Recommendations for Hosts
- Use the overall average lead time (40 days) as a baseline for your pricing and availability strategy in Collonges-sous-Salève.
- For June stays, consider implementing length-of-stay discounts or slightly higher rates for bookings made less than 78 days out to capitalize on advance planning.
- Target marketing efforts for the Summer season well in advance (at least 69 days) to capture early planners.
- Monitor your own booking lead times against these Collonges-sous-Salève averages to identify opportunities for dynamic pricing adjustments.
Popular & Essential Airbnb Amenities in Collonges-sous-Salève (2025)
Amenity Prevalence
Amenity Insights for Collonges-sous-Salève
- Essential amenities in Collonges-sous-Salève that guests expect include: Wifi, Heating. Lacking these (any) could significantly impact bookings.
- Popular amenities like Free parking on premises, Cooking basics, Iron are common but not universal. Offering these can provide a competitive edge.
Recommendations for Hosts
- Ensure your listing includes all essential amenities for Collonges-sous-Salève: Wifi, Heating.
- Prioritize adding missing essentials: Heating.
- Consider adding popular differentiators like Free parking on premises or Cooking basics to increase appeal.
- Highlight unique or less common amenities you offer (e.g., hot tub, dedicated workspace, EV charger) in your listing description and photos.
- Regularly check competitor amenities in Collonges-sous-Salève to stay competitive.
Collonges-sous-Salève Airbnb Guest Demographics & Profile Analysis (2025)
Guest Profile Summary for Collonges-sous-Salève
- The typical guest profile for Airbnb in Collonges-sous-Salève consists of a mix of domestic (60%) and international guests, often arriving from nearby Paris, typically belonging to the Post-2000s (Gen Z/Alpha) group (50%), primarily speaking English or French.
- Domestic travelers account for 59.7% of guests.
- Key international markets include France (59.7%) and Switzerland (8.1%).
- Top languages spoken are English (36%) followed by French (27.1%).
- A significant demographic segment is the Post-2000s (Gen Z/Alpha) group, representing 50% of guests.
Recommendations for Hosts
- Balance marketing efforts between domestic and international channels based on the guest mix.
- Tailor amenities and listing descriptions to appeal to the dominant Post-2000s (Gen Z/Alpha) demographic (e.g., highlight fast WiFi, smart home features, local guides).
- Highlight unique local experiences or amenities relevant to the primary guest profile.
- Consider seasonal promotions aligned with peak travel times for key origin markets.
Nearby Short-Term Rental Market Comparison
How does the Collonges-sous-Salève Airbnb market stack up against its neighbors? Compare key performance metrics like average monthly revenue, ADR, and occupancy rates in surrounding areas to understand the broader regional STR landscape.
| Market | Active Properties | Monthly Revenue | Daily Rate | Avg. Occupancy |
|---|---|---|---|---|
| Lauterbrunnen | 525 | $7,079 | $546.45 | 54% |
| La Rivière-Enverse | 17 | $5,972 | $624.02 | 41% |
| Les Clefs | 30 | $5,741 | $323.11 | 44% |
| Matten bei Interlaken | 52 | $5,674 | $316.63 | 63% |
| Iseltwald | 14 | $5,491 | $331.95 | 58% |
| Habkern | 13 | $5,382 | $344.74 | 50% |
| Interlaken | 288 | $4,987 | $310.52 | 56% |
| Zermatt | 734 | $4,604 | $463.00 | 46% |
| Oberhofen am Thunersee | 24 | $4,572 | $265.94 | 55% |
| Sigriswil | 99 | $4,371 | $271.90 | 58% |