Chambonas Airbnb Market Analysis 2025: Short Term Rental Data & Vacation Rental Statistics in Auvergne-Rhône-Alpes, France
Is Airbnb profitable in Chambonas in 2025? Explore comprehensive Airbnb analytics for Chambonas, Auvergne-Rhône-Alpes, France to uncover income potential. This 2025 STR market report for Chambonas, based on AirROI data from April 2024 to March 2025, reveals key trends in the niche market of 31 active listings.
Whether you're considering an Airbnb investment in Chambonas, optimizing your existing vacation rental, or exploring rental arbitrage opportunities, understanding the Chambonas Airbnb data is crucial. Understanding the local regulations is key to maximizing your short term rental income potential. Let's dive into the specifics.
Key Chambonas Airbnb Performance Metrics Overview
Monthly Airbnb Revenue Variations & Income Potential in Chambonas (2025)
Understanding the monthly revenue variations for Airbnb listings in Chambonas is key to maximizing your short term rental income potential. Seasonality significantly impacts earnings. Our analysis, based on data from the past 12 months, shows that the peak revenue month for STRs in Chambonas is typically August, while November often presents the lowest earnings, highlighting opportunities for strategic pricing adjustments during shoulder and low seasons. Explore the typical Airbnb income in Chambonas across different performance tiers:
- Best-in-class properties (Top 10%) achieve $3,079+ monthly, often utilizing dynamic pricing and superior guest experiences.
- Strong performing properties (Top 25%) earn $2,077 or more, indicating effective management and desirable locations/amenities.
- Typical properties (Median) generate around $1,065 per month, representing the average market performance.
- Entry-level properties (Bottom 25%) see earnings around $577, often with potential for optimization.
Average Monthly Airbnb Earnings Trend in Chambonas
Chambonas Airbnb Occupancy Rate Trends (2025)
Maximize your bookings by understanding the Chambonas STR occupancy trends. Seasonal demand shifts significantly influence how often properties are booked. Typically, Augustsees the highest demand (peak season occupancy), while November experiences the lowest (low season). Effective strategies, like adjusting minimum stays or offering promotions, can boost occupancy during slower periods. Here's how different property tiers perform in Chambonas:
- Best-in-class properties (Top 10%) achieve 54%+ occupancy, indicating high desirability and potentially optimized availability.
- Strong performing properties (Top 25%) maintain 43% or higher occupancy, suggesting good market fit and guest satisfaction.
- Typical properties (Median) have an occupancy rate around 21%.
- Entry-level properties (Bottom 25%) average 11% occupancy, potentially facing higher vacancy.
Average Monthly Occupancy Rate Trend in Chambonas
Average Daily Rate (ADR) Airbnb Trends in Chambonas (2025)
Effective short term rental pricing strategy in Chambonas involves understanding monthly ADR fluctuations. The Average Daily Rate (ADR) for Airbnb in Chambonas typically peaks in July and dips lowest during March. Leveraging Airbnb dynamic pricing tools or strategies based on this seasonality can significantly boost revenue. Here's a look at the typical nightly rates achieved:
- Best-in-class properties (Top 10%) command rates of $325+ per night, often due to premium features or locations.
- Strong performing properties (Top 25%) achieve nightly rates of $201 or more.
- Typical properties (Median) charge around $131 per night.
- Entry-level properties (Bottom 25%) earn around $88 per night.
Average Daily Rate (ADR) Trend by Month in Chambonas
Get Live Chambonas Market Intelligence 👇

Explore Real-time Analytics
Airbnb Seasonality Analysis & Trends in Chambonas (2025)
Peak Season (August, July, May)
- Revenue averages $2,650 per month
- Occupancy rates average 43.7%
- Daily rates average $169
Shoulder Season
- Revenue averages $1,356 per month
- Occupancy maintains around 25.2%
- Daily rates hold near $162
Low Season (January, February, November)
- Revenue drops to average $654 per month
- Occupancy decreases to average 17.2%
- Daily rates adjust to average $160
Seasonality Insights for Chambonas
- The Airbnb seasonality in Chambonas shows highly seasonal trends requiring careful strategy. While the sections above show seasonal averages, it's also insightful to look at the extremes:
- During the high season, the absolute peak month showcases Chambonas's highest earning potential, with monthly revenues capable of climbing to $2,985, occupancy reaching a high of 56.2%, and ADRs peaking at $173.
- Conversely, the slowest single month of the year, typically falling within the low season, marks the market's lowest point. In this month, revenue might dip to $567, occupancy could drop to 16.4%, and ADRs may adjust down to $155.
- Understanding both the seasonal averages and these monthly peaks and troughs in revenue, occupancy, and ADR is crucial for maximizing your Airbnb profit potential in Chambonas.
Seasonal Strategies for Maximizing Profit
- Peak Season: Maximize revenue through premium pricing and potentially longer minimum stays. Ensure high availability.
- Low Season: Offer competitive pricing, special promotions (e.g., extended stay discounts), and flexible cancellation policies. Target off-season travelers like remote workers or budget-conscious guests.
- Shoulder Seasons: Implement dynamic pricing that balances peak and low rates. Target weekend travelers or specific events. Offer slightly more flexible terms than peak season.
- Regularly analyze your own performance against these Chambonas seasonality benchmarks and adjust your pricing and availability strategy accordingly.
Best Areas for Airbnb Investment in Chambonas (2025)
Exploring the top neighborhoods for short-term rentals in Chambonas? This section highlights key areas, outlining why they are attractive for hosts and guests, along with notable local attractions. Consider these locations based on your target guest profile and investment strategy.
| Neighborhood / Area | Why Host Here? (Target Guests & Appeal) | Key Attractions & Landmarks |
|---|---|---|
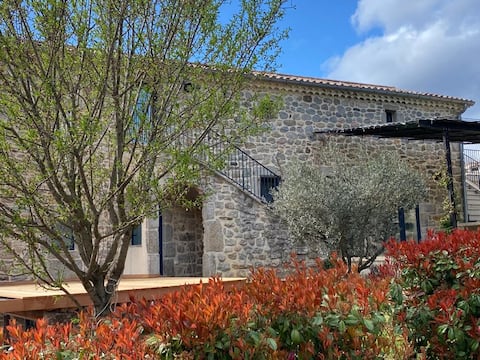
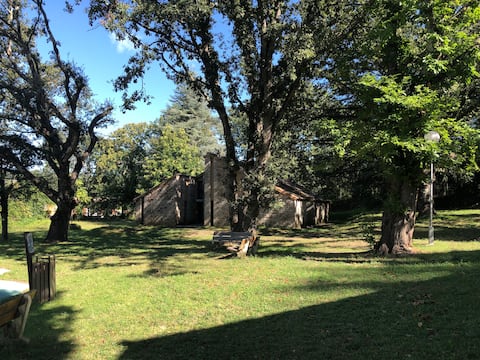
| Chambonas Village | Charming village known for its picturesque landscapes and traditional architecture, perfect for visitors seeking a peaceful and cultural experience. | Historic village center, Local markets, Scenic hiking trails, Nearby vineyards, River activities |
| Gorges de l'Ardèche | Famous natural gorge offering stunning views and outdoor activities like canoeing and hiking, a hotspot for adventure seekers. | Canoeing on the Ardèche, Hiking trails, Natural bridges, Scenic viewpoints, Kayaking |
| Vallon-Pont-d'Arc | Lively town near the Ardèche River with access to natural wonders and vibrant local life, ideal for families and nature lovers. | Pont d'Arc, Cave of Chauvet, Local shops and restaurants, Beach access, Domaine de la Baume |
| Alès | Nearby city with a rich mining history and cultural attractions, appealing to both business travelers and tourists. | Museums, Local cuisine, Shopping districts, Parks, Cultural festivals |
| Anduze | Known for its bamboo grove and the historic Anduze steam train, perfect for tourists interested in unique local experiences. | Bamboo Park, Anduze train, Pottery artisans, Gardens, Riverbank strolls |
| Saint-Ambroix | A small town with a rich history and vibrant Wednesday market, attractive to visitors seeking local culture and traditions. | Historic architecture, Weekly markets, Local festivals, Cafés and bistros, Nearby hiking trails |
| Bagnols-sur-Cèze | A larger town offering more amenities and attractions, appealing to travelers looking for a base to explore the region. | Cultural sites, Riverfront parks, Shopping, Gastronomy, Art galleries |
| Buzeins | Quaint village noted for its friendliness and access to nature, creating a welcoming environment for guests seeking tranquility. | Nature walks, Rural landscapes, Cultural events, Artisan shops, Local gastronomy |
Understanding Airbnb License Requirements & STR Laws in Chambonas (2025)
With 19% of listings showing registration in 2025, understanding potential Airbnb license requirements is crucial in Chambonas. Always verify the latest short term rental regulations and Airbnb license requirements directly with local government authorities for Chambonas to ensure full compliance before hosting.
(Source: AirROI data, 2025, based on 19% licensed listings)
Top Performing Airbnb Properties in Chambonas (2025)
Benchmark your potential! Explore examples of top-performing Airbnb properties in Chambonasbased on Trailing Twelve Month (TTM) revenue. Analyze their characteristics, revenue, occupancy rate, and ADR to understand what drives success in this market.
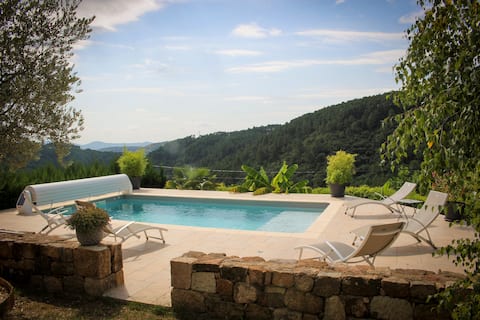
Quiet vacation home with private swimming pool
Entire Place • 3 bedrooms
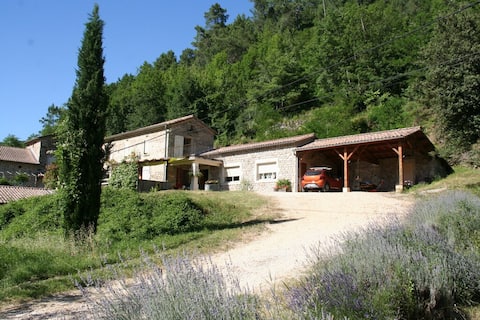
L'ostalet Bellepierre
Entire Place • 4 bedrooms
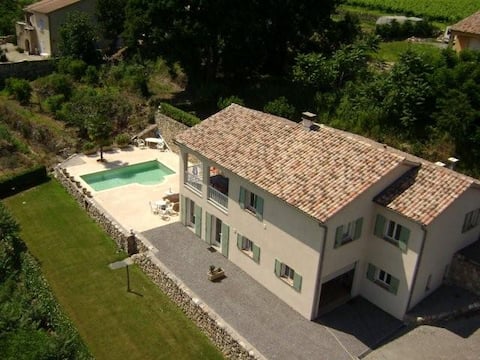
Villa Les Terrasses, 14 pers, private swimming pool
Entire Place • 5 bedrooms
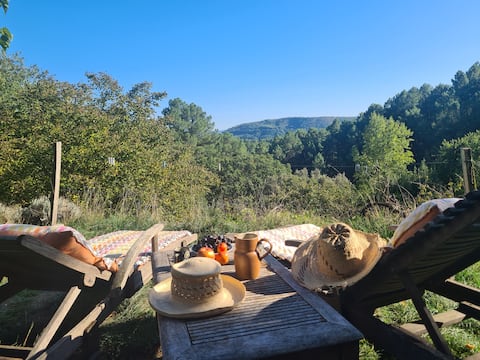
LOVE NEST in South Ardèche
Entire Place • N/A
Villa Le Meliet, 12-18 pers, private swimming pool
Entire Place • 7 bedrooms
Location Ardèche pour 10 pers. aux Vans
Entire Place • 2 bedrooms
Note: Performance varies based on location, size, amenities, seasonality, and management quality. Data reflects the past 12 months.
Top Performing Airbnb Hosts in Chambonas (2025)
Learn from the best! This table showcases top-performing Airbnb hosts in Chambonas based on the number of properties managed and estimated total revenue over the past year. Analyze their scale and performance metrics.
| Host Name | Properties | Grossing Revenue | Stay Reviews | Avg Rating |
|---|---|---|---|---|
| Tom | 3 | $59,283 | 59 | 4.48/5.0 |
| Chloé De Terres De France | 2 | $36,187 | 10 | 2.19/5.0 |
| Oriane | 1 | $31,746 | 13 | 5.00/5.0 |
| Annie | 1 | $27,538 | 4 | 4.75/5.0 |
| Christine & Marc | 1 | $22,295 | 67 | 4.82/5.0 |
| Séverine | 1 | $18,306 | 31 | 4.77/5.0 |
| Milouda | 1 | $15,592 | 23 | 4.87/5.0 |
| Sébastien | 1 | $15,328 | 4 | 5.00/5.0 |
| Naïmé | 2 | $13,850 | 15 | 2.46/5.0 |
| Florence | 1 | $11,602 | 4 | 5.00/5.0 |
Analyzing the strategies of top hosts, such as their property selection, pricing, and guest communication, can offer valuable lessons for optimizing your own Airbnb operations in Chambonas.
Dive Deeper: Advanced Chambonas STR Market Data (2025)
Ready to unlock more insights? AirROI provides access to advanced metrics and comprehensive Airbnb data for Chambonas. Explore detailed analytics beyond this report to refine your investment strategy, optimize pricing, and maximize your vacation rental profits.
Explore Advanced MetricsChambonas Short-Term Rental Market Composition (2025): Property & Room Types
Room Type Distribution
Property Type Distribution
Market Composition Insights for Chambonas
- The Chambonas Airbnb market composition is heavily skewed towards Entire Home/Apt listings, which make up 100% of the 31 active rentals. This indicates strong guest preference for privacy and space.
- Looking at the property type distribution in Chambonas, House properties are the most common (77.4%), reflecting the local real estate landscape.
- Houses represent a significant 77.4% portion, catering likely to families or larger groups.
- Smaller segments like outdoor/unique (combined 3.2%) offer potential for unique stay experiences.
Chambonas Airbnb Room Capacity Analysis (2025): Bedroom Distribution
Distribution of Listings by Number of Bedrooms
Room Capacity Insights for Chambonas
- The dominant room capacity in Chambonas is 3 bedrooms listings, making up 29% of the market. This suggests a strong demand for properties suitable for families or small groups.
- Together, 3 bedrooms and 2 bedrooms properties represent 58.0% of the active Airbnb listings in Chambonas, indicating a high concentration in these sizes.
- A significant 48.4% of listings offer 3+ bedrooms, catering to larger groups and families seeking more space in Chambonas.
Chambonas Vacation Rental Guest Capacity Trends (2025)
Distribution of Listings by Guest Capacity
Guest Capacity Insights for Chambonas
- The most common guest capacity trend in Chambonas vacation rentals is listings accommodating 8+ guests (25.8%). This suggests the primary traveler segment is likely larger groups.
- Properties designed for 8+ guests and 6 guests dominate the Chambonas STR market, accounting for 48.4% of listings.
- 54.9% of properties accommodate 6+ guests, serving the market segment for larger families or group travel in Chambonas.
- On average, properties in Chambonas are equipped to host 5.6 guests.
Chambonas Airbnb Booking Patterns (2025): Available vs. Booked Days
Available Days Distribution
Booked Days Distribution
Booking Pattern Insights for Chambonas
- The most common availability pattern in Chambonas falls within the 271-366 days range, representing 77.4% of listings. This suggests many properties have significant open periods on their calendars.
- Approximately 96.8% of listings show high availability (181+ days open annually), indicating potential for increased bookings or specific owner usage patterns.
- For booked days, the 31-90 days range is most frequent in Chambonas (51.6%), reflecting common guest stay durations or potential owner blocking patterns.
- A notable 3.2% of properties secure long booking periods (181+ days booked per year), highlighting successful long-term rental strategies or significant owner usage.
Chambonas Airbnb Minimum Stay Requirements Analysis
Distribution of Listings by Minimum Night Requirement
1 Night
4 listings
12.9% of total
2 Nights
12 listings
38.7% of total
3 Nights
3 listings
9.7% of total
4-6 Nights
4 listings
12.9% of total
7-29 Nights
7 listings
22.6% of total
30+ Nights
1 listings
3.2% of total
Key Insights
- The most prevalent minimum stay requirement in Chambonas is 2 Nights, adopted by 38.7% of listings. This highlights the market's preference for shorter, flexible bookings.
Recommendations
- Align with the market by considering a 2 Nights minimum stay, as 38.7% of Chambonas hosts use this setting.
- If feasible, allowing 1-night stays, especially midweek or during low season, could capture last-minute bookings, as only 12.9% currently do.
- A 2-night minimum appears standard (38.7%). Consider this for weekends or peak periods.
- Adjust minimum nights based on seasonality – potentially shorter during low season and longer during peak demand periods in Chambonas.
Chambonas Airbnb Cancellation Policy Trends Analysis (2025)
Flexible
2 listings
8.3% of total
Moderate
3 listings
12.5% of total
Firm
9 listings
37.5% of total
Strict
10 listings
41.7% of total
Cancellation Policy Insights for Chambonas
- The prevailing Airbnb cancellation policy trend in Chambonas is Strict, used by 41.7% of listings.
- A majority (79.2%) of hosts in Chambonas utilize Firm or Strict policies, indicating a market where hosts prioritize booking security.
Recommendations for Hosts
- Consider adopting a Strict policy to align with the 41.7% market standard in Chambonas.
- With 41.7% using Strict terms, this is a viable option in Chambonas, particularly for high-value properties or during peak demand periods.
- Regularly review your cancellation policy against competitors and market demand shifts in Chambonas.
Chambonas STR Booking Lead Time Analysis (2025)
Average Booking Lead Time by Month
Booking Lead Time Insights for Chambonas
- The overall average booking lead time for vacation rentals in Chambonas is 59 days.
- Guests book furthest in advance for stays during May (average 91 days), likely coinciding with peak travel demand or local events.
- The shortest booking windows occur for stays in November (average 19 days), indicating more last-minute travel plans during this time.
- Seasonally, Spring (79 days avg.) sees the longest lead times, while Winter (35 days avg.) has the shortest, reflecting typical travel planning cycles.
Recommendations for Hosts
- Use the overall average lead time (59 days) as a baseline for your pricing and availability strategy in Chambonas.
- For May stays, consider implementing length-of-stay discounts or slightly higher rates for bookings made less than 91 days out to capitalize on advance planning.
- Target marketing efforts for the Spring season well in advance (at least 79 days) to capture early planners.
- Monitor your own booking lead times against these Chambonas averages to identify opportunities for dynamic pricing adjustments.
Popular & Essential Airbnb Amenities in Chambonas (2025)
Amenity Prevalence
Amenity Insights for Chambonas
- Essential amenities in Chambonas that guests expect include: Free parking on premises, Kitchen. Lacking these (any) could significantly impact bookings.
- Popular amenities like Washer, Outdoor dining area, Coffee maker are common but not universal. Offering these can provide a competitive edge.
Recommendations for Hosts
- Ensure your listing includes all essential amenities for Chambonas: Free parking on premises, Kitchen.
- Prioritize adding missing essentials: Free parking on premises, Kitchen.
- Consider adding popular differentiators like Washer or Outdoor dining area to increase appeal.
- Highlight unique or less common amenities you offer (e.g., hot tub, dedicated workspace, EV charger) in your listing description and photos.
- Regularly check competitor amenities in Chambonas to stay competitive.
Chambonas Airbnb Guest Demographics & Profile Analysis (2025)
Guest Profile Summary for Chambonas
- The typical guest profile for Airbnb in Chambonas consists of primarily domestic travelers (81%), often arriving from nearby Paris, typically belonging to the Post-2000s (Gen Z/Alpha) group (50%), primarily speaking French or English.
- Domestic travelers account for 80.7% of guests.
- Key international markets include France (80.7%) and Netherlands (7.2%).
- Top languages spoken are French (38.1%) followed by English (33.3%).
- A significant demographic segment is the Post-2000s (Gen Z/Alpha) group, representing 50% of guests.
Recommendations for Hosts
- Target domestic marketing efforts towards travelers from Paris and Lyon.
- Tailor amenities and listing descriptions to appeal to the dominant Post-2000s (Gen Z/Alpha) demographic (e.g., highlight fast WiFi, smart home features, local guides).
- Highlight unique local experiences or amenities relevant to the primary guest profile.
- Consider seasonal promotions aligned with peak travel times for key origin markets.
Nearby Short-Term Rental Market Comparison
How does the Chambonas Airbnb market stack up against its neighbors? Compare key performance metrics like average monthly revenue, ADR, and occupancy rates in surrounding areas to understand the broader regional STR landscape.
| Market | Active Properties | Monthly Revenue | Daily Rate | Avg. Occupancy |
|---|---|---|---|---|
| Villeneuvette | 13 | $4,150 | $337.56 | 44% |
| Divajeu | 19 | $3,941 | $410.65 | 42% |
| Saint-Germain-au-Mont-d'Or | 10 | $3,928 | $316.02 | 40% |
| Dommartin | 11 | $3,905 | $327.00 | 36% |
| Courzieu | 11 | $3,267 | $287.83 | 52% |
| Vanosc | 13 | $3,072 | $224.52 | 44% |
| Chantepérier | 20 | $3,057 | $281.60 | 37% |
| Gordes | 225 | $2,913 | $366.32 | 43% |
| Redessan | 19 | $2,834 | $334.82 | 34% |
| Fontarèches | 11 | $2,802 | $525.31 | 34% |