Chambon-sur-Lac Airbnb Market Analysis 2025: Short Term Rental Data & Vacation Rental Statistics in Auvergne-Rhône-Alpes, France
Is Airbnb profitable in Chambon-sur-Lac in 2025? Explore comprehensive Airbnb analytics for Chambon-sur-Lac, Auvergne-Rhône-Alpes, France to uncover income potential. This 2025 STR market report for Chambon-sur-Lac, based on AirROI data from April 2024 to March 2025, reveals key trends in the niche market of 92 active listings.
Whether you're considering an Airbnb investment in Chambon-sur-Lac, optimizing your existing vacation rental, or exploring rental arbitrage opportunities, understanding the Chambon-sur-Lac Airbnb data is crucial. Navigating the high regulation landscape is key to maximizing your short term rental income potential. Let's dive into the specifics.
Key Chambon-sur-Lac Airbnb Performance Metrics Overview
Monthly Airbnb Revenue Variations & Income Potential in Chambon-sur-Lac (2025)
Understanding the monthly revenue variations for Airbnb listings in Chambon-sur-Lac is key to maximizing your short term rental income potential. Seasonality significantly impacts earnings. Our analysis, based on data from the past 12 months, shows that the peak revenue month for STRs in Chambon-sur-Lac is typically August, while November often presents the lowest earnings, highlighting opportunities for strategic pricing adjustments during shoulder and low seasons. Explore the typical Airbnb income in Chambon-sur-Lac across different performance tiers:
- Best-in-class properties (Top 10%) achieve $3,749+ monthly, often utilizing dynamic pricing and superior guest experiences.
- Strong performing properties (Top 25%) earn $2,638 or more, indicating effective management and desirable locations/amenities.
- Typical properties (Median) generate around $1,575 per month, representing the average market performance.
- Entry-level properties (Bottom 25%) see earnings around $877, often with potential for optimization.
Average Monthly Airbnb Earnings Trend in Chambon-sur-Lac
Chambon-sur-Lac Airbnb Occupancy Rate Trends (2025)
Maximize your bookings by understanding the Chambon-sur-Lac STR occupancy trends. Seasonal demand shifts significantly influence how often properties are booked. Typically, Augustsees the highest demand (peak season occupancy), while November experiences the lowest (low season). Effective strategies, like adjusting minimum stays or offering promotions, can boost occupancy during slower periods. Here's how different property tiers perform in Chambon-sur-Lac:
- Best-in-class properties (Top 10%) achieve 80%+ occupancy, indicating high desirability and potentially optimized availability.
- Strong performing properties (Top 25%) maintain 66% or higher occupancy, suggesting good market fit and guest satisfaction.
- Typical properties (Median) have an occupancy rate around 44%.
- Entry-level properties (Bottom 25%) average 24% occupancy, potentially facing higher vacancy.
Average Monthly Occupancy Rate Trend in Chambon-sur-Lac
Average Daily Rate (ADR) Airbnb Trends in Chambon-sur-Lac (2025)
Effective short term rental pricing strategy in Chambon-sur-Lac involves understanding monthly ADR fluctuations. The Average Daily Rate (ADR) for Airbnb in Chambon-sur-Lac typically peaks in July and dips lowest during November. Leveraging Airbnb dynamic pricing tools or strategies based on this seasonality can significantly boost revenue. Here's a look at the typical nightly rates achieved:
- Best-in-class properties (Top 10%) command rates of $236+ per night, often due to premium features or locations.
- Strong performing properties (Top 25%) achieve nightly rates of $166 or more.
- Typical properties (Median) charge around $119 per night.
- Entry-level properties (Bottom 25%) earn around $76 per night.
Average Daily Rate (ADR) Trend by Month in Chambon-sur-Lac
Get Live Chambon-sur-Lac Market Intelligence 👇

Explore Real-time Analytics
Airbnb Seasonality Analysis & Trends in Chambon-sur-Lac (2025)
Peak Season (August, July, February)
- Revenue averages $2,913 per month
- Occupancy rates average 64.5%
- Daily rates average $148
Shoulder Season
- Revenue averages $1,807 per month
- Occupancy maintains around 43.8%
- Daily rates hold near $134
Low Season (January, October, November)
- Revenue drops to average $1,157 per month
- Occupancy decreases to average 30.6%
- Daily rates adjust to average $131
Seasonality Insights for Chambon-sur-Lac
- The Airbnb seasonality in Chambon-sur-Lac shows highly seasonal trends requiring careful strategy. While the sections above show seasonal averages, it's also insightful to look at the extremes:
- During the high season, the absolute peak month showcases Chambon-sur-Lac's highest earning potential, with monthly revenues capable of climbing to $3,612, occupancy reaching a high of 77.0%, and ADRs peaking at $150.
- Conversely, the slowest single month of the year, typically falling within the low season, marks the market's lowest point. In this month, revenue might dip to $981, occupancy could drop to 27.0%, and ADRs may adjust down to $129.
- Understanding both the seasonal averages and these monthly peaks and troughs in revenue, occupancy, and ADR is crucial for maximizing your Airbnb profit potential in Chambon-sur-Lac.
Seasonal Strategies for Maximizing Profit
- Peak Season: Maximize revenue through premium pricing and potentially longer minimum stays. Ensure high availability.
- Low Season: Offer competitive pricing, special promotions (e.g., extended stay discounts), and flexible cancellation policies. Target off-season travelers like remote workers or budget-conscious guests.
- Shoulder Seasons: Implement dynamic pricing that balances peak and low rates. Target weekend travelers or specific events. Offer slightly more flexible terms than peak season.
- Regularly analyze your own performance against these Chambon-sur-Lac seasonality benchmarks and adjust your pricing and availability strategy accordingly.
Best Areas for Airbnb Investment in Chambon-sur-Lac (2025)
Exploring the top neighborhoods for short-term rentals in Chambon-sur-Lac? This section highlights key areas, outlining why they are attractive for hosts and guests, along with notable local attractions. Consider these locations based on your target guest profile and investment strategy.
| Neighborhood / Area | Why Host Here? (Target Guests & Appeal) | Key Attractions & Landmarks |
|---|---|---|
| Chambon-sur-Lac Center | The heart of Chambon-sur-Lac, this area offers stunning views of the lake and access to local shops and restaurants. It’s perfect for guests looking to enjoy the tranquility of nature along with modern conveniences. | Lac du Chambon, Château de Murol, Station de ski du Mont-Dore, Puy de Sancy, Sentiers de randonnée |
| Les Prades | A picturesque village near the lake, Les Prades is ideal for those seeking a peaceful retreat with a close-knit community vibe. It attracts nature lovers and families looking to relax in a serene environment. | Les Prades village, Local artisan shops, Puy de Sancy hiking trails |
| Mont-Dore | Just a short drive away, Mont-Dore is a popular ski resort in winter and a hiking destination in summer, making it a year-round attraction for tourists. Ideal for adventure seekers. | Mont-Dore Ski Resort, Thermal baths, Puy de Sancy |
| Murol | Home to the historic Château de Murol, this area offers both culture and nature, attracting history buffs and families. Its medieval castle is a significant draw for tourists. | Château de Murol, Hiking trails around Murol, Local markets |
| La Bourboule | Known for its spa facilities and wellness tourism, La Bourboule attracts visitors looking for relaxation and rejuvenation, especially those interested in thermal treatments. | Thermal baths, La Bourboule Casino, Treetop Adventure Park |
| Super Besse | A vibrant alpine resort that attracts ski enthusiasts in winter and hikers in summer, Super Besse is positioned as a must-visit for sports lovers. | Super Besse Ski Resort, Lac Pavin, Mountain biking trails |
| Cœur de Sancy | This area is renowned for its breathtaking views and outdoor activities, making it a prime location for tourists interested in eco-tourism and adventure sports. | Puy de Sancy, Nature reserves, Hiking and biking paths |
| Saint-Nectaire | Famous for its cheese and scenic beauty, Saint-Nectaire offers a unique cultural experience along with easy access to hiking trails, attracting culinary enthusiasts and nature lovers. | Saint-Nectaire cheese farms, Local vineyards, Historical churches |
Understanding Airbnb License Requirements & STR Laws in Chambon-sur-Lac (2025)
Yes, Chambon-sur-Lac, Auvergne-Rhône-Alpes, France enforces high STR regulations. Obtaining a license and ensuring compliance is almost certainly required according to current 2025 STR laws. Always verify the latest short term rental regulations and Airbnb license requirements directly with local government authorities for Chambon-sur-Lac to ensure full compliance before hosting.
(Source: AirROI data, 2025, based on 35% licensed listings)
Top Performing Airbnb Properties in Chambon-sur-Lac (2025)
Benchmark your potential! Explore examples of top-performing Airbnb properties in Chambon-sur-Lacbased on Trailing Twelve Month (TTM) revenue. Analyze their characteristics, revenue, occupancy rate, and ADR to understand what drives success in this market.

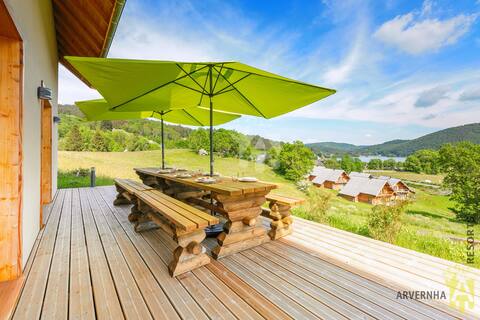
Grande Cabane du Lac
Entire Place • 4 bedrooms
Gîte du Père François (10 people)
Entire Place • 5 bedrooms
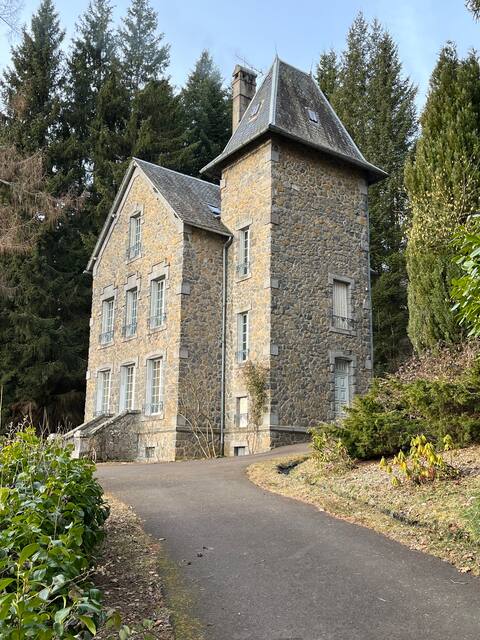
Big house at the foot of the Sancy
Entire Place • 6 bedrooms
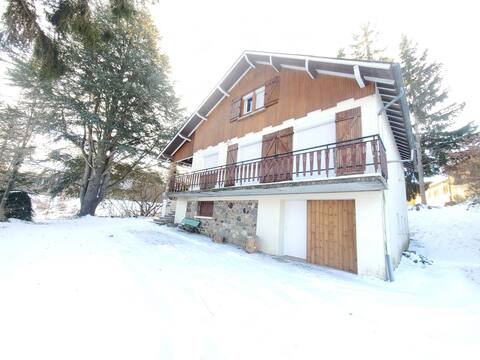
PLEASANT CHALET *** close to the Lake
Entire Place • 6 bedrooms
La Fuste du Lac
Entire Place • 4 bedrooms
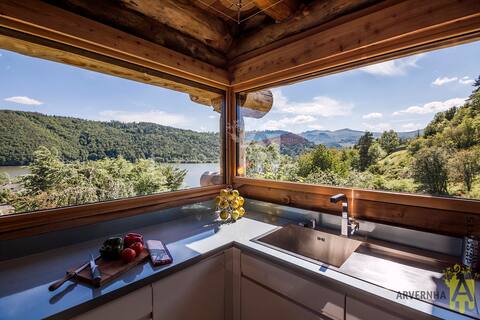
***CHALET with lake view of Lake Chambon and Sancy
Entire Place • 4 bedrooms
Note: Performance varies based on location, size, amenities, seasonality, and management quality. Data reflects the past 12 months.
Top Performing Airbnb Hosts in Chambon-sur-Lac (2025)
Learn from the best! This table showcases top-performing Airbnb hosts in Chambon-sur-Lac based on the number of properties managed and estimated total revenue over the past year. Analyze their scale and performance metrics.
| Host Name | Properties | Grossing Revenue | Stay Reviews | Avg Rating |
|---|---|---|---|---|
| Arvernha | 23 | $519,305 | 319 | 4.57/5.0 |
| Sylvain | 6 | $81,913 | 101 | 4.07/5.0 |
| Sébastien | 4 | $65,943 | 137 | 4.11/5.0 |
| Résa Gîtes | 5 | $46,492 | 5 | 0.87/5.0 |
| Berengere | 1 | $44,536 | 3 | 5.00/5.0 |
| Virginie | 1 | $39,207 | 66 | 4.64/5.0 |
| Olivier | 3 | $38,846 | 79 | 4.76/5.0 |
| Auvergne | 4 | $38,456 | 52 | 4.57/5.0 |
| Lilian BOYER | 3 | $37,849 | 158 | 4.17/5.0 |
| Christophe | 1 | $37,153 | 154 | 4.77/5.0 |
Analyzing the strategies of top hosts, such as their property selection, pricing, and guest communication, can offer valuable lessons for optimizing your own Airbnb operations in Chambon-sur-Lac.
Dive Deeper: Advanced Chambon-sur-Lac STR Market Data (2025)
Ready to unlock more insights? AirROI provides access to advanced metrics and comprehensive Airbnb data for Chambon-sur-Lac. Explore detailed analytics beyond this report to refine your investment strategy, optimize pricing, and maximize your vacation rental profits.
Explore Advanced MetricsChambon-sur-Lac Short-Term Rental Market Composition (2025): Property & Room Types
Room Type Distribution
Property Type Distribution
Market Composition Insights for Chambon-sur-Lac
- The Chambon-sur-Lac Airbnb market composition is heavily skewed towards Entire Home/Apt listings, which make up 95.7% of the 92 active rentals. This indicates strong guest preference for privacy and space.
- Looking at the property type distribution in Chambon-sur-Lac, House properties are the most common (66.3%), reflecting the local real estate landscape.
- Houses represent a significant 66.3% portion, catering likely to families or larger groups.
- Smaller segments like others, hotel/boutique, unique stays (combined 5.5%) offer potential for unique stay experiences.
Chambon-sur-Lac Airbnb Room Capacity Analysis (2025): Bedroom Distribution
Distribution of Listings by Number of Bedrooms
Room Capacity Insights for Chambon-sur-Lac
- The dominant room capacity in Chambon-sur-Lac is 2 bedrooms listings, making up 27.2% of the market. This suggests a strong demand for properties suitable for couples or solo travelers.
- Together, 2 bedrooms and 3 bedrooms properties represent 54.4% of the active Airbnb listings in Chambon-sur-Lac, indicating a high concentration in these sizes.
- A significant 52.2% of listings offer 3+ bedrooms, catering to larger groups and families seeking more space in Chambon-sur-Lac.
Chambon-sur-Lac Vacation Rental Guest Capacity Trends (2025)
Distribution of Listings by Guest Capacity
Guest Capacity Insights for Chambon-sur-Lac
- The most common guest capacity trend in Chambon-sur-Lac vacation rentals is listings accommodating 8+ guests (26.1%). This suggests the primary traveler segment is likely larger groups.
- Properties designed for 8+ guests and 6 guests dominate the Chambon-sur-Lac STR market, accounting for 48.9% of listings.
- 52.2% of properties accommodate 6+ guests, serving the market segment for larger families or group travel in Chambon-sur-Lac.
- On average, properties in Chambon-sur-Lac are equipped to host 5.4 guests.
Chambon-sur-Lac Airbnb Booking Patterns (2025): Available vs. Booked Days
Available Days Distribution
Booked Days Distribution
Booking Pattern Insights for Chambon-sur-Lac
- The most common availability pattern in Chambon-sur-Lac falls within the 181-270 days range, representing 38% of listings. This suggests many properties have significant open periods on their calendars.
- Approximately 71.7% of listings show high availability (181+ days open annually), indicating potential for increased bookings or specific owner usage patterns.
- For booked days, the 91-180 days range is most frequent in Chambon-sur-Lac (39.1%), reflecting common guest stay durations or potential owner blocking patterns.
- A notable 29.3% of properties secure long booking periods (181+ days booked per year), highlighting successful long-term rental strategies or significant owner usage.
Chambon-sur-Lac Airbnb Minimum Stay Requirements Analysis
Distribution of Listings by Minimum Night Requirement
1 Night
12 listings
13.2% of total
2 Nights
9 listings
9.9% of total
3 Nights
6 listings
6.6% of total
4-6 Nights
25 listings
27.5% of total
7-29 Nights
18 listings
19.8% of total
30+ Nights
21 listings
23.1% of total
Key Insights
- The most prevalent minimum stay requirement in Chambon-sur-Lac is 4-6 Nights, adopted by 27.5% of listings. This highlights the market's preference for longer commitments.
- A significant segment (23.1%) caters to monthly stays (30+ nights) in Chambon-sur-Lac, pointing to opportunities in the extended-stay market.
Recommendations
- Align with the market by considering a 4-6 Nights minimum stay, as 27.5% of Chambon-sur-Lac hosts use this setting.
- If feasible, allowing 1-night stays, especially midweek or during low season, could capture last-minute bookings, as only 13.2% currently do.
- Explore offering discounts for stays of 30+ nights to attract the 23.1% of the market seeking extended stays.
- Adjust minimum nights based on seasonality – potentially shorter during low season and longer during peak demand periods in Chambon-sur-Lac.
Chambon-sur-Lac Airbnb Cancellation Policy Trends Analysis (2025)
Super Strict 30 Days
5 listings
6.1% of total
Non-refundable
1 listings
1.2% of total
Refundable
2 listings
2.4% of total
Flexible
9 listings
11% of total
Moderate
12 listings
14.6% of total
Firm
40 listings
48.8% of total
Strict
13 listings
15.9% of total
Cancellation Policy Insights for Chambon-sur-Lac
- The prevailing Airbnb cancellation policy trend in Chambon-sur-Lac is Firm, used by 48.8% of listings.
- A majority (64.7%) of hosts in Chambon-sur-Lac utilize Firm or Strict policies, indicating a market where hosts prioritize booking security.
Recommendations for Hosts
- Consider adopting a Firm policy to align with the 48.8% market standard in Chambon-sur-Lac.
- Regularly review your cancellation policy against competitors and market demand shifts in Chambon-sur-Lac.
Chambon-sur-Lac STR Booking Lead Time Analysis (2025)
Average Booking Lead Time by Month
Booking Lead Time Insights for Chambon-sur-Lac
- The overall average booking lead time for vacation rentals in Chambon-sur-Lac is 64 days.
- Guests book furthest in advance for stays during July (average 124 days), likely coinciding with peak travel demand or local events.
- The shortest booking windows occur for stays in November (average 28 days), indicating more last-minute travel plans during this time.
- Seasonally, Summer (109 days avg.) sees the longest lead times, while Fall (48 days avg.) has the shortest, reflecting typical travel planning cycles.
Recommendations for Hosts
- Use the overall average lead time (64 days) as a baseline for your pricing and availability strategy in Chambon-sur-Lac.
- For July stays, consider implementing length-of-stay discounts or slightly higher rates for bookings made less than 124 days out to capitalize on advance planning.
- Target marketing efforts for the Summer season well in advance (at least 109 days) to capture early planners.
- Monitor your own booking lead times against these Chambon-sur-Lac averages to identify opportunities for dynamic pricing adjustments.
Popular & Essential Airbnb Amenities in Chambon-sur-Lac (2025)
Amenity Prevalence
Amenity Insights for Chambon-sur-Lac
- Popular amenities like Kitchen, Heating, Hot water are common but not universal. Offering these can provide a competitive edge.
Recommendations for Hosts
- Consider adding popular differentiators like Kitchen or Heating to increase appeal.
- Highlight unique or less common amenities you offer (e.g., hot tub, dedicated workspace, EV charger) in your listing description and photos.
- Regularly check competitor amenities in Chambon-sur-Lac to stay competitive.
Chambon-sur-Lac Airbnb Guest Demographics & Profile Analysis (2025)
Guest Profile Summary for Chambon-sur-Lac
- The typical guest profile for Airbnb in Chambon-sur-Lac consists of primarily domestic travelers (95%), often arriving from nearby Paris, typically belonging to the Post-2000s (Gen Z/Alpha) group (50%), primarily speaking French or English.
- Domestic travelers account for 95.3% of guests.
- Key international markets include France (95.3%) and Germany (1.1%).
- Top languages spoken are French (49.5%) followed by English (33.2%).
- A significant demographic segment is the Post-2000s (Gen Z/Alpha) group, representing 50% of guests.
Recommendations for Hosts
- Target domestic marketing efforts towards travelers from Paris and Lyon.
- Tailor amenities and listing descriptions to appeal to the dominant Post-2000s (Gen Z/Alpha) demographic (e.g., highlight fast WiFi, smart home features, local guides).
- Highlight unique local experiences or amenities relevant to the primary guest profile.
- Consider seasonal promotions aligned with peak travel times for key origin markets.
Nearby Short-Term Rental Market Comparison
How does the Chambon-sur-Lac Airbnb market stack up against its neighbors? Compare key performance metrics like average monthly revenue, ADR, and occupancy rates in surrounding areas to understand the broader regional STR landscape.
| Market | Active Properties | Monthly Revenue | Daily Rate | Avg. Occupancy |
|---|---|---|---|---|
| Saint-Pierre-Roche | 11 | $2,627 | $166.21 | 48% |
| Montaigut-le-Blanc | 15 | $2,546 | $163.70 | 47% |
| Jayac | 11 | $2,388 | $202.75 | 40% |
| Souvigny | 28 | $2,356 | $331.48 | 34% |
| Fléré-la-Rivière | 10 | $2,202 | $186.33 | 44% |
| Buzançais | 10 | $2,198 | $246.96 | 42% |
| Saint-Victor-la-Rivière | 20 | $2,031 | $144.59 | 44% |
| Isle | 18 | $2,016 | $174.75 | 44% |
| Miers | 17 | $1,988 | $176.91 | 46% |
| Varetz | 12 | $1,887 | $133.33 | 42% |