Bourdeaux Airbnb Market Analysis 2025: Short Term Rental Data & Vacation Rental Statistics in Auvergne-Rhône-Alpes, France
Is Airbnb profitable in Bourdeaux in 2025? Explore comprehensive Airbnb analytics for Bourdeaux, Auvergne-Rhône-Alpes, France to uncover income potential. This 2025 STR market report for Bourdeaux, based on AirROI data from April 2024 to March 2025, reveals key trends in the niche market of 19 active listings.
Whether you're considering an Airbnb investment in Bourdeaux, optimizing your existing vacation rental, or exploring rental arbitrage opportunities, understanding the Bourdeaux Airbnb data is crucial. Leveraging the low regulation environment is key to maximizing your short term rental income potential. Let's dive into the specifics.
Key Bourdeaux Airbnb Performance Metrics Overview
Monthly Airbnb Revenue Variations & Income Potential in Bourdeaux (2025)
Understanding the monthly revenue variations for Airbnb listings in Bourdeaux is key to maximizing your short term rental income potential. Seasonality significantly impacts earnings. Our analysis, based on data from the past 12 months, shows that the peak revenue month for STRs in Bourdeaux is typically December, while September often presents the lowest earnings, highlighting opportunities for strategic pricing adjustments during shoulder and low seasons. Explore the typical Airbnb income in Bourdeaux across different performance tiers:
- Best-in-class properties (Top 10%) achieve $7,508+ monthly, often utilizing dynamic pricing and superior guest experiences.
- Strong performing properties (Top 25%) earn $2,319 or more, indicating effective management and desirable locations/amenities.
- Typical properties (Median) generate around $1,107 per month, representing the average market performance.
- Entry-level properties (Bottom 25%) see earnings around $431, often with potential for optimization.
Average Monthly Airbnb Earnings Trend in Bourdeaux
Bourdeaux Airbnb Occupancy Rate Trends (2025)
Maximize your bookings by understanding the Bourdeaux STR occupancy trends. Seasonal demand shifts significantly influence how often properties are booked. Typically, Augustsees the highest demand (peak season occupancy), while February experiences the lowest (low season). Effective strategies, like adjusting minimum stays or offering promotions, can boost occupancy during slower periods. Here's how different property tiers perform in Bourdeaux:
- Best-in-class properties (Top 10%) achieve 69%+ occupancy, indicating high desirability and potentially optimized availability.
- Strong performing properties (Top 25%) maintain 46% or higher occupancy, suggesting good market fit and guest satisfaction.
- Typical properties (Median) have an occupancy rate around 25%.
- Entry-level properties (Bottom 25%) average 15% occupancy, potentially facing higher vacancy.
Average Monthly Occupancy Rate Trend in Bourdeaux
Average Daily Rate (ADR) Airbnb Trends in Bourdeaux (2025)
Effective short term rental pricing strategy in Bourdeaux involves understanding monthly ADR fluctuations. The Average Daily Rate (ADR) for Airbnb in Bourdeaux typically peaks in December and dips lowest during April. Leveraging Airbnb dynamic pricing tools or strategies based on this seasonality can significantly boost revenue. Here's a look at the typical nightly rates achieved:
- Best-in-class properties (Top 10%) command rates of $436+ per night, often due to premium features or locations.
- Strong performing properties (Top 25%) achieve nightly rates of $252 or more.
- Typical properties (Median) charge around $112 per night.
- Entry-level properties (Bottom 25%) earn around $81 per night.
Average Daily Rate (ADR) Trend by Month in Bourdeaux
Get Live Bourdeaux Market Intelligence 👇

Explore Real-time Analytics
Airbnb Seasonality Analysis & Trends in Bourdeaux (2025)
Peak Season (December, April, January)
- Revenue averages $3,524 per month
- Occupancy rates average 33.8%
- Daily rates average $196
Shoulder Season
- Revenue averages $2,622 per month
- Occupancy maintains around 37.3%
- Daily rates hold near $187
Low Season (February, September, October)
- Revenue drops to average $1,610 per month
- Occupancy decreases to average 26.1%
- Daily rates adjust to average $188
Seasonality Insights for Bourdeaux
- The Airbnb seasonality in Bourdeaux shows highly seasonal trends requiring careful strategy. While the sections above show seasonal averages, it's also insightful to look at the extremes:
- During the high season, the absolute peak month showcases Bourdeaux's highest earning potential, with monthly revenues capable of climbing to $3,959, occupancy reaching a high of 56.0%, and ADRs peaking at $208.
- Conversely, the slowest single month of the year, typically falling within the low season, marks the market's lowest point. In this month, revenue might dip to $1,539, occupancy could drop to 20.5%, and ADRs may adjust down to $178.
- Understanding both the seasonal averages and these monthly peaks and troughs in revenue, occupancy, and ADR is crucial for maximizing your Airbnb profit potential in Bourdeaux.
Seasonal Strategies for Maximizing Profit
- Peak Season: Maximize revenue through premium pricing and potentially longer minimum stays. Ensure high availability.
- Low Season: Offer competitive pricing, special promotions (e.g., extended stay discounts), and flexible cancellation policies. Target off-season travelers like remote workers or budget-conscious guests.
- Shoulder Seasons: Implement dynamic pricing that balances peak and low rates. Target weekend travelers or specific events. Offer slightly more flexible terms than peak season.
- Regularly analyze your own performance against these Bourdeaux seasonality benchmarks and adjust your pricing and availability strategy accordingly.
Best Areas for Airbnb Investment in Bourdeaux (2025)
Exploring the top neighborhoods for short-term rentals in Bourdeaux? This section highlights key areas, outlining why they are attractive for hosts and guests, along with notable local attractions. Consider these locations based on your target guest profile and investment strategy.
| Neighborhood / Area | Why Host Here? (Target Guests & Appeal) | Key Attractions & Landmarks |
|---|---|---|
| Saint-Pierre | Historic center of Bordeaux known for its vibrant atmosphere, narrow streets, and beautiful architecture. A favorite among tourists for its cafes, boutiques, and proximity to the Place de la Bourse. | Place de la Bourse, Miroir d'eau, Bordeaux Cathedral, Rue Sainte-Catherine, Palais Rohan, Darwin Ecosystem |
| Chartrons | Former wine merchant district, now a trendy area filled with art galleries, antique shops, and wine bars. Attractive to those looking for a more local experience with a variety of cultural activities. | Cité du Vin, Château de Brienne, Chartrons Market, Bordeaux Wine School, Quais de Bordeaux, Les Halles de Bacalan |
| Les Halles de Bacalan | A lively market area with a range of gourmet food stalls. Ideal for those who appreciate cuisine and local delicacies. It's a popular spot for food lovers and tourists. | Cité du Vin, Bassins à Flot, Les Halles de Bacalan Market, Quais de Bordeaux, Bordeaux Expo |
| Grands Hommes | An upscale area known for its elegant buildings and shopping options. It garners interest from travelers who enjoy luxury shopping and fine dining experiences. | Les Grands Hommes, Galleries Lafayette Bordeaux, Quinconces Square, Grand Théâtre de Bordeaux, Place Paul Doumer |
| Bordeaux Maritime | A developing area with a mix of residential and commercial properties. Offers opportunities for savvy investors as new developments continue to attract visitors. | Bordeaux River Cruise, Cité des Douanes, Parc Bordelais, Bordeaux Lac, Bordeaux Exhibition Center |
| Mériadeck | A commercial district now evolving with residential areas. Close to the city center and offers good transport links, appealing for both business and leisure stays. | Mériadeck Shopping Center, Bordeaux Convention Center, Place de la Réunion, Esplanade Charles de Gaulle, Bordeaux Opera |
| Saint-Augustin | A charming neighborhood that attracts families and longer-term stays due to its residential vibe and amenities. A good choice for hosts looking for a quieter area. | Parc Bordelais, Bordeaux Ecological Park, St. Augustine Church, Residential neighborhoods, Local bakeries and shops |
| Lac d'Occitanie | A recreational area with scenic lakes and outdoor activities, making it an appealing spot for nature lovers and tourists looking for a peaceful getaway. | Lac de Bordeaux, Sports complexes, Picnic areas, Walking paths, Bike trails |
Understanding Airbnb License Requirements & STR Laws in Bourdeaux (2025)
While Bourdeaux, Auvergne-Rhône-Alpes, France currently shows low STR regulations, specific Airbnb license requirements might still exist or change. Always verify the latest short term rental regulations and Airbnb license requirements directly with local government authorities for Bourdeaux to ensure full compliance before hosting.
(Source: AirROI data, 2025, finding no licensed listings among those analyzed)
Top Performing Airbnb Properties in Bourdeaux (2025)
Benchmark your potential! Explore examples of top-performing Airbnb properties in Bourdeauxbased on Trailing Twelve Month (TTM) revenue. Analyze their characteristics, revenue, occupancy rate, and ADR to understand what drives success in this market.

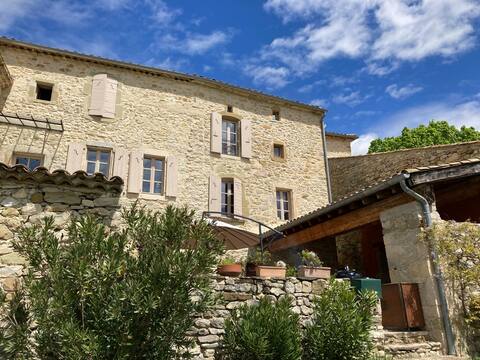
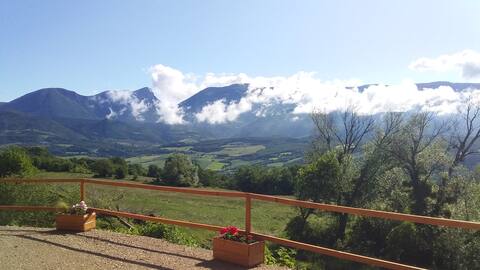
Beautiful home with exceptional views!
Entire Place • 6 bedrooms
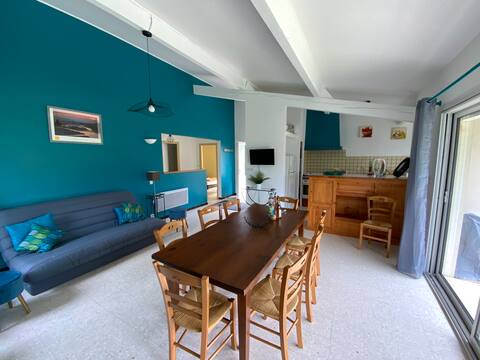
Les Nuits du Taris
Entire Place • 5 bedrooms
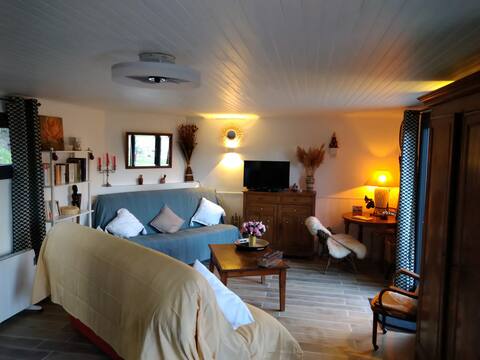
Gite du Grand Delmas
Entire Place • 4 bedrooms
Gîte le Plan Lara
Entire Place • 3 bedrooms
La p'tite Maiz in Co
Entire Place • N/A
Maison village Drô Provençale
Entire Place • 3 bedrooms
Note: Performance varies based on location, size, amenities, seasonality, and management quality. Data reflects the past 12 months.
Top Performing Airbnb Hosts in Bourdeaux (2025)
Learn from the best! This table showcases top-performing Airbnb hosts in Bourdeaux based on the number of properties managed and estimated total revenue over the past year. Analyze their scale and performance metrics.
| Host Name | Properties | Grossing Revenue | Stay Reviews | Avg Rating |
|---|---|---|---|---|
| Jean-Marc | 1 | $128,874 | 15 | 4.93/5.0 |
| Host #48453349 | 1 | $56,025 | 0 | 0.00/5.0 |
| Clara | 1 | $48,295 | 54 | 4.85/5.0 |
| Helene | 1 | $13,547 | 4 | 5.00/5.0 |
| Corinne | 1 | $12,663 | 7 | 5.00/5.0 |
| Christine | 2 | $10,540 | 13 | 4.90/5.0 |
| Hélène Et Alain | 2 | $9,971 | 52 | 4.90/5.0 |
| Gaston | 1 | $9,580 | 13 | 4.92/5.0 |
| Stéphanie | 1 | $7,578 | 90 | 4.79/5.0 |
| Host #247183710 | 1 | $7,324 | 0 | 0.00/5.0 |
Analyzing the strategies of top hosts, such as their property selection, pricing, and guest communication, can offer valuable lessons for optimizing your own Airbnb operations in Bourdeaux.
Dive Deeper: Advanced Bourdeaux STR Market Data (2025)
Ready to unlock more insights? AirROI provides access to advanced metrics and comprehensive Airbnb data for Bourdeaux. Explore detailed analytics beyond this report to refine your investment strategy, optimize pricing, and maximize your vacation rental profits.
Explore Advanced MetricsBourdeaux Short-Term Rental Market Composition (2025): Property & Room Types
Room Type Distribution
Property Type Distribution
Market Composition Insights for Bourdeaux
- The Bourdeaux Airbnb market composition is heavily skewed towards Entire Home/Apt listings, which make up 100% of the 19 active rentals. This indicates strong guest preference for privacy and space.
- Looking at the property type distribution in Bourdeaux, House properties are the most common (78.9%), reflecting the local real estate landscape.
- Houses represent a significant 78.9% portion, catering likely to families or larger groups.
- The presence of 5.3% Hotel/Boutique listings indicates integration with traditional hospitality.
Bourdeaux Airbnb Room Capacity Analysis (2025): Bedroom Distribution
Distribution of Listings by Number of Bedrooms
Room Capacity Insights for Bourdeaux
- The dominant room capacity in Bourdeaux is 3 bedrooms listings, making up 36.8% of the market. This suggests a strong demand for properties suitable for families or small groups.
- Together, 3 bedrooms and 2 bedrooms properties represent 57.9% of the active Airbnb listings in Bourdeaux, indicating a high concentration in these sizes.
- A significant 57.8% of listings offer 3+ bedrooms, catering to larger groups and families seeking more space in Bourdeaux.
Bourdeaux Vacation Rental Guest Capacity Trends (2025)
Distribution of Listings by Guest Capacity
Guest Capacity Insights for Bourdeaux
- The most common guest capacity trend in Bourdeaux vacation rentals is listings accommodating 6 guests (31.6%). This suggests the primary traveler segment is likely larger groups.
- Properties designed for 6 guests and 8+ guests dominate the Bourdeaux STR market, accounting for 63.2% of listings.
- 63.2% of properties accommodate 6+ guests, serving the market segment for larger families or group travel in Bourdeaux.
- On average, properties in Bourdeaux are equipped to host 5.8 guests.
Bourdeaux Airbnb Booking Patterns (2025): Available vs. Booked Days
Available Days Distribution
Booked Days Distribution
Booking Pattern Insights for Bourdeaux
- The most common availability pattern in Bourdeaux falls within the 271-366 days range, representing 57.9% of listings. This suggests many properties have significant open periods on their calendars.
- Approximately 94.7% of listings show high availability (181+ days open annually), indicating potential for increased bookings or specific owner usage patterns.
- For booked days, the 31-90 days range is most frequent in Bourdeaux (42.1%), reflecting common guest stay durations or potential owner blocking patterns.
- A notable 10.5% of properties secure long booking periods (181+ days booked per year), highlighting successful long-term rental strategies or significant owner usage.
Bourdeaux Airbnb Minimum Stay Requirements Analysis
Distribution of Listings by Minimum Night Requirement
1 Night
6 listings
31.6% of total
2 Nights
6 listings
31.6% of total
3 Nights
4 listings
21.1% of total
7-29 Nights
1 listings
5.3% of total
30+ Nights
2 listings
10.5% of total
Key Insights
- The most prevalent minimum stay requirement in Bourdeaux is 1 Night, adopted by 31.6% of listings. This highlights the market's preference for shorter, flexible bookings.
- A strong majority (63.2%) of the Bourdeaux Airbnb data shows acceptance of very short stays (1-2 nights), indicating a dynamic, high-turnover market.
- A significant segment (10.5%) caters to monthly stays (30+ nights) in Bourdeaux, pointing to opportunities in the extended-stay market.
Recommendations
- Align with the market by considering a 1 Night minimum stay, as 31.6% of Bourdeaux hosts use this setting.
- Explore offering discounts for stays of 30+ nights to attract the 10.5% of the market seeking extended stays.
- Adjust minimum nights based on seasonality – potentially shorter during low season and longer during peak demand periods in Bourdeaux.
Bourdeaux Airbnb Cancellation Policy Trends Analysis (2025)
Flexible
4 listings
25% of total
Moderate
1 listings
6.3% of total
Firm
6 listings
37.5% of total
Strict
5 listings
31.3% of total
Cancellation Policy Insights for Bourdeaux
- The prevailing Airbnb cancellation policy trend in Bourdeaux is Firm, used by 37.5% of listings.
- A majority (68.8%) of hosts in Bourdeaux utilize Firm or Strict policies, indicating a market where hosts prioritize booking security.
Recommendations for Hosts
- Consider adopting a Firm policy to align with the 37.5% market standard in Bourdeaux.
- With 31.3% using Strict terms, this is a viable option in Bourdeaux, particularly for high-value properties or during peak demand periods.
- Regularly review your cancellation policy against competitors and market demand shifts in Bourdeaux.
Bourdeaux STR Booking Lead Time Analysis (2025)
Average Booking Lead Time by Month
Booking Lead Time Insights for Bourdeaux
- The overall average booking lead time for vacation rentals in Bourdeaux is 57 days.
- Guests book furthest in advance for stays during August (average 81 days), likely coinciding with peak travel demand or local events.
- The shortest booking windows occur for stays in December (average 27 days), indicating more last-minute travel plans during this time.
- Seasonally, Summer (75 days avg.) sees the longest lead times, while Winter (36 days avg.) has the shortest, reflecting typical travel planning cycles.
Recommendations for Hosts
- Use the overall average lead time (57 days) as a baseline for your pricing and availability strategy in Bourdeaux.
- For August stays, consider implementing length-of-stay discounts or slightly higher rates for bookings made less than 81 days out to capitalize on advance planning.
- Target marketing efforts for the Summer season well in advance (at least 75 days) to capture early planners.
- Monitor your own booking lead times against these Bourdeaux averages to identify opportunities for dynamic pricing adjustments.
Popular & Essential Airbnb Amenities in Bourdeaux (2025)
Amenity Prevalence
Amenity Insights for Bourdeaux
- Essential amenities in Bourdeaux that guests expect include: Kitchen. Lacking these (this) could significantly impact bookings.
- Popular amenities like Heating, Coffee maker, Cooking basics are common but not universal. Offering these can provide a competitive edge.
- Warning: Wifi is not universally provided but is considered essential globally. Ensure reliable Wifi is offered.
Recommendations for Hosts
- Ensure your listing includes all essential amenities for Bourdeaux: Kitchen.
- Consider adding popular differentiators like Heating or Coffee maker to increase appeal.
- Highlight unique or less common amenities you offer (e.g., hot tub, dedicated workspace, EV charger) in your listing description and photos.
- Regularly check competitor amenities in Bourdeaux to stay competitive.
Bourdeaux Airbnb Guest Demographics & Profile Analysis (2025)
Guest Profile Summary for Bourdeaux
- The typical guest profile for Airbnb in Bourdeaux consists of primarily domestic travelers (87%), often arriving from nearby Lyon, typically belonging to the Post-2000s (Gen Z/Alpha) group (50%), primarily speaking French or English.
- Domestic travelers account for 86.5% of guests.
- Key international markets include France (86.5%) and Belgium (3.6%).
- Top languages spoken are French (40.7%) followed by English (36%).
- A significant demographic segment is the Post-2000s (Gen Z/Alpha) group, representing 50% of guests.
Recommendations for Hosts
- Target domestic marketing efforts towards travelers from Lyon and Grenoble.
- Tailor amenities and listing descriptions to appeal to the dominant Post-2000s (Gen Z/Alpha) demographic (e.g., highlight fast WiFi, smart home features, local guides).
- Highlight unique local experiences or amenities relevant to the primary guest profile.
- Consider seasonal promotions aligned with peak travel times for key origin markets.
Nearby Short-Term Rental Market Comparison
How does the Bourdeaux Airbnb market stack up against its neighbors? Compare key performance metrics like average monthly revenue, ADR, and occupancy rates in surrounding areas to understand the broader regional STR landscape.
| Market | Active Properties | Monthly Revenue | Daily Rate | Avg. Occupancy |
|---|---|---|---|---|
| Les Clefs | 30 | $5,741 | $323.11 | 44% |
| Manigod | 194 | $4,127 | $427.80 | 40% |
| Divajeu | 19 | $3,941 | $410.65 | 42% |
| Saint-Germain-au-Mont-d'Or | 10 | $3,928 | $316.02 | 40% |
| Dommartin | 11 | $3,905 | $327.00 | 36% |
| Ramatuelle | 213 | $3,891 | $670.10 | 41% |
| Saint-Tropez | 742 | $3,498 | $506.57 | 41% |
| Saint-Nicolas-la-Chapelle | 27 | $3,381 | $375.70 | 43% |
| Courzieu | 11 | $3,267 | $287.83 | 52% |
| Charvonnex | 11 | $3,212 | $228.03 | 56% |