Anse Airbnb Market Analysis 2025: Short Term Rental Data & Vacation Rental Statistics in Auvergne-Rhône-Alpes, France
Is Airbnb profitable in Anse in 2025? Explore comprehensive Airbnb analytics for Anse, Auvergne-Rhône-Alpes, France to uncover income potential. This 2025 STR market report for Anse, based on AirROI data from April 2024 to March 2025, reveals key trends in the niche market of 23 active listings.
Whether you're considering an Airbnb investment in Anse, optimizing your existing vacation rental, or exploring rental arbitrage opportunities, understanding the Anse Airbnb data is crucial. Leveraging the low regulation environment is key to maximizing your short term rental income potential. Let's dive into the specifics.
Key Anse Airbnb Performance Metrics Overview
Monthly Airbnb Revenue Variations & Income Potential in Anse (2025)
Understanding the monthly revenue variations for Airbnb listings in Anse is key to maximizing your short term rental income potential. Seasonality significantly impacts earnings. Our analysis, based on data from the past 12 months, shows that the peak revenue month for STRs in Anse is typically April, while March often presents the lowest earnings, highlighting opportunities for strategic pricing adjustments during shoulder and low seasons. Explore the typical Airbnb income in Anse across different performance tiers:
- Best-in-class properties (Top 10%) achieve $3,130+ monthly, often utilizing dynamic pricing and superior guest experiences.
- Strong performing properties (Top 25%) earn $2,017 or more, indicating effective management and desirable locations/amenities.
- Typical properties (Median) generate around $1,212 per month, representing the average market performance.
- Entry-level properties (Bottom 25%) see earnings around $766, often with potential for optimization.
Average Monthly Airbnb Earnings Trend in Anse
Anse Airbnb Occupancy Rate Trends (2025)
Maximize your bookings by understanding the Anse STR occupancy trends. Seasonal demand shifts significantly influence how often properties are booked. Typically, Maysees the highest demand (peak season occupancy), while January experiences the lowest (low season). Effective strategies, like adjusting minimum stays or offering promotions, can boost occupancy during slower periods. Here's how different property tiers perform in Anse:
- Best-in-class properties (Top 10%) achieve 77%+ occupancy, indicating high desirability and potentially optimized availability.
- Strong performing properties (Top 25%) maintain 63% or higher occupancy, suggesting good market fit and guest satisfaction.
- Typical properties (Median) have an occupancy rate around 50%.
- Entry-level properties (Bottom 25%) average 32% occupancy, potentially facing higher vacancy.
Average Monthly Occupancy Rate Trend in Anse
Average Daily Rate (ADR) Airbnb Trends in Anse (2025)
Effective short term rental pricing strategy in Anse involves understanding monthly ADR fluctuations. The Average Daily Rate (ADR) for Airbnb in Anse typically peaks in July and dips lowest during February. Leveraging Airbnb dynamic pricing tools or strategies based on this seasonality can significantly boost revenue. Here's a look at the typical nightly rates achieved:
- Best-in-class properties (Top 10%) command rates of $208+ per night, often due to premium features or locations.
- Strong performing properties (Top 25%) achieve nightly rates of $100 or more.
- Typical properties (Median) charge around $73 per night.
- Entry-level properties (Bottom 25%) earn around $61 per night.
Average Daily Rate (ADR) Trend by Month in Anse
Get Live Anse Market Intelligence 👇

Explore Real-time Analytics
Airbnb Seasonality Analysis & Trends in Anse (2025)
Peak Season (April, May, June)
- Revenue averages $2,383 per month
- Occupancy rates average 60.2%
- Daily rates average $97
Shoulder Season
- Revenue averages $1,606 per month
- Occupancy maintains around 49.1%
- Daily rates hold near $96
Low Season (January, February, March)
- Revenue drops to average $997 per month
- Occupancy decreases to average 34.9%
- Daily rates adjust to average $94
Seasonality Insights for Anse
- The Airbnb seasonality in Anse shows highly seasonal trends requiring careful strategy. While the sections above show seasonal averages, it's also insightful to look at the extremes:
- During the high season, the absolute peak month showcases Anse's highest earning potential, with monthly revenues capable of climbing to $2,425, occupancy reaching a high of 65.4%, and ADRs peaking at $98.
- Conversely, the slowest single month of the year, typically falling within the low season, marks the market's lowest point. In this month, revenue might dip to $915, occupancy could drop to 33.7%, and ADRs may adjust down to $94.
- Understanding both the seasonal averages and these monthly peaks and troughs in revenue, occupancy, and ADR is crucial for maximizing your Airbnb profit potential in Anse.
Seasonal Strategies for Maximizing Profit
- Peak Season: Maximize revenue through premium pricing and potentially longer minimum stays. Ensure high availability.
- Low Season: Offer competitive pricing, special promotions (e.g., extended stay discounts), and flexible cancellation policies. Target off-season travelers like remote workers or budget-conscious guests.
- Shoulder Seasons: Implement dynamic pricing that balances peak and low rates. Target weekend travelers or specific events. Offer slightly more flexible terms than peak season.
- Regularly analyze your own performance against these Anse seasonality benchmarks and adjust your pricing and availability strategy accordingly.
Best Areas for Airbnb Investment in Anse (2025)
Exploring the top neighborhoods for short-term rentals in Anse? This section highlights key areas, outlining why they are attractive for hosts and guests, along with notable local attractions. Consider these locations based on your target guest profile and investment strategy.
| Neighborhood / Area | Why Host Here? (Target Guests & Appeal) | Key Attractions & Landmarks |
|---|---|---|
| Lac d'Annecy | Stunning alpine lake with crystal clear waters ideal for outdoor activities like swimming, boating, and hiking. Popular with tourists for its picturesque views and charming lakeside towns. | Palace of Isle, Annecy Castle, Lake Annecy, Bicycling around the lake, Outdoor markets |
| Chamonix-Mont-Blanc | World-famous ski resort located at the foot of Mont Blanc. Attracts winter sports enthusiasts and hikers year-round, making it a prime location for Airbnb stays. | Mont Blanc, Aiguille du Midi, Chamonix ski resorts, Mer de Glace, Alpine hiking trails |
| Grenoble | A vibrant university city surrounded by mountains, known for its cultural events and outdoor sports. Renowned for its traditional architecture and lively student population. | Museum of Grenoble, Bastille Hill, La Caserne de Bonne, Parc Paul Mistral, Cultural festivals |
| Saint-Étienne | Former industrial hub now revitalized with a focus on culture and technology. Affordable property prices make it attractive for investing in rental properties. | Cité du Design, Saint-Étienne Museum of Modern Art, Parc Naturel Régional du Pilat, Golf courses, Historic industrial architecture |
| Val Thorens | Highest ski resort in Europe offering excellent skiing conditions and a vibrant après-ski scene. Perfect for attracting winter tourists. | Ski slopes, Après-ski bars, Spa centers, Les Trois Vallées ski area, Winter sports activities |
| Isère Valley | Known for its beautiful natural landscape and outdoor sports. A growing destination for hikers and nature lovers. | Vercors Regional Natural Park, Chartreuse mountains, Outdoor sports trails, Caves of La Chartreuse, Local vineyards |
| Albertville | Host city of the 1992 Winter Olympics, offering historical significance and proximity to ski resorts and tourist spots. | Historical Olympic sites, Castle of Conflans, Cycle routes, Alpine ski resorts, Local cultural festivals |
| Annecy-le-Vieux | Lakeside commune of Annecy known for its beautiful scenery and calm environment. Attracts families and tourists looking for a peaceful retreat. | Beach resorts, Cycling paths, Lakeside dining, Nature parks, Cultural heritage sites |
Understanding Airbnb License Requirements & STR Laws in Anse (2025)
While Anse, Auvergne-Rhône-Alpes, France currently shows low STR regulations, specific Airbnb license requirements might still exist or change. Always verify the latest short term rental regulations and Airbnb license requirements directly with local government authorities for Anse to ensure full compliance before hosting.
(Source: AirROI data, 2025, based on 4% licensed listings)
Top Performing Airbnb Properties in Anse (2025)
Benchmark your potential! Explore examples of top-performing Airbnb properties in Ansebased on Trailing Twelve Month (TTM) revenue. Analyze their characteristics, revenue, occupancy rate, and ADR to understand what drives success in this market.
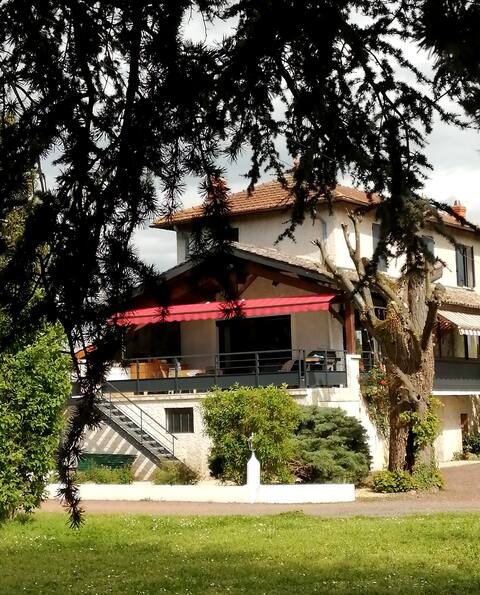
House by the Lake
Entire Place • 3 bedrooms

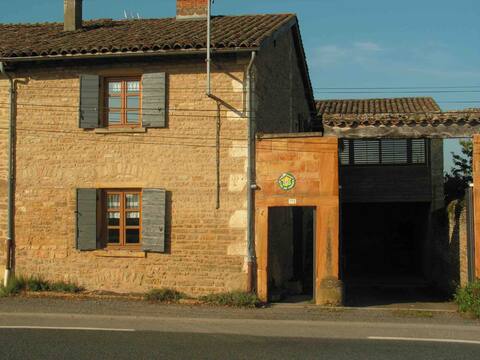
Sweet cottage with an amazing view
Entire Place • 2 bedrooms
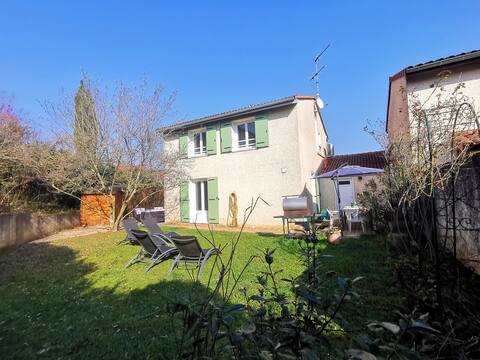
Family home at the gates of Beaujolais
Entire Place • 4 bedrooms
Perfect base from which
Entire Place • 3 bedrooms
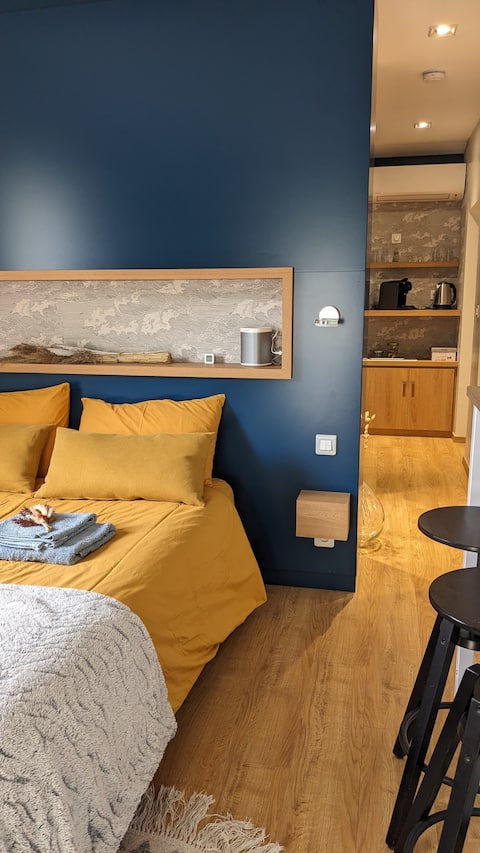
Let's explore Beaujolais : room and swimming-pool
Private Room • 1 bedroom

Ground floor apartment Type T3 - Anse
Entire Place • 2 bedrooms
Note: Performance varies based on location, size, amenities, seasonality, and management quality. Data reflects the past 12 months.
Top Performing Airbnb Hosts in Anse (2025)
Learn from the best! This table showcases top-performing Airbnb hosts in Anse based on the number of properties managed and estimated total revenue over the past year. Analyze their scale and performance metrics.
| Host Name | Properties | Grossing Revenue | Stay Reviews | Avg Rating |
|---|---|---|---|---|
| Annie-Pierrette | 1 | $69,009 | 36 | 4.97/5.0 |
| Olivier | 5 | $46,683 | 108 | 4.78/5.0 |
| Annabelle | 1 | $42,218 | 226 | 4.91/5.0 |
| Frederic | 1 | $29,782 | 54 | 4.91/5.0 |
| Martine | 1 | $21,495 | 25 | 4.96/5.0 |
| Xavier | 1 | $21,046 | 26 | 4.88/5.0 |
| Maria | 1 | $19,926 | 206 | 4.90/5.0 |
| Marion | 1 | $16,831 | 218 | 4.99/5.0 |
| Mylène | 1 | $16,416 | 123 | 4.89/5.0 |
| Myriam | 1 | $14,593 | 14 | 4.79/5.0 |
Analyzing the strategies of top hosts, such as their property selection, pricing, and guest communication, can offer valuable lessons for optimizing your own Airbnb operations in Anse.
Dive Deeper: Advanced Anse STR Market Data (2025)
Ready to unlock more insights? AirROI provides access to advanced metrics and comprehensive Airbnb data for Anse. Explore detailed analytics beyond this report to refine your investment strategy, optimize pricing, and maximize your vacation rental profits.
Explore Advanced MetricsAnse Short-Term Rental Market Composition (2025): Property & Room Types
Room Type Distribution
Property Type Distribution
Market Composition Insights for Anse
- The Anse Airbnb market composition is heavily skewed towards Entire Home/Apt listings, which make up 78.3% of the 23 active rentals. This indicates strong guest preference for privacy and space.
- Looking at the property type distribution in Anse, House properties are the most common (47.8%), reflecting the local real estate landscape.
- Houses represent a significant 47.8% portion, catering likely to families or larger groups.
- The presence of 8.7% Hotel/Boutique listings indicates integration with traditional hospitality.
Anse Airbnb Room Capacity Analysis (2025): Bedroom Distribution
Distribution of Listings by Number of Bedrooms
Room Capacity Insights for Anse
- The dominant room capacity in Anse is 1 bedroom listings, making up 47.8% of the market. This suggests a strong demand for properties suitable for couples or solo travelers.
- Together, 1 bedroom and 2 bedrooms properties represent 65.2% of the active Airbnb listings in Anse, indicating a high concentration in these sizes.
Anse Vacation Rental Guest Capacity Trends (2025)
Distribution of Listings by Guest Capacity
Guest Capacity Insights for Anse
- The most common guest capacity trend in Anse vacation rentals is listings accommodating 4 guests (39.1%). This suggests the primary traveler segment is likely small families or groups.
- Properties designed for 4 guests and 6 guests dominate the Anse STR market, accounting for 52.1% of listings.
- 21.7% of properties accommodate 6+ guests, serving the market segment for larger families or group travel in Anse.
- On average, properties in Anse are equipped to host 3.9 guests.
Anse Airbnb Booking Patterns (2025): Available vs. Booked Days
Available Days Distribution
Booked Days Distribution
Booking Pattern Insights for Anse
- The most common availability pattern in Anse falls within the 181-270 days range, representing 34.8% of listings. This suggests many properties have significant open periods on their calendars.
- Approximately 60.9% of listings show high availability (181+ days open annually), indicating potential for increased bookings or specific owner usage patterns.
- For booked days, the 91-180 days range is most frequent in Anse (34.8%), reflecting common guest stay durations or potential owner blocking patterns.
- A notable 39.1% of properties secure long booking periods (181+ days booked per year), highlighting successful long-term rental strategies or significant owner usage.
Anse Airbnb Minimum Stay Requirements Analysis
Distribution of Listings by Minimum Night Requirement
1 Night
13 listings
59.1% of total
2 Nights
6 listings
27.3% of total
4-6 Nights
2 listings
9.1% of total
30+ Nights
1 listings
4.5% of total
Key Insights
- The most prevalent minimum stay requirement in Anse is 1 Night, adopted by 59.1% of listings. This highlights the market's preference for shorter, flexible bookings.
- A strong majority (86.4%) of the Anse Airbnb data shows acceptance of very short stays (1-2 nights), indicating a dynamic, high-turnover market.
Recommendations
- Align with the market by considering a 1 Night minimum stay, as 59.1% of Anse hosts use this setting.
- Adjust minimum nights based on seasonality – potentially shorter during low season and longer during peak demand periods in Anse.
Anse Airbnb Cancellation Policy Trends Analysis (2025)
Flexible
4 listings
20% of total
Moderate
13 listings
65% of total
Firm
3 listings
15% of total
Cancellation Policy Insights for Anse
- The prevailing Airbnb cancellation policy trend in Anse is Moderate, used by 65% of listings.
- The market strongly favors guest-friendly terms, with 85.0% of listings offering Flexible or Moderate policies. This suggests guests in Anse may expect booking flexibility.
Recommendations for Hosts
- Consider adopting a Moderate policy to align with the 65% market standard in Anse.
- Regularly review your cancellation policy against competitors and market demand shifts in Anse.
Anse STR Booking Lead Time Analysis (2025)
Average Booking Lead Time by Month
Booking Lead Time Insights for Anse
- The overall average booking lead time for vacation rentals in Anse is 37 days.
- Guests book furthest in advance for stays during June (average 101 days), likely coinciding with peak travel demand or local events.
- The shortest booking windows occur for stays in October (average 30 days), indicating more last-minute travel plans during this time.
- Seasonally, Summer (72 days avg.) sees the longest lead times, while Winter (31 days avg.) has the shortest, reflecting typical travel planning cycles.
Recommendations for Hosts
- Use the overall average lead time (37 days) as a baseline for your pricing and availability strategy in Anse.
- For June stays, consider implementing length-of-stay discounts or slightly higher rates for bookings made less than 101 days out to capitalize on advance planning.
- Target marketing efforts for the Summer season well in advance (at least 72 days) to capture early planners.
- Monitor your own booking lead times against these Anse averages to identify opportunities for dynamic pricing adjustments.
Popular & Essential Airbnb Amenities in Anse (2025)
Amenity Prevalence
Amenity Insights for Anse
- Essential amenities in Anse that guests expect include: Smoke alarm, TV, Wifi, Heating. Lacking these (any) could significantly impact bookings.
- Popular amenities like Hair dryer, Kitchen, Hot water are common but not universal. Offering these can provide a competitive edge.
Recommendations for Hosts
- Ensure your listing includes all essential amenities for Anse: Smoke alarm, TV, Wifi, Heating.
- Prioritize adding missing essentials: Wifi, Heating.
- Consider adding popular differentiators like Hair dryer or Kitchen to increase appeal.
- Highlight unique or less common amenities you offer (e.g., hot tub, dedicated workspace, EV charger) in your listing description and photos.
- Regularly check competitor amenities in Anse to stay competitive.
Anse Airbnb Guest Demographics & Profile Analysis (2025)
Guest Profile Summary for Anse
- The typical guest profile for Airbnb in Anse consists of primarily domestic travelers (75%), often arriving from nearby Lyon, typically belonging to the Post-2000s (Gen Z/Alpha) group (50%), primarily speaking French or English.
- Domestic travelers account for 75.3% of guests.
- Key international markets include France (75.3%) and Netherlands (5.6%).
- Top languages spoken are French (37.6%) followed by English (33.8%).
- A significant demographic segment is the Post-2000s (Gen Z/Alpha) group, representing 50% of guests.
Recommendations for Hosts
- Target domestic marketing efforts towards travelers from Lyon and Paris.
- Tailor amenities and listing descriptions to appeal to the dominant Post-2000s (Gen Z/Alpha) demographic (e.g., highlight fast WiFi, smart home features, local guides).
- Highlight unique local experiences or amenities relevant to the primary guest profile.
- Consider seasonal promotions aligned with peak travel times for key origin markets.
Nearby Short-Term Rental Market Comparison
How does the Anse Airbnb market stack up against its neighbors? Compare key performance metrics like average monthly revenue, ADR, and occupancy rates in surrounding areas to understand the broader regional STR landscape.
| Market | Active Properties | Monthly Revenue | Daily Rate | Avg. Occupancy |
|---|---|---|---|---|
| Épinac | 14 | $5,147 | $333.01 | 37% |
| Divajeu | 19 | $3,941 | $410.65 | 42% |
| Saint-Germain-au-Mont-d'Or | 10 | $3,928 | $316.02 | 40% |
| Puligny-Montrachet | 11 | $3,908 | $398.00 | 44% |
| Dommartin | 11 | $3,905 | $327.00 | 36% |
| Juliénas | 11 | $3,378 | $292.32 | 46% |
| Courzieu | 11 | $3,267 | $287.83 | 52% |
| Vanosc | 13 | $3,072 | $224.52 | 44% |
| Chantepérier | 20 | $3,057 | $281.60 | 37% |
| Bligny-lès-Beaune | 24 | $2,930 | $233.89 | 44% |