Ambert Airbnb Market Analysis 2025: Short Term Rental Data & Vacation Rental Statistics in Auvergne-Rhône-Alpes, France
Is Airbnb profitable in Ambert in 2025? Explore comprehensive Airbnb analytics for Ambert, Auvergne-Rhône-Alpes, France to uncover income potential. This 2025 STR market report for Ambert, based on AirROI data from April 2024 to March 2025, reveals key trends in the niche market of 26 active listings.
Whether you're considering an Airbnb investment in Ambert, optimizing your existing vacation rental, or exploring rental arbitrage opportunities, understanding the Ambert Airbnb data is crucial. Leveraging the low regulation environment is key to maximizing your short term rental income potential. Let's dive into the specifics.
Key Ambert Airbnb Performance Metrics Overview
Monthly Airbnb Revenue Variations & Income Potential in Ambert (2025)
Understanding the monthly revenue variations for Airbnb listings in Ambert is key to maximizing your short term rental income potential. Seasonality significantly impacts earnings. Our analysis, based on data from the past 12 months, shows that the peak revenue month for STRs in Ambert is typically January, while March often presents the lowest earnings, highlighting opportunities for strategic pricing adjustments during shoulder and low seasons. Explore the typical Airbnb income in Ambert across different performance tiers:
- Best-in-class properties (Top 10%) achieve $2,898+ monthly, often utilizing dynamic pricing and superior guest experiences.
- Strong performing properties (Top 25%) earn $1,378 or more, indicating effective management and desirable locations/amenities.
- Typical properties (Median) generate around $817 per month, representing the average market performance.
- Entry-level properties (Bottom 25%) see earnings around $406, often with potential for optimization.
Average Monthly Airbnb Earnings Trend in Ambert
Ambert Airbnb Occupancy Rate Trends (2025)
Maximize your bookings by understanding the Ambert STR occupancy trends. Seasonal demand shifts significantly influence how often properties are booked. Typically, Augustsees the highest demand (peak season occupancy), while March experiences the lowest (low season). Effective strategies, like adjusting minimum stays or offering promotions, can boost occupancy during slower periods. Here's how different property tiers perform in Ambert:
- Best-in-class properties (Top 10%) achieve 79%+ occupancy, indicating high desirability and potentially optimized availability.
- Strong performing properties (Top 25%) maintain 62% or higher occupancy, suggesting good market fit and guest satisfaction.
- Typical properties (Median) have an occupancy rate around 38%.
- Entry-level properties (Bottom 25%) average 20% occupancy, potentially facing higher vacancy.
Average Monthly Occupancy Rate Trend in Ambert
Average Daily Rate (ADR) Airbnb Trends in Ambert (2025)
Effective short term rental pricing strategy in Ambert involves understanding monthly ADR fluctuations. The Average Daily Rate (ADR) for Airbnb in Ambert typically peaks in July and dips lowest during March. Leveraging Airbnb dynamic pricing tools or strategies based on this seasonality can significantly boost revenue. Here's a look at the typical nightly rates achieved:
- Best-in-class properties (Top 10%) command rates of $201+ per night, often due to premium features or locations.
- Strong performing properties (Top 25%) achieve nightly rates of $87 or more.
- Typical properties (Median) charge around $63 per night.
- Entry-level properties (Bottom 25%) earn around $51 per night.
Average Daily Rate (ADR) Trend by Month in Ambert
Get Live Ambert Market Intelligence 👇

Explore Real-time Analytics
Airbnb Seasonality Analysis & Trends in Ambert (2025)
Peak Season (January, July, August)
- Revenue averages $1,655 per month
- Occupancy rates average 52.5%
- Daily rates average $95
Shoulder Season
- Revenue averages $1,271 per month
- Occupancy maintains around 40.4%
- Daily rates hold near $92
Low Season (February, March, April)
- Revenue drops to average $784 per month
- Occupancy decreases to average 35.8%
- Daily rates adjust to average $86
Seasonality Insights for Ambert
- The Airbnb seasonality in Ambert shows highly seasonal trends requiring careful strategy. While the sections above show seasonal averages, it's also insightful to look at the extremes:
- During the high season, the absolute peak month showcases Ambert's highest earning potential, with monthly revenues capable of climbing to $1,904, occupancy reaching a high of 56.3%, and ADRs peaking at $100.
- Conversely, the slowest single month of the year, typically falling within the low season, marks the market's lowest point. In this month, revenue might dip to $617, occupancy could drop to 32.1%, and ADRs may adjust down to $80.
- Understanding both the seasonal averages and these monthly peaks and troughs in revenue, occupancy, and ADR is crucial for maximizing your Airbnb profit potential in Ambert.
Seasonal Strategies for Maximizing Profit
- Peak Season: Maximize revenue through premium pricing and potentially longer minimum stays. Ensure high availability.
- Low Season: Offer competitive pricing, special promotions (e.g., extended stay discounts), and flexible cancellation policies. Target off-season travelers like remote workers or budget-conscious guests.
- Shoulder Seasons: Implement dynamic pricing that balances peak and low rates. Target weekend travelers or specific events. Offer slightly more flexible terms than peak season.
- Regularly analyze your own performance against these Ambert seasonality benchmarks and adjust your pricing and availability strategy accordingly.
Best Areas for Airbnb Investment in Ambert (2025)
Exploring the top neighborhoods for short-term rentals in Ambert? This section highlights key areas, outlining why they are attractive for hosts and guests, along with notable local attractions. Consider these locations based on your target guest profile and investment strategy.
| Neighborhood / Area | Why Host Here? (Target Guests & Appeal) | Key Attractions & Landmarks |
|---|---|---|
| Historic Center of Ambert | The historic center boasts medieval architecture and a charming atmosphere, making it appealing to tourists interested in culture and history. | Ambert Museum of Leather, Saint-Jean Chapel, Ombleze River, Place de la République, local artisans and shops |
| Chateau d'Ambert | This picturesque chateau offers stunning views and is a popular attraction for visitors to the region, making it a desirable location for short-term rentals. | Chateau d'Ambert, parkland surrounding the chateau, guided tours, historical reenactments |
| Monts du Livradois Forest | This natural park offers outdoor activities such as hiking and camping, attracting nature lovers and adventure seekers to the area. | hiking trails, breathtaking landscapes, wildlife spotting, outdoor sports activities |
| Puy de Dôme | Nearby volcanic mountains are a draw for tourists who want to explore the natural beauty and engage in activities like climbing and photography. | Puy de Dôme summit, Panoramique des Dômes train, Auzon Valley, Château de Murol |
| Local Markets | Ambert is known for its vibrant local markets, where visitors can experience regional products and traditional French culture first-hand. | Ambert Market on Saturdays, local cheeses and meats, handcrafted goods, live music events |
| Nearby Villages | The surrounding villages like La Chaise-Dieu and Thiers offer a quaint experience with rural charm and local attractions. | La Chaise-Dieu Abbey, Thiers Knife Museum, scenic drives, traditional festivals |
| Cultural Festivals | Ambert hosts cultural events and festivals year-round that draw visitors and create a vibrant atmosphere. | Ambert Music Festival, local art exhibitions, wine and gastronomy festivals, theatre performances |
| Cycling Routes | The region offers scenic cycling routes that attract biking enthusiasts, making it a great spot for active tourists. | cycling tours, beautiful countryside, Cycling Pathways, bike rentals, annual cycling events |
Understanding Airbnb License Requirements & STR Laws in Ambert (2025)
While Ambert, Auvergne-Rhône-Alpes, France currently shows low STR regulations, specific Airbnb license requirements might still exist or change. Always verify the latest short term rental regulations and Airbnb license requirements directly with local government authorities for Ambert to ensure full compliance before hosting.
(Source: AirROI data, 2025, based on 4% licensed listings)
Top Performing Airbnb Properties in Ambert (2025)
Benchmark your potential! Explore examples of top-performing Airbnb properties in Ambertbased on Trailing Twelve Month (TTM) revenue. Analyze their characteristics, revenue, occupancy rate, and ADR to understand what drives success in this market.
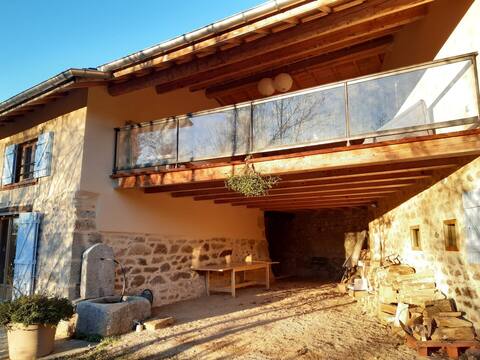
Grande ferme du Forez
Entire Place • 8 bedrooms

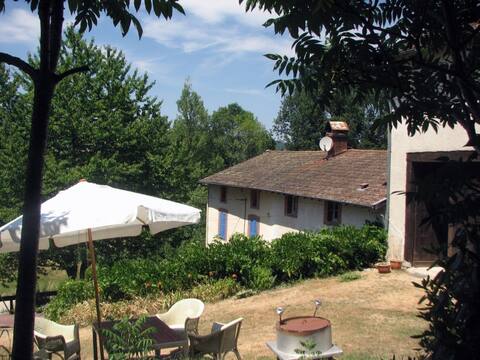
Stunning group house with billiards /foosball
Entire Place • 7 bedrooms
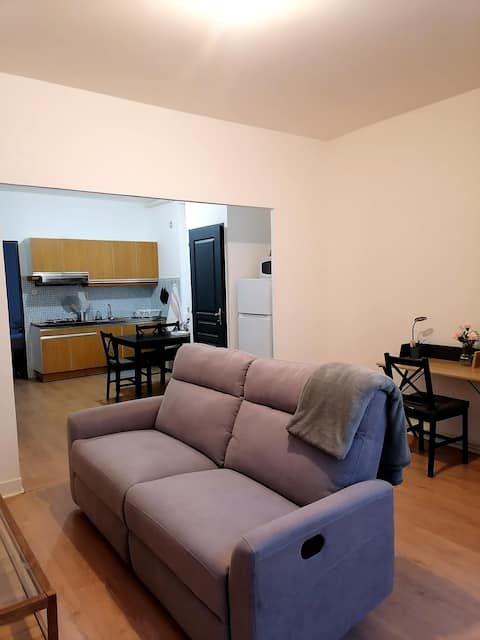
Family apartment plain country side Ambert
Entire Place • 2 bedrooms
Apartment in the heart of Ambert.
Entire Place • 1 bedroom

Pretty F2 Ambert center
Entire Place • 1 bedroom
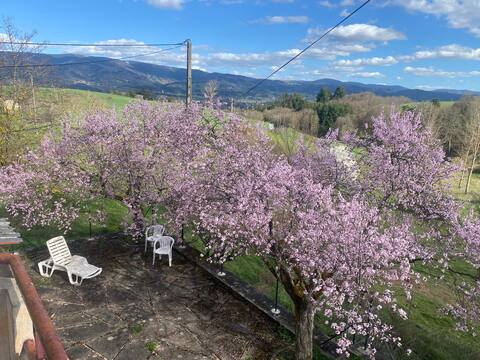
House with beautiful views of the Forez mountains
Entire Place • 1 bedroom
Note: Performance varies based on location, size, amenities, seasonality, and management quality. Data reflects the past 12 months.
Top Performing Airbnb Hosts in Ambert (2025)
Learn from the best! This table showcases top-performing Airbnb hosts in Ambert based on the number of properties managed and estimated total revenue over the past year. Analyze their scale and performance metrics.
| Host Name | Properties | Grossing Revenue | Stay Reviews | Avg Rating |
|---|---|---|---|---|
| Thomas | 1 | $61,625 | 7 | 5.00/5.0 |
| Gerard | 1 | $43,891 | 45 | 4.98/5.0 |
| Jean-Paul | 4 | $15,834 | 25 | 3.64/5.0 |
| Ron | 1 | $14,825 | 48 | 4.73/5.0 |
| SciJv | 2 | $14,712 | 51 | 2.41/5.0 |
| Raphaelle | 1 | $14,440 | 69 | 4.86/5.0 |
| Fabienne | 1 | $14,155 | 17 | 5.00/5.0 |
| Sam Et Marion | 1 | $13,996 | 26 | 4.92/5.0 |
| Audrey Et Anthony | 1 | $10,076 | 30 | 4.97/5.0 |
| Host #188522868 | 1 | $9,505 | 5 | 4.40/5.0 |
Analyzing the strategies of top hosts, such as their property selection, pricing, and guest communication, can offer valuable lessons for optimizing your own Airbnb operations in Ambert.
Dive Deeper: Advanced Ambert STR Market Data (2025)
Ready to unlock more insights? AirROI provides access to advanced metrics and comprehensive Airbnb data for Ambert. Explore detailed analytics beyond this report to refine your investment strategy, optimize pricing, and maximize your vacation rental profits.
Explore Advanced MetricsAmbert Short-Term Rental Market Composition (2025): Property & Room Types
Room Type Distribution
Property Type Distribution
Market Composition Insights for Ambert
- The Ambert Airbnb market composition is heavily skewed towards Entire Home/Apt listings, which make up 92.3% of the 26 active rentals. This indicates strong guest preference for privacy and space.
- Looking at the property type distribution in Ambert, Apartment/Condo properties are the most common (57.7%), reflecting the local real estate landscape.
- Houses represent a significant 34.6% portion, catering likely to families or larger groups.
- Smaller segments like unique stays, hotel/boutique (combined 7.6%) offer potential for unique stay experiences.
Ambert Airbnb Room Capacity Analysis (2025): Bedroom Distribution
Distribution of Listings by Number of Bedrooms
Room Capacity Insights for Ambert
- The dominant room capacity in Ambert is 1 bedroom listings, making up 53.8% of the market. This suggests a strong demand for properties suitable for couples or solo travelers.
- Together, 1 bedroom and 2 bedrooms properties represent 69.2% of the active Airbnb listings in Ambert, indicating a high concentration in these sizes.
- With over half the market (53.8%) consisting of studios or 1-bedroom units, Ambert is particularly well-suited for individuals or couples.
- A significant 23.0% of listings offer 3+ bedrooms, catering to larger groups and families seeking more space in Ambert.
Ambert Vacation Rental Guest Capacity Trends (2025)
Distribution of Listings by Guest Capacity
Guest Capacity Insights for Ambert
- The most common guest capacity trend in Ambert vacation rentals is listings accommodating 2 guests (34.6%). This suggests the primary traveler segment is likely couples or solo travelers.
- Properties designed for 2 guests and 4 guests dominate the Ambert STR market, accounting for 53.8% of listings.
- A significant 42.3% of listings cater specifically to 1-2 guests, highlighting strong demand from couples and solo travelers in Ambert.
- 23.0% of properties accommodate 6+ guests, serving the market segment for larger families or group travel in Ambert.
- On average, properties in Ambert are equipped to host 3.6 guests.
Ambert Airbnb Booking Patterns (2025): Available vs. Booked Days
Available Days Distribution
Booked Days Distribution
Booking Pattern Insights for Ambert
- The most common availability pattern in Ambert falls within the 271-366 days range, representing 42.3% of listings. This suggests many properties have significant open periods on their calendars.
- Approximately 80.8% of listings show high availability (181+ days open annually), indicating potential for increased bookings or specific owner usage patterns.
- For booked days, the 91-180 days range is most frequent in Ambert (38.5%), reflecting common guest stay durations or potential owner blocking patterns.
- A notable 19.2% of properties secure long booking periods (181+ days booked per year), highlighting successful long-term rental strategies or significant owner usage.
Ambert Airbnb Minimum Stay Requirements Analysis
Distribution of Listings by Minimum Night Requirement
1 Night
6 listings
28.6% of total
2 Nights
11 listings
52.4% of total
4-6 Nights
1 listings
4.8% of total
30+ Nights
3 listings
14.3% of total
Key Insights
- The most prevalent minimum stay requirement in Ambert is 2 Nights, adopted by 52.4% of listings. This highlights the market's preference for shorter, flexible bookings.
- A strong majority (81.0%) of the Ambert Airbnb data shows acceptance of very short stays (1-2 nights), indicating a dynamic, high-turnover market.
- A significant segment (14.3%) caters to monthly stays (30+ nights) in Ambert, pointing to opportunities in the extended-stay market.
Recommendations
- Align with the market by considering a 2 Nights minimum stay, as 52.4% of Ambert hosts use this setting.
- If feasible, allowing 1-night stays, especially midweek or during low season, could capture last-minute bookings, as only 28.6% currently do.
- Explore offering discounts for stays of 30+ nights to attract the 14.3% of the market seeking extended stays.
- Adjust minimum nights based on seasonality – potentially shorter during low season and longer during peak demand periods in Ambert.
Ambert Airbnb Cancellation Policy Trends Analysis (2025)
Flexible
9 listings
47.4% of total
Moderate
6 listings
31.6% of total
Firm
2 listings
10.5% of total
Strict
2 listings
10.5% of total
Cancellation Policy Insights for Ambert
- The prevailing Airbnb cancellation policy trend in Ambert is Flexible, used by 47.4% of listings.
- The market strongly favors guest-friendly terms, with 79.0% of listings offering Flexible or Moderate policies. This suggests guests in Ambert may expect booking flexibility.
Recommendations for Hosts
- Consider adopting a Flexible policy to align with the 47.4% market standard in Ambert.
- Using a Strict policy might deter some guests, as only 10.5% of listings use it. Evaluate if potential revenue protection outweighs possible lower booking rates.
- Regularly review your cancellation policy against competitors and market demand shifts in Ambert.
Ambert STR Booking Lead Time Analysis (2025)
Average Booking Lead Time by Month
Booking Lead Time Insights for Ambert
- The overall average booking lead time for vacation rentals in Ambert is 44 days.
- Guests book furthest in advance for stays during July (average 121 days), likely coinciding with peak travel demand or local events.
- The shortest booking windows occur for stays in December (average 30 days), indicating more last-minute travel plans during this time.
- Seasonally, Summer (82 days avg.) sees the longest lead times, while Fall (35 days avg.) has the shortest, reflecting typical travel planning cycles.
Recommendations for Hosts
- Use the overall average lead time (44 days) as a baseline for your pricing and availability strategy in Ambert.
- For July stays, consider implementing length-of-stay discounts or slightly higher rates for bookings made less than 121 days out to capitalize on advance planning.
- Target marketing efforts for the Summer season well in advance (at least 82 days) to capture early planners.
- Monitor your own booking lead times against these Ambert averages to identify opportunities for dynamic pricing adjustments.
Popular & Essential Airbnb Amenities in Ambert (2025)
Amenity Prevalence
Amenity Insights for Ambert
- Essential amenities in Ambert that guests expect include: Kitchen. Lacking these (this) could significantly impact bookings.
- Popular amenities like Heating, Hot water, Smoke alarm are common but not universal. Offering these can provide a competitive edge.
- Warning: Wifi is not universally provided but is considered essential globally. Ensure reliable Wifi is offered.
Recommendations for Hosts
- Ensure your listing includes all essential amenities for Ambert: Kitchen.
- Prioritize adding missing essentials: Kitchen.
- Consider adding popular differentiators like Heating or Hot water to increase appeal.
- Highlight unique or less common amenities you offer (e.g., hot tub, dedicated workspace, EV charger) in your listing description and photos.
- Regularly check competitor amenities in Ambert to stay competitive.
Ambert Airbnb Guest Demographics & Profile Analysis (2025)
Guest Profile Summary for Ambert
- The typical guest profile for Airbnb in Ambert consists of primarily domestic travelers (94%), often arriving from nearby Clermont-Ferrand, typically belonging to the Post-2000s (Gen Z/Alpha) group (50%), primarily speaking French or English.
- Domestic travelers account for 93.6% of guests.
- Key international markets include France (93.6%) and Netherlands (1.8%).
- Top languages spoken are French (47.9%) followed by English (31%).
- A significant demographic segment is the Post-2000s (Gen Z/Alpha) group, representing 50% of guests.
Recommendations for Hosts
- Target domestic marketing efforts towards travelers from Clermont-Ferrand and Lyon.
- Tailor amenities and listing descriptions to appeal to the dominant Post-2000s (Gen Z/Alpha) demographic (e.g., highlight fast WiFi, smart home features, local guides).
- Highlight unique local experiences or amenities relevant to the primary guest profile.
- Consider seasonal promotions aligned with peak travel times for key origin markets.
Nearby Short-Term Rental Market Comparison
How does the Ambert Airbnb market stack up against its neighbors? Compare key performance metrics like average monthly revenue, ADR, and occupancy rates in surrounding areas to understand the broader regional STR landscape.
| Market | Active Properties | Monthly Revenue | Daily Rate | Avg. Occupancy |
|---|---|---|---|---|
| Épinac | 14 | $5,147 | $333.01 | 37% |
| Divajeu | 19 | $3,941 | $410.65 | 42% |
| Saint-Germain-au-Mont-d'Or | 10 | $3,928 | $316.02 | 40% |
| Puligny-Montrachet | 11 | $3,908 | $398.00 | 44% |
| Dommartin | 11 | $3,905 | $327.00 | 36% |
| Juliénas | 11 | $3,378 | $292.32 | 46% |
| Courzieu | 11 | $3,267 | $287.83 | 52% |
| Vanosc | 13 | $3,072 | $224.52 | 44% |
| Bligny-lès-Beaune | 24 | $2,930 | $233.89 | 44% |
| Romanèche-Thorins | 13 | $2,817 | $239.98 | 43% |