Yvoire Airbnb Market Analysis 2025: Short Term Rental Data & Vacation Rental Statistics in Auvergne-Rhône-Alpes, France
Is Airbnb profitable in Yvoire in 2025? Explore comprehensive Airbnb analytics for Yvoire, Auvergne-Rhône-Alpes, France to uncover income potential. This 2025 STR market report for Yvoire, based on AirROI data from April 2024 to March 2025, reveals key trends in the niche market of 23 active listings.
Whether you're considering an Airbnb investment in Yvoire, optimizing your existing vacation rental, or exploring rental arbitrage opportunities, understanding the Yvoire Airbnb data is crucial. Leveraging the low regulation environment is key to maximizing your short term rental income potential. Let's dive into the specifics.
Key Yvoire Airbnb Performance Metrics Overview
Monthly Airbnb Revenue Variations & Income Potential in Yvoire (2025)
Understanding the monthly revenue variations for Airbnb listings in Yvoire is key to maximizing your short term rental income potential. Seasonality significantly impacts earnings. Our analysis, based on data from the past 12 months, shows that the peak revenue month for STRs in Yvoire is typically August, while January often presents the lowest earnings, highlighting opportunities for strategic pricing adjustments during shoulder and low seasons. Explore the typical Airbnb income in Yvoire across different performance tiers:
- Best-in-class properties (Top 10%) achieve $4,617+ monthly, often utilizing dynamic pricing and superior guest experiences.
- Strong performing properties (Top 25%) earn $3,224 or more, indicating effective management and desirable locations/amenities.
- Typical properties (Median) generate around $1,982 per month, representing the average market performance.
- Entry-level properties (Bottom 25%) see earnings around $1,239, often with potential for optimization.
Average Monthly Airbnb Earnings Trend in Yvoire
Yvoire Airbnb Occupancy Rate Trends (2025)
Maximize your bookings by understanding the Yvoire STR occupancy trends. Seasonal demand shifts significantly influence how often properties are booked. Typically, Augustsees the highest demand (peak season occupancy), while January experiences the lowest (low season). Effective strategies, like adjusting minimum stays or offering promotions, can boost occupancy during slower periods. Here's how different property tiers perform in Yvoire:
- Best-in-class properties (Top 10%) achieve 78%+ occupancy, indicating high desirability and potentially optimized availability.
- Strong performing properties (Top 25%) maintain 63% or higher occupancy, suggesting good market fit and guest satisfaction.
- Typical properties (Median) have an occupancy rate around 42%.
- Entry-level properties (Bottom 25%) average 29% occupancy, potentially facing higher vacancy.
Average Monthly Occupancy Rate Trend in Yvoire
Average Daily Rate (ADR) Airbnb Trends in Yvoire (2025)
Effective short term rental pricing strategy in Yvoire involves understanding monthly ADR fluctuations. The Average Daily Rate (ADR) for Airbnb in Yvoire typically peaks in December and dips lowest during October. Leveraging Airbnb dynamic pricing tools or strategies based on this seasonality can significantly boost revenue. Here's a look at the typical nightly rates achieved:
- Best-in-class properties (Top 10%) command rates of $245+ per night, often due to premium features or locations.
- Strong performing properties (Top 25%) achieve nightly rates of $190 or more.
- Typical properties (Median) charge around $140 per night.
- Entry-level properties (Bottom 25%) earn around $98 per night.
Average Daily Rate (ADR) Trend by Month in Yvoire
Get Live Yvoire Market Intelligence 👇

Explore Real-time Analytics
Airbnb Seasonality Analysis & Trends in Yvoire (2025)
Peak Season (August, July, June)
- Revenue averages $4,864 per month
- Occupancy rates average 64.8%
- Daily rates average $178
Shoulder Season
- Revenue averages $2,530 per month
- Occupancy maintains around 42.4%
- Daily rates hold near $173
Low Season (January, March, November)
- Revenue drops to average $1,385 per month
- Occupancy decreases to average 33.7%
- Daily rates adjust to average $179
Seasonality Insights for Yvoire
- The Airbnb seasonality in Yvoire shows highly seasonal trends requiring careful strategy. While the sections above show seasonal averages, it's also insightful to look at the extremes:
- During the high season, the absolute peak month showcases Yvoire's highest earning potential, with monthly revenues capable of climbing to $5,326, occupancy reaching a high of 80.0%, and ADRs peaking at $185.
- Conversely, the slowest single month of the year, typically falling within the low season, marks the market's lowest point. In this month, revenue might dip to $1,230, occupancy could drop to 29.4%, and ADRs may adjust down to $166.
- Understanding both the seasonal averages and these monthly peaks and troughs in revenue, occupancy, and ADR is crucial for maximizing your Airbnb profit potential in Yvoire.
Seasonal Strategies for Maximizing Profit
- Peak Season: Maximize revenue through premium pricing and potentially longer minimum stays. Ensure high availability.
- Low Season: Offer competitive pricing, special promotions (e.g., extended stay discounts), and flexible cancellation policies. Target off-season travelers like remote workers or budget-conscious guests.
- Shoulder Seasons: Implement dynamic pricing that balances peak and low rates. Target weekend travelers or specific events. Offer slightly more flexible terms than peak season.
- Regularly analyze your own performance against these Yvoire seasonality benchmarks and adjust your pricing and availability strategy accordingly.
Best Areas for Airbnb Investment in Yvoire (2025)
Exploring the top neighborhoods for short-term rentals in Yvoire? This section highlights key areas, outlining why they are attractive for hosts and guests, along with notable local attractions. Consider these locations based on your target guest profile and investment strategy.
| Neighborhood / Area | Why Host Here? (Target Guests & Appeal) | Key Attractions & Landmarks |
|---|---|---|
| Yvoire Old Town | A picturesque medieval village on the shores of Lake Geneva, known for its charming streets and flowers. It attracts tourists for its beauty and historical significance. | Garden of Five Senses, Château d'Yvoire, Yvoire Castle, Lake Geneva, Waterfront Promenade |
| Lake Geneva Promenade | A stunning lakeside area perfect for leisurely strolls, picnics, and water activities. Ideal for hosting guests who enjoy nature and relaxation. | Lac Léman, Boat Tours, Fishing, Swimming, Cycling Paths |
| Yvoire Market Square | A bustling hub where local vendors showcase their produce and crafts. This area is lively, drawing visitors looking for authentic French market experiences. | Local Farmers Market, Artisan Stalls, Cafés and Bistros, Cultural Events |
| Yvoire Port | The main harbor where visitors can take boat trips across Lake Geneva. It’s a busy area filled with restaurants, making it ideal for tourists. | Boating Experiences, Fishing Trips, Water Taxi Services, Dining Options |
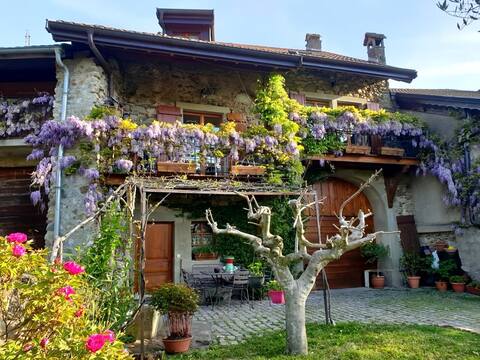
| Yvoire's Flowered Streets | Famous for its beautiful flowers and decoration, this area attracts visitors during the spring and summer months. It's perfect for Airbnb hosts catering to nature lovers. | Floral Displays, Photography Spots, Cafés with Outdoor Seating |
| Nearby Hiking Trails | The stunning landscapes surrounding Yvoire offer excellent hiking opportunities, attracting nature enthusiasts and adventure seekers. | Trailheads, Scenic Overlooks, Wildlife Watching |
| Cultural Heritage Sites | Attracting history buffs and cultural travelers, these sites highlight Yvoire's rich past and intriguing stories. | Historical Monuments, Guided Tours, Local Legends |
| Art and Craft Workshops | Yvoire offers various art and craft workshops that attract creative visitors looking to immerse themselves in local traditions. | Pottery Classes, Painting Workshops, Local Artist Exhibitions |
Understanding Airbnb License Requirements & STR Laws in Yvoire (2025)
While Yvoire, Auvergne-Rhône-Alpes, France currently shows low STR regulations, specific Airbnb license requirements might still exist or change. Always verify the latest short term rental regulations and Airbnb license requirements directly with local government authorities for Yvoire to ensure full compliance before hosting.
(Source: AirROI data, 2025, based on 9% licensed listings)
Top Performing Airbnb Properties in Yvoire (2025)
Benchmark your potential! Explore examples of top-performing Airbnb properties in Yvoirebased on Trailing Twelve Month (TTM) revenue. Analyze their characteristics, revenue, occupancy rate, and ADR to understand what drives success in this market.
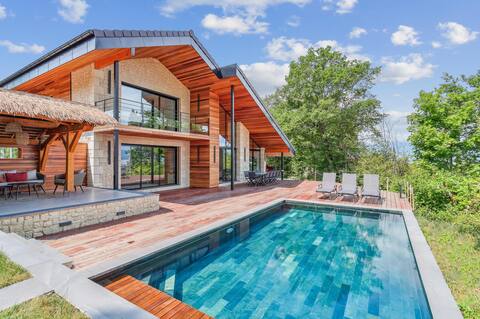
Leman Window - Lake View & SPA - Luxury Villa
Entire Place • 5 bedrooms
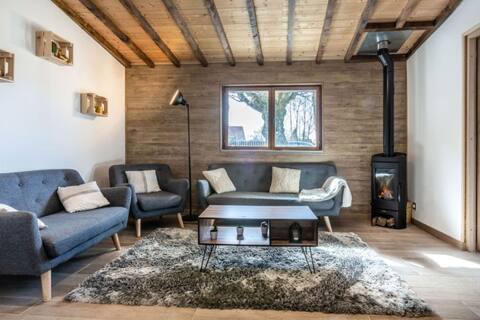
Le Chalet du Leman - Lake View - Jacuzzi and fire pit
Entire Place • 3 bedrooms

Beautifully renovated house in the heart of the village of Yholm
Entire Place • 3 bedrooms
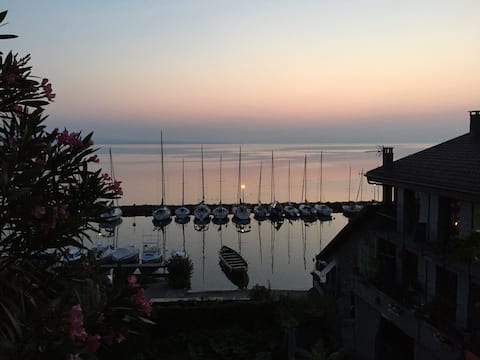
A room with a view
Entire Place • 2 bedrooms
Comfortable village house
Entire Place • 4 bedrooms

Renovated Duplex - View+Access Leman lake/Yvoire
Entire Place • 2 bedrooms
Note: Performance varies based on location, size, amenities, seasonality, and management quality. Data reflects the past 12 months.
Top Performing Airbnb Hosts in Yvoire (2025)
Learn from the best! This table showcases top-performing Airbnb hosts in Yvoire based on the number of properties managed and estimated total revenue over the past year. Analyze their scale and performance metrics.
| Host Name | Properties | Grossing Revenue | Stay Reviews | Avg Rating |
|---|---|---|---|---|
| Mathieu & Laetitia | 2 | $197,911 | 119 | 4.84/5.0 |
| Morgane | 2 | $55,853 | 39 | 4.88/5.0 |
| Fanny | 1 | $41,986 | 49 | 4.98/5.0 |
| Nadine | 1 | $35,807 | 13 | 5.00/5.0 |
| Denis | 1 | $33,176 | 68 | 4.96/5.0 |
| Anna | 1 | $30,563 | 12 | 4.92/5.0 |
| Axel | 1 | $29,980 | 34 | 4.94/5.0 |
| M.A. | 1 | $27,785 | 14 | 5.00/5.0 |
| Benjamin | 1 | $27,587 | 18 | 5.00/5.0 |
| Albert | 1 | $26,421 | 31 | 4.77/5.0 |
Analyzing the strategies of top hosts, such as their property selection, pricing, and guest communication, can offer valuable lessons for optimizing your own Airbnb operations in Yvoire.
Dive Deeper: Advanced Yvoire STR Market Data (2025)
Ready to unlock more insights? AirROI provides access to advanced metrics and comprehensive Airbnb data for Yvoire. Explore detailed analytics beyond this report to refine your investment strategy, optimize pricing, and maximize your vacation rental profits.
Explore Advanced MetricsYvoire Short-Term Rental Market Composition (2025): Property & Room Types
Room Type Distribution
Property Type Distribution
Market Composition Insights for Yvoire
- The Yvoire Airbnb market composition is heavily skewed towards Entire Home/Apt listings, which make up 87% of the 23 active rentals. This indicates strong guest preference for privacy and space.
- Looking at the property type distribution in Yvoire, House properties are the most common (47.8%), reflecting the local real estate landscape.
- Houses represent a significant 47.8% portion, catering likely to families or larger groups.
- Smaller segments like hotel/boutique, unique stays (combined 8.6%) offer potential for unique stay experiences.
Yvoire Airbnb Room Capacity Analysis (2025): Bedroom Distribution
Distribution of Listings by Number of Bedrooms
Room Capacity Insights for Yvoire
- The dominant room capacity in Yvoire is 1 bedroom listings, making up 39.1% of the market. This suggests a strong demand for properties suitable for couples or solo travelers.
- Together, 1 bedroom and 2 bedrooms properties represent 60.8% of the active Airbnb listings in Yvoire, indicating a high concentration in these sizes.
- A significant 30.3% of listings offer 3+ bedrooms, catering to larger groups and families seeking more space in Yvoire.
Yvoire Vacation Rental Guest Capacity Trends (2025)
Distribution of Listings by Guest Capacity
Guest Capacity Insights for Yvoire
- The most common guest capacity trend in Yvoire vacation rentals is listings accommodating 4 guests (26.1%). This suggests the primary traveler segment is likely small families or groups.
- Properties designed for 4 guests and 2 guests dominate the Yvoire STR market, accounting for 47.8% of listings.
- 30.4% of properties accommodate 6+ guests, serving the market segment for larger families or group travel in Yvoire.
- On average, properties in Yvoire are equipped to host 4.0 guests.
Yvoire Airbnb Booking Patterns (2025): Available vs. Booked Days
Available Days Distribution
Booked Days Distribution
Booking Pattern Insights for Yvoire
- The most common availability pattern in Yvoire falls within the 181-270 days range, representing 52.2% of listings. This suggests many properties have significant open periods on their calendars.
- Approximately 65.2% of listings show high availability (181+ days open annually), indicating potential for increased bookings or specific owner usage patterns.
- For booked days, the 91-180 days range is most frequent in Yvoire (52.2%), reflecting common guest stay durations or potential owner blocking patterns.
- A notable 34.7% of properties secure long booking periods (181+ days booked per year), highlighting successful long-term rental strategies or significant owner usage.
Yvoire Airbnb Minimum Stay Requirements Analysis
Distribution of Listings by Minimum Night Requirement
1 Night
4 listings
17.4% of total
2 Nights
6 listings
26.1% of total
3 Nights
4 listings
17.4% of total
4-6 Nights
4 listings
17.4% of total
7-29 Nights
1 listings
4.3% of total
30+ Nights
4 listings
17.4% of total
Key Insights
- The most prevalent minimum stay requirement in Yvoire is 2 Nights, adopted by 26.1% of listings. This highlights the market's preference for shorter, flexible bookings.
- A significant segment (17.4%) caters to monthly stays (30+ nights) in Yvoire, pointing to opportunities in the extended-stay market.
Recommendations
- Align with the market by considering a 2 Nights minimum stay, as 26.1% of Yvoire hosts use this setting.
- If feasible, allowing 1-night stays, especially midweek or during low season, could capture last-minute bookings, as only 17.4% currently do.
- Explore offering discounts for stays of 30+ nights to attract the 17.4% of the market seeking extended stays.
- Adjust minimum nights based on seasonality – potentially shorter during low season and longer during peak demand periods in Yvoire.
Yvoire Airbnb Cancellation Policy Trends Analysis (2025)
Flexible
5 listings
22.7% of total
Moderate
7 listings
31.8% of total
Firm
6 listings
27.3% of total
Strict
4 listings
18.2% of total
Cancellation Policy Insights for Yvoire
- The prevailing Airbnb cancellation policy trend in Yvoire is Moderate, used by 31.8% of listings.
- There's a relatively balanced mix between guest-friendly (54.5%) and stricter (45.5%) policies, offering choices for different guest needs.
Recommendations for Hosts
- Consider adopting a Moderate policy to align with the 31.8% market standard in Yvoire.
- Regularly review your cancellation policy against competitors and market demand shifts in Yvoire.
Yvoire STR Booking Lead Time Analysis (2025)
Average Booking Lead Time by Month
Booking Lead Time Insights for Yvoire
- The overall average booking lead time for vacation rentals in Yvoire is 64 days.
- Guests book furthest in advance for stays during July (average 146 days), likely coinciding with peak travel demand or local events.
- The shortest booking windows occur for stays in November (average 26 days), indicating more last-minute travel plans during this time.
- Seasonally, Summer (121 days avg.) sees the longest lead times, while Winter (37 days avg.) has the shortest, reflecting typical travel planning cycles.
Recommendations for Hosts
- Use the overall average lead time (64 days) as a baseline for your pricing and availability strategy in Yvoire.
- For July stays, consider implementing length-of-stay discounts or slightly higher rates for bookings made less than 146 days out to capitalize on advance planning.
- Target marketing efforts for the Summer season well in advance (at least 121 days) to capture early planners.
- Monitor your own booking lead times against these Yvoire averages to identify opportunities for dynamic pricing adjustments.
Popular & Essential Airbnb Amenities in Yvoire (2025)
Amenity Prevalence
Amenity Insights for Yvoire
- Essential amenities in Yvoire that guests expect include: Wifi, Heating, Hot water. Lacking these (any) could significantly impact bookings.
- Popular amenities like TV, Hair dryer, Essentials are common but not universal. Offering these can provide a competitive edge.
Recommendations for Hosts
- Ensure your listing includes all essential amenities for Yvoire: Wifi, Heating, Hot water.
- Prioritize adding missing essentials: Hot water.
- Consider adding popular differentiators like TV or Hair dryer to increase appeal.
- Highlight unique or less common amenities you offer (e.g., hot tub, dedicated workspace, EV charger) in your listing description and photos.
- Regularly check competitor amenities in Yvoire to stay competitive.
Yvoire Airbnb Guest Demographics & Profile Analysis (2025)
Guest Profile Summary for Yvoire
- The typical guest profile for Airbnb in Yvoire consists of a mix of domestic (50%) and international guests, with top international origins including Switzerland, typically belonging to the Post-2000s (Gen Z/Alpha) group (50%), primarily speaking English or French.
- Domestic travelers account for 50.0% of guests.
- Key international markets include France (50%) and Switzerland (12.5%).
- Top languages spoken are English (31.1%) followed by French (25.1%).
- A significant demographic segment is the Post-2000s (Gen Z/Alpha) group, representing 50% of guests.
Recommendations for Hosts
- Balance marketing efforts between domestic and international channels based on the guest mix.
- Tailor amenities and listing descriptions to appeal to the dominant Post-2000s (Gen Z/Alpha) demographic (e.g., highlight fast WiFi, smart home features, local guides).
- Highlight unique local experiences or amenities relevant to the primary guest profile.
- Consider seasonal promotions aligned with peak travel times for key origin markets.
Nearby Short-Term Rental Market Comparison
How does the Yvoire Airbnb market stack up against its neighbors? Compare key performance metrics like average monthly revenue, ADR, and occupancy rates in surrounding areas to understand the broader regional STR landscape.
| Market | Active Properties | Monthly Revenue | Daily Rate | Avg. Occupancy |
|---|---|---|---|---|
| Lauterbrunnen | 525 | $7,079 | $546.45 | 54% |
| La Rivière-Enverse | 17 | $5,972 | $624.02 | 41% |
| Les Clefs | 30 | $5,741 | $323.11 | 44% |
| Matten bei Interlaken | 52 | $5,674 | $316.63 | 63% |
| Iseltwald | 14 | $5,491 | $331.95 | 58% |
| Habkern | 13 | $5,382 | $344.74 | 50% |
| Interlaken | 288 | $4,987 | $310.52 | 56% |
| Zermatt | 734 | $4,604 | $463.00 | 46% |
| Oberhofen am Thunersee | 24 | $4,572 | $265.94 | 55% |
| Sigriswil | 99 | $4,371 | $271.90 | 58% |