Voreppe Airbnb Market Analysis 2025: Short Term Rental Data & Vacation Rental Statistics in Auvergne-Rhône-Alpes, France
Is Airbnb profitable in Voreppe in 2025? Explore comprehensive Airbnb analytics for Voreppe, Auvergne-Rhône-Alpes, France to uncover income potential. This 2025 STR market report for Voreppe, based on AirROI data from April 2024 to March 2025, reveals key trends in the niche market of 29 active listings.
Whether you're considering an Airbnb investment in Voreppe, optimizing your existing vacation rental, or exploring rental arbitrage opportunities, understanding the Voreppe Airbnb data is crucial. Leveraging the low regulation environment is key to maximizing your short term rental income potential. Let's dive into the specifics.
Key Voreppe Airbnb Performance Metrics Overview
Monthly Airbnb Revenue Variations & Income Potential in Voreppe (2025)
Understanding the monthly revenue variations for Airbnb listings in Voreppe is key to maximizing your short term rental income potential. Seasonality significantly impacts earnings. Our analysis, based on data from the past 12 months, shows that the peak revenue month for STRs in Voreppe is typically July, while January often presents the lowest earnings, highlighting opportunities for strategic pricing adjustments during shoulder and low seasons. Explore the typical Airbnb income in Voreppe across different performance tiers:
- Best-in-class properties (Top 10%) achieve $3,200+ monthly, often utilizing dynamic pricing and superior guest experiences.
- Strong performing properties (Top 25%) earn $1,639 or more, indicating effective management and desirable locations/amenities.
- Typical properties (Median) generate around $1,092 per month, representing the average market performance.
- Entry-level properties (Bottom 25%) see earnings around $584, often with potential for optimization.
Average Monthly Airbnb Earnings Trend in Voreppe
Voreppe Airbnb Occupancy Rate Trends (2025)
Maximize your bookings by understanding the Voreppe STR occupancy trends. Seasonal demand shifts significantly influence how often properties are booked. Typically, Februarysees the highest demand (peak season occupancy), while June experiences the lowest (low season). Effective strategies, like adjusting minimum stays or offering promotions, can boost occupancy during slower periods. Here's how different property tiers perform in Voreppe:
- Best-in-class properties (Top 10%) achieve 81%+ occupancy, indicating high desirability and potentially optimized availability.
- Strong performing properties (Top 25%) maintain 69% or higher occupancy, suggesting good market fit and guest satisfaction.
- Typical properties (Median) have an occupancy rate around 44%.
- Entry-level properties (Bottom 25%) average 26% occupancy, potentially facing higher vacancy.
Average Monthly Occupancy Rate Trend in Voreppe
Average Daily Rate (ADR) Airbnb Trends in Voreppe (2025)
Effective short term rental pricing strategy in Voreppe involves understanding monthly ADR fluctuations. The Average Daily Rate (ADR) for Airbnb in Voreppe typically peaks in April and dips lowest during February. Leveraging Airbnb dynamic pricing tools or strategies based on this seasonality can significantly boost revenue. Here's a look at the typical nightly rates achieved:
- Best-in-class properties (Top 10%) command rates of $473+ per night, often due to premium features or locations.
- Strong performing properties (Top 25%) achieve nightly rates of $117 or more.
- Typical properties (Median) charge around $70 per night.
- Entry-level properties (Bottom 25%) earn around $45 per night.
Average Daily Rate (ADR) Trend by Month in Voreppe
Get Live Voreppe Market Intelligence 👇

Explore Real-time Analytics
Airbnb Seasonality Analysis & Trends in Voreppe (2025)
Peak Season (July, August, May)
- Revenue averages $2,036 per month
- Occupancy rates average 48.1%
- Daily rates average $164
Shoulder Season
- Revenue averages $1,388 per month
- Occupancy maintains around 45.8%
- Daily rates hold near $151
Low Season (January, February, December)
- Revenue drops to average $1,002 per month
- Occupancy decreases to average 48.6%
- Daily rates adjust to average $122
Seasonality Insights for Voreppe
- The Airbnb seasonality in Voreppe shows highly seasonal trends requiring careful strategy. While the sections above show seasonal averages, it's also insightful to look at the extremes:
- During the high season, the absolute peak month showcases Voreppe's highest earning potential, with monthly revenues capable of climbing to $2,460, occupancy reaching a high of 61.5%, and ADRs peaking at $170.
- Conversely, the slowest single month of the year, typically falling within the low season, marks the market's lowest point. In this month, revenue might dip to $854, occupancy could drop to 28.5%, and ADRs may adjust down to $119.
- Understanding both the seasonal averages and these monthly peaks and troughs in revenue, occupancy, and ADR is crucial for maximizing your Airbnb profit potential in Voreppe.
Seasonal Strategies for Maximizing Profit
- Peak Season: Maximize revenue through premium pricing and potentially longer minimum stays. Ensure high availability.
- Low Season: Offer competitive pricing, special promotions (e.g., extended stay discounts), and flexible cancellation policies. Target off-season travelers like remote workers or budget-conscious guests.
- Shoulder Seasons: Implement dynamic pricing that balances peak and low rates. Target weekend travelers or specific events. Offer slightly more flexible terms than peak season.
- Regularly analyze your own performance against these Voreppe seasonality benchmarks and adjust your pricing and availability strategy accordingly.
Best Areas for Airbnb Investment in Voreppe (2025)
Exploring the top neighborhoods for short-term rentals in Voreppe? This section highlights key areas, outlining why they are attractive for hosts and guests, along with notable local attractions. Consider these locations based on your target guest profile and investment strategy.
| Neighborhood / Area | Why Host Here? (Target Guests & Appeal) | Key Attractions & Landmarks |
|---|---|---|
| Voreppe Town Center | The heart of Voreppe, offering charming streets, local shops, and cafes. A great spot for travelers looking to experience local life and culture. | Voreppe Market, Eglise Saint-Vincent, Parc de la Mairie, Local restaurants and bistros |
| Grenoble | Just a short drive from Voreppe, Grenoble is a vibrant city known for its museums, cultural sites, and proximity to the Alps, making it attractive for both business and leisure travelers. | Museum of Grenoble, Bastille Hill, Chipie Cafe, Victoire Square, Isère River |
| Chartreuse National Park | A picturesque natural area ideal for outdoor enthusiasts. Perfect for hosting guests interested in hiking, skiing, and enjoying nature. | Hiking trails, Ski resorts, Scenic viewpoints, Local wildlife |
| Le Grand Sappey | A tranquil suburb with beautiful views and easy access to nature, ideal for those looking to escape the city while still being close to amenities. | Hiking trails, Local vineyards, Mountain biking |
| Crolles | A nearby town offering a mix of suburban charm and business opportunities, popular with families and professionals working in the tech sector. | Crolles Park, Shopping areas, Café culture |
| Saint-Ismier | A quaint town known for its peaceful environment and proximity to the mountains, appealing to tourists looking for a relaxing retreat. | Local parks, Scenic gardens, Mountain access |
| Montbonnot-Saint-Martin | A growing suburb close to Grenoble, popular for its accessibility and business environment. Attractive for temporary housing for business travelers. | Local shops, Business districts, Parks |
| Lumbin | A serene village situated near the mountains, ideal for travelers interested in skiing or hiking during their stay. | Lumbin Chapel, Access to ski resorts, Nature walks |
Understanding Airbnb License Requirements & STR Laws in Voreppe (2025)
While Voreppe, Auvergne-Rhône-Alpes, France currently shows low STR regulations, specific Airbnb license requirements might still exist or change. Always verify the latest short term rental regulations and Airbnb license requirements directly with local government authorities for Voreppe to ensure full compliance before hosting.
(Source: AirROI data, 2025, based on 7% licensed listings)
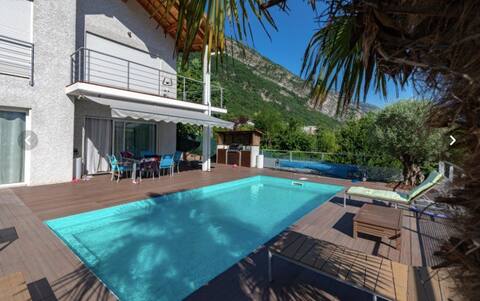
Top Performing Airbnb Properties in Voreppe (2025)
Benchmark your potential! Explore examples of top-performing Airbnb properties in Voreppebased on Trailing Twelve Month (TTM) revenue. Analyze their characteristics, revenue, occupancy rate, and ADR to understand what drives success in this market.
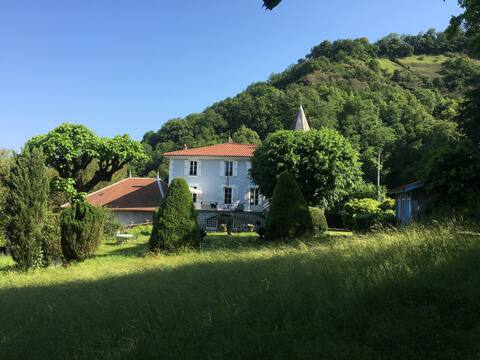
Lovely family home in Chartreuse mountains
Entire Place • 5 bedrooms

Modern Villa architect 180m2 -feet of the mountains
Entire Place • 4 bedrooms

Charming stone house overlooking the mountains.
Entire Place • 4 bedrooms
Une maison où il fait bon séjourner
Entire Place • 5 bedrooms

Maison9/10pers + jacuzzi (SUP) 15min grenoble /voiron
Entire Place • 4 bedrooms

Chambre d 'Hôtes
Private Room • 1 bedroom
Note: Performance varies based on location, size, amenities, seasonality, and management quality. Data reflects the past 12 months.
Top Performing Airbnb Hosts in Voreppe (2025)
Learn from the best! This table showcases top-performing Airbnb hosts in Voreppe based on the number of properties managed and estimated total revenue over the past year. Analyze their scale and performance metrics.
| Host Name | Properties | Grossing Revenue | Stay Reviews | Avg Rating |
|---|---|---|---|---|
| Mathieu And Jacqueline | 1 | $42,563 | 44 | 4.82/5.0 |
| Paulina | 1 | $33,840 | 10 | 5.00/5.0 |
| Didine | 1 | $26,814 | 5 | 5.00/5.0 |
| Host #26920927 | 1 | $23,874 | 3 | 4.33/5.0 |
| Aurelien | 1 | $23,305 | 21 | 4.95/5.0 |
| Philippe | 1 | $19,432 | 35 | 5.00/5.0 |
| Joao | 1 | $18,073 | 144 | 4.90/5.0 |
| Erwan Cristèle Et Laly | 1 | $16,461 | 119 | 4.81/5.0 |
| Brigitte | 1 | $16,306 | 18 | 5.00/5.0 |
| Pace | 3 | $14,776 | 100 | 4.93/5.0 |
Analyzing the strategies of top hosts, such as their property selection, pricing, and guest communication, can offer valuable lessons for optimizing your own Airbnb operations in Voreppe.
Dive Deeper: Advanced Voreppe STR Market Data (2025)
Ready to unlock more insights? AirROI provides access to advanced metrics and comprehensive Airbnb data for Voreppe. Explore detailed analytics beyond this report to refine your investment strategy, optimize pricing, and maximize your vacation rental profits.
Explore Advanced MetricsVoreppe Short-Term Rental Market Composition (2025): Property & Room Types
Room Type Distribution
Property Type Distribution
Market Composition Insights for Voreppe
- The Voreppe Airbnb market composition is heavily skewed towards Entire Home/Apt listings, which make up 62.1% of the 29 active rentals. This indicates strong guest preference for privacy and space.
- However, a notable 37.9% share for Private Rooms suggests opportunities for budget-conscious travelers or hosts renting out spare rooms.
- Looking at the property type distribution in Voreppe, House properties are the most common (48.3%), reflecting the local real estate landscape.
- Houses represent a significant 48.3% portion, catering likely to families or larger groups.
- Smaller segments like others, hotel/boutique (combined 6.8%) offer potential for unique stay experiences.
Voreppe Airbnb Room Capacity Analysis (2025): Bedroom Distribution
Distribution of Listings by Number of Bedrooms
Room Capacity Insights for Voreppe
- The dominant room capacity in Voreppe is 1 bedroom listings, making up 31% of the market. This suggests a strong demand for properties suitable for couples or solo travelers.
- Together, 1 bedroom and 4 bedrooms properties represent 41.3% of the active Airbnb listings in Voreppe, indicating a high concentration in these sizes.
- A significant 27.5% of listings offer 3+ bedrooms, catering to larger groups and families seeking more space in Voreppe.
Voreppe Vacation Rental Guest Capacity Trends (2025)
Distribution of Listings by Guest Capacity
Guest Capacity Insights for Voreppe
- The most common guest capacity trend in Voreppe vacation rentals is listings accommodating 4 guests (20.7%). This suggests the primary traveler segment is likely small families or groups.
- Properties designed for 4 guests and 8+ guests dominate the Voreppe STR market, accounting for 41.4% of listings.
- 27.6% of properties accommodate 6+ guests, serving the market segment for larger families or group travel in Voreppe.
- On average, properties in Voreppe are equipped to host 3.4 guests.
Voreppe Airbnb Booking Patterns (2025): Available vs. Booked Days
Available Days Distribution
Booked Days Distribution
Booking Pattern Insights for Voreppe
- The most common availability pattern in Voreppe falls within the 271-366 days range, representing 48.3% of listings. This suggests many properties have significant open periods on their calendars.
- Approximately 65.5% of listings show high availability (181+ days open annually), indicating potential for increased bookings or specific owner usage patterns.
- For booked days, the 1-30 days range is most frequent in Voreppe (27.6%), reflecting common guest stay durations or potential owner blocking patterns.
- A notable 37.9% of properties secure long booking periods (181+ days booked per year), highlighting successful long-term rental strategies or significant owner usage.
Voreppe Airbnb Minimum Stay Requirements Analysis
Distribution of Listings by Minimum Night Requirement
1 Night
11 listings
39.3% of total
2 Nights
9 listings
32.1% of total
3 Nights
6 listings
21.4% of total
7-29 Nights
1 listings
3.6% of total
30+ Nights
1 listings
3.6% of total
Key Insights
- The most prevalent minimum stay requirement in Voreppe is 1 Night, adopted by 39.3% of listings. This highlights the market's preference for shorter, flexible bookings.
- A strong majority (71.4%) of the Voreppe Airbnb data shows acceptance of very short stays (1-2 nights), indicating a dynamic, high-turnover market.
Recommendations
- Align with the market by considering a 1 Night minimum stay, as 39.3% of Voreppe hosts use this setting.
- Adjust minimum nights based on seasonality – potentially shorter during low season and longer during peak demand periods in Voreppe.
Voreppe Airbnb Cancellation Policy Trends Analysis (2025)
Flexible
10 listings
38.5% of total
Moderate
9 listings
34.6% of total
Firm
1 listings
3.8% of total
Strict
6 listings
23.1% of total
Cancellation Policy Insights for Voreppe
- The prevailing Airbnb cancellation policy trend in Voreppe is Flexible, used by 38.5% of listings.
- The market strongly favors guest-friendly terms, with 73.1% of listings offering Flexible or Moderate policies. This suggests guests in Voreppe may expect booking flexibility.
Recommendations for Hosts
- Consider adopting a Flexible policy to align with the 38.5% market standard in Voreppe.
- Regularly review your cancellation policy against competitors and market demand shifts in Voreppe.
Voreppe STR Booking Lead Time Analysis (2025)
Average Booking Lead Time by Month
Booking Lead Time Insights for Voreppe
- The overall average booking lead time for vacation rentals in Voreppe is 39 days.
- Guests book furthest in advance for stays during August (average 69 days), likely coinciding with peak travel demand or local events.
- The shortest booking windows occur for stays in January (average 22 days), indicating more last-minute travel plans during this time.
- Seasonally, Spring (53 days avg.) sees the longest lead times, while Fall (28 days avg.) has the shortest, reflecting typical travel planning cycles.
Recommendations for Hosts
- Use the overall average lead time (39 days) as a baseline for your pricing and availability strategy in Voreppe.
- For August stays, consider implementing length-of-stay discounts or slightly higher rates for bookings made less than 69 days out to capitalize on advance planning.
- Target marketing efforts for the Spring season well in advance (at least 53 days) to capture early planners.
- Monitor your own booking lead times against these Voreppe averages to identify opportunities for dynamic pricing adjustments.
Popular & Essential Airbnb Amenities in Voreppe (2025)
Amenity Prevalence
Amenity Insights for Voreppe
- Essential amenities in Voreppe that guests expect include: Heating, Hot water, Wifi, Free parking on premises, Essentials. Lacking these (any) could significantly impact bookings.
- Popular amenities like Kitchen, Smoke alarm, Refrigerator are common but not universal. Offering these can provide a competitive edge.
Recommendations for Hosts
- Ensure your listing includes all essential amenities for Voreppe: Heating, Hot water, Wifi, Free parking on premises, Essentials.
- Prioritize adding missing essentials: Wifi, Free parking on premises, Essentials.
- Consider adding popular differentiators like Kitchen or Smoke alarm to increase appeal.
- Highlight unique or less common amenities you offer (e.g., hot tub, dedicated workspace, EV charger) in your listing description and photos.
- Regularly check competitor amenities in Voreppe to stay competitive.
Voreppe Airbnb Guest Demographics & Profile Analysis (2025)
Guest Profile Summary for Voreppe
- The typical guest profile for Airbnb in Voreppe consists of primarily domestic travelers (80%), often arriving from nearby Paris, typically belonging to the Post-2000s (Gen Z/Alpha) group (50%), primarily speaking French or English.
- Domestic travelers account for 80.2% of guests.
- Key international markets include France (80.2%) and Switzerland (3.6%).
- Top languages spoken are French (42.5%) followed by English (33%).
- A significant demographic segment is the Post-2000s (Gen Z/Alpha) group, representing 50% of guests.
Recommendations for Hosts
- Target domestic marketing efforts towards travelers from Paris and Grenoble.
- Tailor amenities and listing descriptions to appeal to the dominant Post-2000s (Gen Z/Alpha) demographic (e.g., highlight fast WiFi, smart home features, local guides).
- Highlight unique local experiences or amenities relevant to the primary guest profile.
- Consider seasonal promotions aligned with peak travel times for key origin markets.
Nearby Short-Term Rental Market Comparison
How does the Voreppe Airbnb market stack up against its neighbors? Compare key performance metrics like average monthly revenue, ADR, and occupancy rates in surrounding areas to understand the broader regional STR landscape.
| Market | Active Properties | Monthly Revenue | Daily Rate | Avg. Occupancy |
|---|---|---|---|---|
| La Rivière-Enverse | 17 | $5,972 | $624.02 | 41% |
| Les Clefs | 30 | $5,741 | $323.11 | 44% |
| Épinac | 14 | $5,147 | $333.01 | 37% |
| Manigod | 194 | $4,127 | $427.80 | 40% |
| Divajeu | 19 | $3,941 | $410.65 | 42% |
| Saint-Germain-au-Mont-d'Or | 10 | $3,928 | $316.02 | 40% |
| Puligny-Montrachet | 11 | $3,908 | $398.00 | 44% |
| Dommartin | 11 | $3,905 | $327.00 | 36% |
| Saint-Nicolas-la-Chapelle | 27 | $3,381 | $375.70 | 43% |
| Juliénas | 11 | $3,378 | $292.32 | 46% |