Val de Chaise Airbnb Market Analysis 2025: Short Term Rental Data & Vacation Rental Statistics in Auvergne-Rhône-Alpes, France
Is Airbnb profitable in Val de Chaise in 2025? Explore comprehensive Airbnb analytics for Val de Chaise, Auvergne-Rhône-Alpes, France to uncover income potential. This 2025 STR market report for Val de Chaise, based on AirROI data from April 2024 to March 2025, reveals key trends in the niche market of 21 active listings.
Whether you're considering an Airbnb investment in Val de Chaise, optimizing your existing vacation rental, or exploring rental arbitrage opportunities, understanding the Val de Chaise Airbnb data is crucial. Leveraging the low regulation environment is key to maximizing your short term rental income potential. Let's dive into the specifics.
Key Val de Chaise Airbnb Performance Metrics Overview
Monthly Airbnb Revenue Variations & Income Potential in Val de Chaise (2025)
Understanding the monthly revenue variations for Airbnb listings in Val de Chaise is key to maximizing your short term rental income potential. Seasonality significantly impacts earnings. Our analysis, based on data from the past 12 months, shows that the peak revenue month for STRs in Val de Chaise is typically August, while November often presents the lowest earnings, highlighting opportunities for strategic pricing adjustments during shoulder and low seasons. Explore the typical Airbnb income in Val de Chaise across different performance tiers:
- Best-in-class properties (Top 10%) achieve $2,643+ monthly, often utilizing dynamic pricing and superior guest experiences.
- Strong performing properties (Top 25%) earn $1,844 or more, indicating effective management and desirable locations/amenities.
- Typical properties (Median) generate around $1,176 per month, representing the average market performance.
- Entry-level properties (Bottom 25%) see earnings around $737, often with potential for optimization.
Average Monthly Airbnb Earnings Trend in Val de Chaise
Val de Chaise Airbnb Occupancy Rate Trends (2025)
Maximize your bookings by understanding the Val de Chaise STR occupancy trends. Seasonal demand shifts significantly influence how often properties are booked. Typically, Augustsees the highest demand (peak season occupancy), while April experiences the lowest (low season). Effective strategies, like adjusting minimum stays or offering promotions, can boost occupancy during slower periods. Here's how different property tiers perform in Val de Chaise:
- Best-in-class properties (Top 10%) achieve 74%+ occupancy, indicating high desirability and potentially optimized availability.
- Strong performing properties (Top 25%) maintain 62% or higher occupancy, suggesting good market fit and guest satisfaction.
- Typical properties (Median) have an occupancy rate around 46%.
- Entry-level properties (Bottom 25%) average 30% occupancy, potentially facing higher vacancy.
Average Monthly Occupancy Rate Trend in Val de Chaise
Average Daily Rate (ADR) Airbnb Trends in Val de Chaise (2025)
Effective short term rental pricing strategy in Val de Chaise involves understanding monthly ADR fluctuations. The Average Daily Rate (ADR) for Airbnb in Val de Chaise typically peaks in July and dips lowest during January. Leveraging Airbnb dynamic pricing tools or strategies based on this seasonality can significantly boost revenue. Here's a look at the typical nightly rates achieved:
- Best-in-class properties (Top 10%) command rates of $182+ per night, often due to premium features or locations.
- Strong performing properties (Top 25%) achieve nightly rates of $118 or more.
- Typical properties (Median) charge around $90 per night.
- Entry-level properties (Bottom 25%) earn around $62 per night.
Average Daily Rate (ADR) Trend by Month in Val de Chaise
Get Live Val de Chaise Market Intelligence 👇

Explore Real-time Analytics
Airbnb Seasonality Analysis & Trends in Val de Chaise (2025)
Peak Season (August, July, May)
- Revenue averages $2,152 per month
- Occupancy rates average 68.0%
- Daily rates average $105
Shoulder Season
- Revenue averages $1,312 per month
- Occupancy maintains around 43.9%
- Daily rates hold near $101
Low Season (March, October, November)
- Revenue drops to average $829 per month
- Occupancy decreases to average 32.7%
- Daily rates adjust to average $100
Seasonality Insights for Val de Chaise
- The Airbnb seasonality in Val de Chaise shows highly seasonal trends requiring careful strategy. While the sections above show seasonal averages, it's also insightful to look at the extremes:
- During the high season, the absolute peak month showcases Val de Chaise's highest earning potential, with monthly revenues capable of climbing to $2,603, occupancy reaching a high of 87.4%, and ADRs peaking at $106.
- Conversely, the slowest single month of the year, typically falling within the low season, marks the market's lowest point. In this month, revenue might dip to $804, occupancy could drop to 29.7%, and ADRs may adjust down to $97.
- Understanding both the seasonal averages and these monthly peaks and troughs in revenue, occupancy, and ADR is crucial for maximizing your Airbnb profit potential in Val de Chaise.
Seasonal Strategies for Maximizing Profit
- Peak Season: Maximize revenue through premium pricing and potentially longer minimum stays. Ensure high availability.
- Low Season: Offer competitive pricing, special promotions (e.g., extended stay discounts), and flexible cancellation policies. Target off-season travelers like remote workers or budget-conscious guests.
- Shoulder Seasons: Implement dynamic pricing that balances peak and low rates. Target weekend travelers or specific events. Offer slightly more flexible terms than peak season.
- Regularly analyze your own performance against these Val de Chaise seasonality benchmarks and adjust your pricing and availability strategy accordingly.
Best Areas for Airbnb Investment in Val de Chaise (2025)
Exploring the top neighborhoods for short-term rentals in Val de Chaise? This section highlights key areas, outlining why they are attractive for hosts and guests, along with notable local attractions. Consider these locations based on your target guest profile and investment strategy.
| Neighborhood / Area | Why Host Here? (Target Guests & Appeal) | Key Attractions & Landmarks |
|---|---|---|
| Château de Lavoûte | A stunning historic castle surrounded by beautiful landscapes, ideal for visitors interested in history and culture. Great for romantic getaways and family stays. | Château de Lavoûte, Gorges de l'Allier, Hiking trails, Local vineyards |
| Saint-Paulien | A charming village with rich history and stunning views, perfect for those looking to explore rural France and experience local culture. | Eglise de Saint-Paulien, Local markets, Hiking routes, Culinary experiences |
| Cousset | Located near the Allier River, this small town offers a picturesque setting for outdoor lovers and families seeking a peaceful retreat. | Riverside parks, Fishing opportunities, Local festivals, Cycling routes |
| Vorey | A quaint town known for its beautiful river views, Vorey attracts visitors looking for natural beauty and outdoor activities. | Rivière de l'Allier, Parks and green spaces, Kayaking and canoeing, Local artisanal products |
| Yssingeaux | Historic yet vibrant, Yssingeaux provides a mix of cultural attractions and outdoor adventures, appealing to a wide range of travelers. | Temples d'Yssingeaux, Local crafts shops, Mountain biking trails, Cultural festivals |
| Retournac | Nestled in the valley of the river Loire, Retournac offers scenic beauty and a relaxing atmosphere, ideal for nature enthusiasts. | Château de Retournac, Scenic riverbanks, Nature trails, Local hiking groups |
| Langeac | An intriguing town with a medieval heritage, Langeac is perfect for tourists looking for historical sites and stunning landscapes. | Basilique de Langeac, Historical sites, Local cuisine, Cultural events |
| Montregard | A small commune known for its peaceful environment and natural beauty, ideal for visitors preferring a quiet stay in nature. | Scenic viewpoints, Hiking and walking paths, Local wildlife, Culinary delights |
Understanding Airbnb License Requirements & STR Laws in Val de Chaise (2025)
While Val de Chaise, Auvergne-Rhône-Alpes, France currently shows low STR regulations, specific Airbnb license requirements might still exist or change. Always verify the latest short term rental regulations and Airbnb license requirements directly with local government authorities for Val de Chaise to ensure full compliance before hosting.
(Source: AirROI data, 2025, based on 10% licensed listings)
Top Performing Airbnb Properties in Val de Chaise (2025)
Benchmark your potential! Explore examples of top-performing Airbnb properties in Val de Chaisebased on Trailing Twelve Month (TTM) revenue. Analyze their characteristics, revenue, occupancy rate, and ADR to understand what drives success in this market.

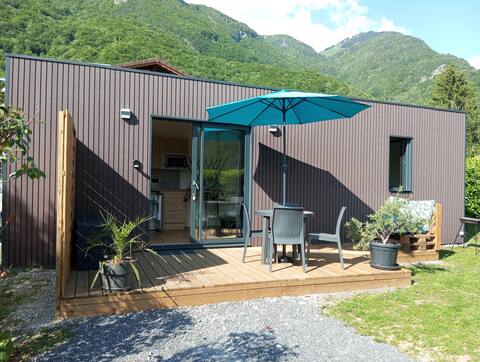
Characterful house in the heart of a village (4 cham.)
Entire Place • 4 bedrooms

Chez Gohan - lakes and mountains
Entire Place • 2 bedrooms
T2 new 2/4persons
Entire Place • 1 bedroom
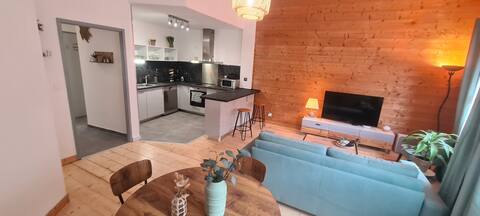
Le Bon apartment a few steps from Lake Annecy
Entire Place • 2 bedrooms
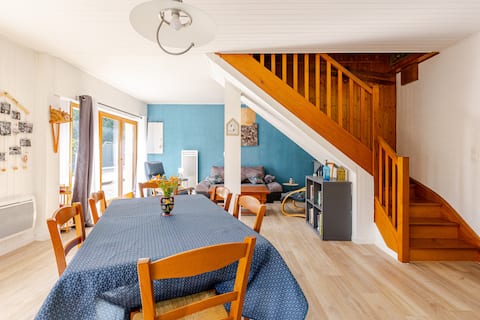
Warm house with beautiful mountain views
Entire Place • 3 bedrooms
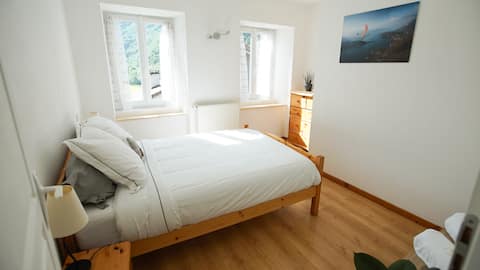
Chez Max and Nana
Entire Place • 2 bedrooms
Note: Performance varies based on location, size, amenities, seasonality, and management quality. Data reflects the past 12 months.
Top Performing Airbnb Hosts in Val de Chaise (2025)
Learn from the best! This table showcases top-performing Airbnb hosts in Val de Chaise based on the number of properties managed and estimated total revenue over the past year. Analyze their scale and performance metrics.
| Host Name | Properties | Grossing Revenue | Stay Reviews | Avg Rating |
|---|---|---|---|---|
| Yves Et Danika | 1 | $29,682 | 32 | 4.97/5.0 |
| Seb & Gohan | 1 | $28,986 | 60 | 4.82/5.0 |
| Marion | 1 | $20,660 | 13 | 4.46/5.0 |
| Jeanne | 1 | $20,453 | 16 | 4.75/5.0 |
| Christine | 1 | $18,220 | 26 | 4.96/5.0 |
| Sylvana | 1 | $17,109 | 110 | 4.94/5.0 |
| Jonathan | 1 | $16,639 | 98 | 4.94/5.0 |
| Adrien | 1 | $15,764 | 26 | 4.73/5.0 |
| Jelena | 1 | $15,046 | 114 | 4.96/5.0 |
| Aurélien | 1 | $13,350 | 3 | 4.33/5.0 |
Analyzing the strategies of top hosts, such as their property selection, pricing, and guest communication, can offer valuable lessons for optimizing your own Airbnb operations in Val de Chaise.
Dive Deeper: Advanced Val de Chaise STR Market Data (2025)
Ready to unlock more insights? AirROI provides access to advanced metrics and comprehensive Airbnb data for Val de Chaise. Explore detailed analytics beyond this report to refine your investment strategy, optimize pricing, and maximize your vacation rental profits.
Explore Advanced MetricsVal de Chaise Short-Term Rental Market Composition (2025): Property & Room Types
Room Type Distribution
Property Type Distribution
Market Composition Insights for Val de Chaise
- The Val de Chaise Airbnb market composition is heavily skewed towards Entire Home/Apt listings, which make up 95.2% of the 21 active rentals. This indicates strong guest preference for privacy and space.
- Looking at the property type distribution in Val de Chaise, Apartment/Condo properties are the most common (47.6%), reflecting the local real estate landscape.
- Houses represent a significant 47.6% portion, catering likely to families or larger groups.
- Smaller segments like hotel/boutique (combined 4.8%) offer potential for unique stay experiences.
Val de Chaise Airbnb Room Capacity Analysis (2025): Bedroom Distribution
Distribution of Listings by Number of Bedrooms
Room Capacity Insights for Val de Chaise
- The dominant room capacity in Val de Chaise is 1 bedroom listings, making up 38.1% of the market. This suggests a strong demand for properties suitable for couples or solo travelers.
- Together, 1 bedroom and 3 bedrooms properties represent 61.9% of the active Airbnb listings in Val de Chaise, indicating a high concentration in these sizes.
- A significant 33.3% of listings offer 3+ bedrooms, catering to larger groups and families seeking more space in Val de Chaise.
Val de Chaise Vacation Rental Guest Capacity Trends (2025)
Distribution of Listings by Guest Capacity
Guest Capacity Insights for Val de Chaise
- The most common guest capacity trend in Val de Chaise vacation rentals is listings accommodating 4 guests (42.9%). This suggests the primary traveler segment is likely small families or groups.
- Properties designed for 4 guests and 6 guests dominate the Val de Chaise STR market, accounting for 61.9% of listings.
- 33.3% of properties accommodate 6+ guests, serving the market segment for larger families or group travel in Val de Chaise.
- On average, properties in Val de Chaise are equipped to host 4.7 guests.
Val de Chaise Airbnb Booking Patterns (2025): Available vs. Booked Days
Available Days Distribution
Booked Days Distribution
Booking Pattern Insights for Val de Chaise
- The most common availability pattern in Val de Chaise falls within the 181-270 days range, representing 42.9% of listings. This suggests many properties have significant open periods on their calendars.
- Approximately 71.5% of listings show high availability (181+ days open annually), indicating potential for increased bookings or specific owner usage patterns.
- For booked days, the 91-180 days range is most frequent in Val de Chaise (38.1%), reflecting common guest stay durations or potential owner blocking patterns.
- A notable 33.4% of properties secure long booking periods (181+ days booked per year), highlighting successful long-term rental strategies or significant owner usage.
Val de Chaise Airbnb Minimum Stay Requirements Analysis
Distribution of Listings by Minimum Night Requirement
1 Night
3 listings
14.3% of total
2 Nights
8 listings
38.1% of total
3 Nights
4 listings
19% of total
4-6 Nights
3 listings
14.3% of total
30+ Nights
3 listings
14.3% of total
Key Insights
- The most prevalent minimum stay requirement in Val de Chaise is 2 Nights, adopted by 38.1% of listings. This highlights the market's preference for shorter, flexible bookings.
- A significant segment (14.3%) caters to monthly stays (30+ nights) in Val de Chaise, pointing to opportunities in the extended-stay market.
Recommendations
- Align with the market by considering a 2 Nights minimum stay, as 38.1% of Val de Chaise hosts use this setting.
- If feasible, allowing 1-night stays, especially midweek or during low season, could capture last-minute bookings, as only 14.3% currently do.
- A 2-night minimum appears standard (38.1%). Consider this for weekends or peak periods.
- Explore offering discounts for stays of 30+ nights to attract the 14.3% of the market seeking extended stays.
- Adjust minimum nights based on seasonality – potentially shorter during low season and longer during peak demand periods in Val de Chaise.
Val de Chaise Airbnb Cancellation Policy Trends Analysis (2025)
Flexible
5 listings
23.8% of total
Moderate
10 listings
47.6% of total
Firm
5 listings
23.8% of total
Strict
1 listings
4.8% of total
Cancellation Policy Insights for Val de Chaise
- The prevailing Airbnb cancellation policy trend in Val de Chaise is Moderate, used by 47.6% of listings.
- The market strongly favors guest-friendly terms, with 71.4% of listings offering Flexible or Moderate policies. This suggests guests in Val de Chaise may expect booking flexibility.
- Strict cancellation policies are quite rare (4.8%), potentially making listings with this policy less competitive unless justified by high demand or property type.
Recommendations for Hosts
- Consider adopting a Moderate policy to align with the 47.6% market standard in Val de Chaise.
- Using a Strict policy might deter some guests, as only 4.8% of listings use it. Evaluate if potential revenue protection outweighs possible lower booking rates.
- Regularly review your cancellation policy against competitors and market demand shifts in Val de Chaise.
Val de Chaise STR Booking Lead Time Analysis (2025)
Average Booking Lead Time by Month
Booking Lead Time Insights for Val de Chaise
- The overall average booking lead time for vacation rentals in Val de Chaise is 46 days.
- Guests book furthest in advance for stays during July (average 89 days), likely coinciding with peak travel demand or local events.
- The shortest booking windows occur for stays in November (average 16 days), indicating more last-minute travel plans during this time.
- Seasonally, Summer (78 days avg.) sees the longest lead times, while Winter (36 days avg.) has the shortest, reflecting typical travel planning cycles.
Recommendations for Hosts
- Use the overall average lead time (46 days) as a baseline for your pricing and availability strategy in Val de Chaise.
- For July stays, consider implementing length-of-stay discounts or slightly higher rates for bookings made less than 89 days out to capitalize on advance planning.
- Target marketing efforts for the Summer season well in advance (at least 78 days) to capture early planners.
- Monitor your own booking lead times against these Val de Chaise averages to identify opportunities for dynamic pricing adjustments.
Popular & Essential Airbnb Amenities in Val de Chaise (2025)
Amenity Prevalence
Amenity Insights for Val de Chaise
- Essential amenities in Val de Chaise that guests expect include: Heating, TV, Coffee maker, Hot water, Dishes and silverware, Hangers, Kitchen, Clothing storage, Refrigerator, Cooking basics. Lacking these (any) could significantly impact bookings.
Recommendations for Hosts
- Ensure your listing includes all essential amenities for Val de Chaise: Heating, TV, Coffee maker, Hot water, Dishes and silverware, Hangers, Kitchen, Clothing storage, Refrigerator, Cooking basics.
- Prioritize adding missing essentials: Dishes and silverware, Hangers, Kitchen, Clothing storage, Refrigerator, Cooking basics.
- Highlight unique or less common amenities you offer (e.g., hot tub, dedicated workspace, EV charger) in your listing description and photos.
- Regularly check competitor amenities in Val de Chaise to stay competitive.
Val de Chaise Airbnb Guest Demographics & Profile Analysis (2025)
Guest Profile Summary for Val de Chaise
- The typical guest profile for Airbnb in Val de Chaise consists of primarily domestic travelers (84%), often arriving from nearby Lyon, typically belonging to the Post-2000s (Gen Z/Alpha) group (50%), primarily speaking French or English.
- Domestic travelers account for 84.0% of guests.
- Key international markets include France (84%) and Belgium (3.3%).
- Top languages spoken are French (47.7%) followed by English (33.2%).
- A significant demographic segment is the Post-2000s (Gen Z/Alpha) group, representing 50% of guests.
Recommendations for Hosts
- Target domestic marketing efforts towards travelers from Lyon and Paris.
- Tailor amenities and listing descriptions to appeal to the dominant Post-2000s (Gen Z/Alpha) demographic (e.g., highlight fast WiFi, smart home features, local guides).
- Highlight unique local experiences or amenities relevant to the primary guest profile.
- Consider seasonal promotions aligned with peak travel times for key origin markets.
Nearby Short-Term Rental Market Comparison
How does the Val de Chaise Airbnb market stack up against its neighbors? Compare key performance metrics like average monthly revenue, ADR, and occupancy rates in surrounding areas to understand the broader regional STR landscape.
| Market | Active Properties | Monthly Revenue | Daily Rate | Avg. Occupancy |
|---|---|---|---|---|
| Lauterbrunnen | 525 | $7,079 | $546.45 | 54% |
| La Rivière-Enverse | 17 | $5,972 | $624.02 | 41% |
| Les Clefs | 30 | $5,741 | $323.11 | 44% |
| Matten bei Interlaken | 52 | $5,674 | $316.63 | 63% |
| Iseltwald | 14 | $5,491 | $331.95 | 58% |
| Habkern | 13 | $5,382 | $344.74 | 50% |
| Interlaken | 288 | $4,987 | $310.52 | 56% |
| Zermatt | 734 | $4,604 | $463.00 | 46% |
| Oberhofen am Thunersee | 24 | $4,572 | $265.94 | 55% |
| Monteu Roero | 16 | $4,432 | $540.14 | 36% |