Taulignan Airbnb Market Analysis 2025: Short Term Rental Data & Vacation Rental Statistics in Auvergne-Rhône-Alpes, France
Is Airbnb profitable in Taulignan in 2025? Explore comprehensive Airbnb analytics for Taulignan, Auvergne-Rhône-Alpes, France to uncover income potential. This 2025 STR market report for Taulignan, based on AirROI data from April 2024 to March 2025, reveals key trends in the niche market of 37 active listings.
Whether you're considering an Airbnb investment in Taulignan, optimizing your existing vacation rental, or exploring rental arbitrage opportunities, understanding the Taulignan Airbnb data is crucial. Understanding the local regulations is key to maximizing your short term rental income potential. Let's dive into the specifics.
Key Taulignan Airbnb Performance Metrics Overview
Monthly Airbnb Revenue Variations & Income Potential in Taulignan (2025)
Understanding the monthly revenue variations for Airbnb listings in Taulignan is key to maximizing your short term rental income potential. Seasonality significantly impacts earnings. Our analysis, based on data from the past 12 months, shows that the peak revenue month for STRs in Taulignan is typically July, while February often presents the lowest earnings, highlighting opportunities for strategic pricing adjustments during shoulder and low seasons. Explore the typical Airbnb income in Taulignan across different performance tiers:
- Best-in-class properties (Top 10%) achieve $4,714+ monthly, often utilizing dynamic pricing and superior guest experiences.
- Strong performing properties (Top 25%) earn $2,544 or more, indicating effective management and desirable locations/amenities.
- Typical properties (Median) generate around $1,246 per month, representing the average market performance.
- Entry-level properties (Bottom 25%) see earnings around $606, often with potential for optimization.
Average Monthly Airbnb Earnings Trend in Taulignan
Taulignan Airbnb Occupancy Rate Trends (2025)
Maximize your bookings by understanding the Taulignan STR occupancy trends. Seasonal demand shifts significantly influence how often properties are booked. Typically, Augustsees the highest demand (peak season occupancy), while December experiences the lowest (low season). Effective strategies, like adjusting minimum stays or offering promotions, can boost occupancy during slower periods. Here's how different property tiers perform in Taulignan:
- Best-in-class properties (Top 10%) achieve 69%+ occupancy, indicating high desirability and potentially optimized availability.
- Strong performing properties (Top 25%) maintain 55% or higher occupancy, suggesting good market fit and guest satisfaction.
- Typical properties (Median) have an occupancy rate around 28%.
- Entry-level properties (Bottom 25%) average 16% occupancy, potentially facing higher vacancy.
Average Monthly Occupancy Rate Trend in Taulignan
Average Daily Rate (ADR) Airbnb Trends in Taulignan (2025)
Effective short term rental pricing strategy in Taulignan involves understanding monthly ADR fluctuations. The Average Daily Rate (ADR) for Airbnb in Taulignan typically peaks in July and dips lowest during January. Leveraging Airbnb dynamic pricing tools or strategies based on this seasonality can significantly boost revenue. Here's a look at the typical nightly rates achieved:
- Best-in-class properties (Top 10%) command rates of $307+ per night, often due to premium features or locations.
- Strong performing properties (Top 25%) achieve nightly rates of $212 or more.
- Typical properties (Median) charge around $126 per night.
- Entry-level properties (Bottom 25%) earn around $81 per night.
Average Daily Rate (ADR) Trend by Month in Taulignan
Get Live Taulignan Market Intelligence 👇

Explore Real-time Analytics
Airbnb Seasonality Analysis & Trends in Taulignan (2025)
Peak Season (July, August, June)
- Revenue averages $3,162 per month
- Occupancy rates average 51.0%
- Daily rates average $162
Shoulder Season
- Revenue averages $1,701 per month
- Occupancy maintains around 31.4%
- Daily rates hold near $150
Low Season (February, March, September)
- Revenue drops to average $927 per month
- Occupancy decreases to average 26.6%
- Daily rates adjust to average $149
Seasonality Insights for Taulignan
- The Airbnb seasonality in Taulignan shows highly seasonal trends requiring careful strategy. While the sections above show seasonal averages, it's also insightful to look at the extremes:
- During the high season, the absolute peak month showcases Taulignan's highest earning potential, with monthly revenues capable of climbing to $3,440, occupancy reaching a high of 59.8%, and ADRs peaking at $163.
- Conversely, the slowest single month of the year, typically falling within the low season, marks the market's lowest point. In this month, revenue might dip to $676, occupancy could drop to 24.5%, and ADRs may adjust down to $145.
- Understanding both the seasonal averages and these monthly peaks and troughs in revenue, occupancy, and ADR is crucial for maximizing your Airbnb profit potential in Taulignan.
Seasonal Strategies for Maximizing Profit
- Peak Season: Maximize revenue through premium pricing and potentially longer minimum stays. Ensure high availability.
- Low Season: Offer competitive pricing, special promotions (e.g., extended stay discounts), and flexible cancellation policies. Target off-season travelers like remote workers or budget-conscious guests.
- Shoulder Seasons: Implement dynamic pricing that balances peak and low rates. Target weekend travelers or specific events. Offer slightly more flexible terms than peak season.
- Regularly analyze your own performance against these Taulignan seasonality benchmarks and adjust your pricing and availability strategy accordingly.
Best Areas for Airbnb Investment in Taulignan (2025)
Exploring the top neighborhoods for short-term rentals in Taulignan? This section highlights key areas, outlining why they are attractive for hosts and guests, along with notable local attractions. Consider these locations based on your target guest profile and investment strategy.
| Neighborhood / Area | Why Host Here? (Target Guests & Appeal) | Key Attractions & Landmarks |
|---|---|---|
| Old Town Taulignan | Charming historical area with beautiful stone houses and a picturesque ambiance. Great for tourists who appreciate history and culture. | Taulignan village square, Church of St. Peter, Weekly market, Pottery workshops, Nearby vineyards |
| Les Dentelles de Montmirail | Stunning natural park offering breathtaking views and outdoor activities. Ideal for nature lovers and hikers looking to explore the surroundings. | Hiking trails, Scenic viewpoints, Vineyards, Local wildlife, Wine tasting tours |
| Grignan | Famous for its Renaissance château and vibrant cultural scene. Attracts visitors interested in history and local events. | Château de Grignan, Lavender fields, Art galleries, Cultural festivals, Historical walking tours |
| Montélimar | Larger town nearby known for its nougat and vibrant markets. A convenient location for visitors needing amenities and shopping. | Nougat factories, Market of Montélimar, Historic town center, Museums, Local restaurants |
| La Garde-Adhémar | Picturesque hilltop village with lovely views and well-preserved medieval architecture. Great for tourism focused on relaxation and exploration. | Village of La Garde-Adhémar, Historical monuments, Scenic walks, Local artists, Café terraces |
| Aubenas | Lively town in the Ardèche region, offering cultural activities and proximity to natural parks. Perfect for varied tourist experiences. | Château d'Aubenas, Local markets, Outdoor sports, Cultural events, Nearby Ardèche Gorges |
| Vaison-la-Romaine | Famous for its Roman ruins and historical significance, this area attracts history buffs and cultural tourists. | Roman theater, Arch of Auguste, Medieval old town, Vineyards, Annual Roman festival |
| Nyons | Known for olive oil production and a stunning landscape. Nyons offers a unique culinary and rural tourism experience. | Olive oil mills, Old town streets, Market of Nyons, Vineyards, Views of the Drôme Provençale |
Understanding Airbnb License Requirements & STR Laws in Taulignan (2025)
With 11% of listings showing registration in 2025, understanding potential Airbnb license requirements is crucial in Taulignan. Always verify the latest short term rental regulations and Airbnb license requirements directly with local government authorities for Taulignan to ensure full compliance before hosting.
(Source: AirROI data, 2025, based on 11% licensed listings)
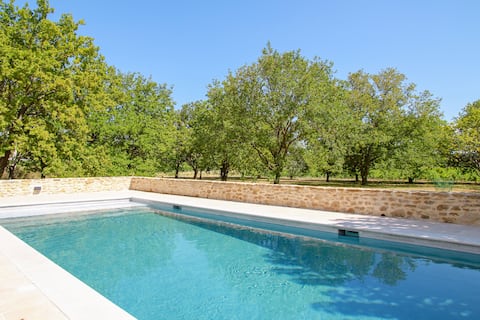
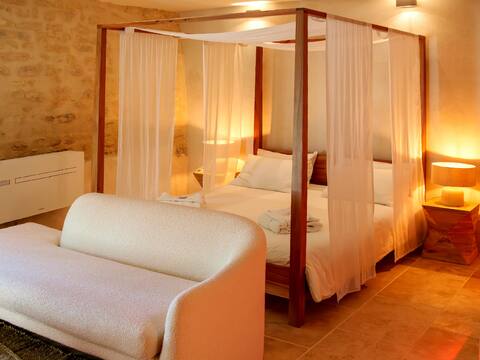
Top Performing Airbnb Properties in Taulignan (2025)
Benchmark your potential! Explore examples of top-performing Airbnb properties in Taulignanbased on Trailing Twelve Month (TTM) revenue. Analyze their characteristics, revenue, occupancy rate, and ADR to understand what drives success in this market.
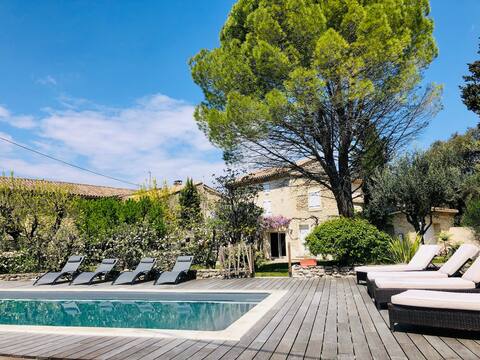
Stone house with swimming pool in Drôme provençale
Entire Place • 6 bedrooms
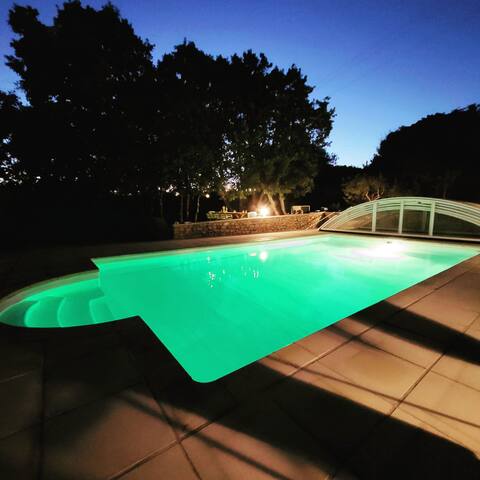
Provencal villa with heated pool May -> Sept
Entire Place • 4 bedrooms
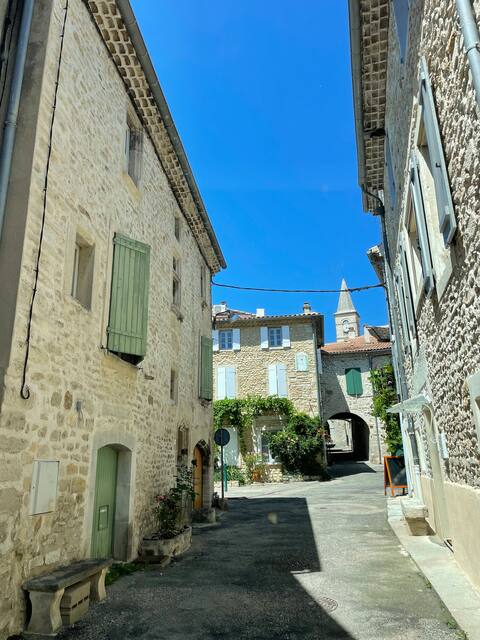
A house full of character and charm
Entire Place • 4 bedrooms
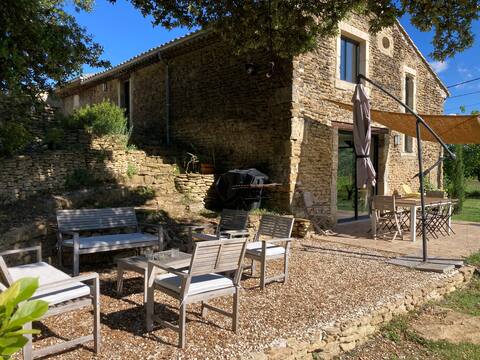
La Grange des oliviers
Entire Place • 3 bedrooms
Mas en pierre XIXe - Piscine - Très calme -Jardin
Entire Place • 2 bedrooms
L•O•V•E• •I•N Taulignan
Entire Place • 1 bedroom
Note: Performance varies based on location, size, amenities, seasonality, and management quality. Data reflects the past 12 months.
Top Performing Airbnb Hosts in Taulignan (2025)
Learn from the best! This table showcases top-performing Airbnb hosts in Taulignan based on the number of properties managed and estimated total revenue over the past year. Analyze their scale and performance metrics.
| Host Name | Properties | Grossing Revenue | Stay Reviews | Avg Rating |
|---|---|---|---|---|
| Coline | 1 | $49,937 | 10 | 4.60/5.0 |
| Jeff | 1 | $42,246 | 13 | 4.69/5.0 |
| Odile | 1 | $39,752 | 4 | 5.00/5.0 |
| Philippe | 1 | $36,385 | 24 | 5.00/5.0 |
| Host #496368951 | 1 | $33,649 | 1 | 0.00/5.0 |
| Justine | 1 | $31,966 | 153 | 4.84/5.0 |
| Dominique | 1 | $30,961 | 15 | 4.87/5.0 |
| Delphine | 2 | $30,578 | 9 | 4.88/5.0 |
| Anne | 1 | $25,891 | 29 | 4.79/5.0 |
| Sabine | 2 | $25,254 | 79 | 4.88/5.0 |
Analyzing the strategies of top hosts, such as their property selection, pricing, and guest communication, can offer valuable lessons for optimizing your own Airbnb operations in Taulignan.
Dive Deeper: Advanced Taulignan STR Market Data (2025)
Ready to unlock more insights? AirROI provides access to advanced metrics and comprehensive Airbnb data for Taulignan. Explore detailed analytics beyond this report to refine your investment strategy, optimize pricing, and maximize your vacation rental profits.
Explore Advanced MetricsTaulignan Short-Term Rental Market Composition (2025): Property & Room Types
Room Type Distribution
Property Type Distribution
Market Composition Insights for Taulignan
- The Taulignan Airbnb market composition is heavily skewed towards Entire Home/Apt listings, which make up 83.8% of the 37 active rentals. This indicates strong guest preference for privacy and space.
- Looking at the property type distribution in Taulignan, House properties are the most common (83.8%), reflecting the local real estate landscape.
- Houses represent a significant 83.8% portion, catering likely to families or larger groups.
- The presence of 5.4% Hotel/Boutique listings indicates integration with traditional hospitality.
- Smaller segments like unique stays (combined 2.7%) offer potential for unique stay experiences.
Taulignan Airbnb Room Capacity Analysis (2025): Bedroom Distribution
Distribution of Listings by Number of Bedrooms
Room Capacity Insights for Taulignan
- The dominant room capacity in Taulignan is 3 bedrooms listings, making up 32.4% of the market. This suggests a strong demand for properties suitable for families or small groups.
- Together, 3 bedrooms and 1 bedroom properties represent 56.7% of the active Airbnb listings in Taulignan, indicating a high concentration in these sizes.
- A significant 54.0% of listings offer 3+ bedrooms, catering to larger groups and families seeking more space in Taulignan.
Taulignan Vacation Rental Guest Capacity Trends (2025)
Distribution of Listings by Guest Capacity
Guest Capacity Insights for Taulignan
- The most common guest capacity trend in Taulignan vacation rentals is listings accommodating 6 guests (29.7%). This suggests the primary traveler segment is likely larger groups.
- Properties designed for 6 guests and 8+ guests dominate the Taulignan STR market, accounting for 54.0% of listings.
- 56.7% of properties accommodate 6+ guests, serving the market segment for larger families or group travel in Taulignan.
- On average, properties in Taulignan are equipped to host 4.8 guests.
Taulignan Airbnb Booking Patterns (2025): Available vs. Booked Days
Available Days Distribution
Booked Days Distribution
Booking Pattern Insights for Taulignan
- The most common availability pattern in Taulignan falls within the 271-366 days range, representing 59.5% of listings. This suggests many properties have significant open periods on their calendars.
- Approximately 91.9% of listings show high availability (181+ days open annually), indicating potential for increased bookings or specific owner usage patterns.
- For booked days, the 31-90 days range is most frequent in Taulignan (35.1%), reflecting common guest stay durations or potential owner blocking patterns.
- A notable 8.1% of properties secure long booking periods (181+ days booked per year), highlighting successful long-term rental strategies or significant owner usage.
Taulignan Airbnb Minimum Stay Requirements Analysis
Distribution of Listings by Minimum Night Requirement
1 Night
7 listings
18.9% of total
2 Nights
11 listings
29.7% of total
3 Nights
10 listings
27% of total
4-6 Nights
4 listings
10.8% of total
7-29 Nights
1 listings
2.7% of total
30+ Nights
4 listings
10.8% of total
Key Insights
- The most prevalent minimum stay requirement in Taulignan is 2 Nights, adopted by 29.7% of listings. This highlights the market's preference for shorter, flexible bookings.
- A significant segment (10.8%) caters to monthly stays (30+ nights) in Taulignan, pointing to opportunities in the extended-stay market.
Recommendations
- Align with the market by considering a 2 Nights minimum stay, as 29.7% of Taulignan hosts use this setting.
- If feasible, allowing 1-night stays, especially midweek or during low season, could capture last-minute bookings, as only 18.9% currently do.
- Explore offering discounts for stays of 30+ nights to attract the 10.8% of the market seeking extended stays.
- Adjust minimum nights based on seasonality – potentially shorter during low season and longer during peak demand periods in Taulignan.
Taulignan Airbnb Cancellation Policy Trends Analysis (2025)
Flexible
9 listings
29% of total
Moderate
3 listings
9.7% of total
Firm
11 listings
35.5% of total
Strict
8 listings
25.8% of total
Cancellation Policy Insights for Taulignan
- The prevailing Airbnb cancellation policy trend in Taulignan is Firm, used by 35.5% of listings.
- A majority (61.3%) of hosts in Taulignan utilize Firm or Strict policies, indicating a market where hosts prioritize booking security.
Recommendations for Hosts
- Consider adopting a Firm policy to align with the 35.5% market standard in Taulignan.
- Regularly review your cancellation policy against competitors and market demand shifts in Taulignan.
Taulignan STR Booking Lead Time Analysis (2025)
Average Booking Lead Time by Month
Booking Lead Time Insights for Taulignan
- The overall average booking lead time for vacation rentals in Taulignan is 71 days.
- Guests book furthest in advance for stays during June (average 137 days), likely coinciding with peak travel demand or local events.
- The shortest booking windows occur for stays in March (average 31 days), indicating more last-minute travel plans during this time.
- Seasonally, Summer (116 days avg.) sees the longest lead times, while Fall (58 days avg.) has the shortest, reflecting typical travel planning cycles.
Recommendations for Hosts
- Use the overall average lead time (71 days) as a baseline for your pricing and availability strategy in Taulignan.
- For June stays, consider implementing length-of-stay discounts or slightly higher rates for bookings made less than 137 days out to capitalize on advance planning.
- Target marketing efforts for the Summer season well in advance (at least 116 days) to capture early planners.
- Monitor your own booking lead times against these Taulignan averages to identify opportunities for dynamic pricing adjustments.
Popular & Essential Airbnb Amenities in Taulignan (2025)
Amenity Prevalence
Amenity Insights for Taulignan
- Popular amenities like Heating, Essentials, Hangers are common but not universal. Offering these can provide a competitive edge.
- Warning: Wifi is not universally provided but is considered essential globally. Ensure reliable Wifi is offered.
Recommendations for Hosts
- Consider adding popular differentiators like Heating or Essentials to increase appeal.
- Highlight unique or less common amenities you offer (e.g., hot tub, dedicated workspace, EV charger) in your listing description and photos.
- Regularly check competitor amenities in Taulignan to stay competitive.
Taulignan Airbnb Guest Demographics & Profile Analysis (2025)
Guest Profile Summary for Taulignan
- The typical guest profile for Airbnb in Taulignan consists of primarily domestic travelers (82%), often arriving from nearby Lyon, typically belonging to the Post-2000s (Gen Z/Alpha) group (50%), primarily speaking French or English.
- Domestic travelers account for 82.3% of guests.
- Key international markets include France (82.3%) and Belgium (3.9%).
- Top languages spoken are French (45.3%) followed by English (34.2%).
- A significant demographic segment is the Post-2000s (Gen Z/Alpha) group, representing 50% of guests.
Recommendations for Hosts
- Target domestic marketing efforts towards travelers from Lyon and Paris.
- Tailor amenities and listing descriptions to appeal to the dominant Post-2000s (Gen Z/Alpha) demographic (e.g., highlight fast WiFi, smart home features, local guides).
- Highlight unique local experiences or amenities relevant to the primary guest profile.
- Consider seasonal promotions aligned with peak travel times for key origin markets.
Nearby Short-Term Rental Market Comparison
How does the Taulignan Airbnb market stack up against its neighbors? Compare key performance metrics like average monthly revenue, ADR, and occupancy rates in surrounding areas to understand the broader regional STR landscape.
| Market | Active Properties | Monthly Revenue | Daily Rate | Avg. Occupancy |
|---|---|---|---|---|
| Villeneuvette | 13 | $4,150 | $337.56 | 44% |
| Divajeu | 19 | $3,941 | $410.65 | 42% |
| Saint-Germain-au-Mont-d'Or | 10 | $3,928 | $316.02 | 40% |
| Dommartin | 11 | $3,905 | $327.00 | 36% |
| Courzieu | 11 | $3,267 | $287.83 | 52% |
| Vanosc | 13 | $3,072 | $224.52 | 44% |
| Chantepérier | 20 | $3,057 | $281.60 | 37% |
| Gordes | 225 | $2,913 | $366.32 | 43% |
| Redessan | 19 | $2,834 | $334.82 | 34% |
| Fontarèches | 11 | $2,802 | $525.31 | 34% |