Rive-de-Gier Airbnb Market Analysis 2025: Short Term Rental Data & Vacation Rental Statistics in Auvergne-Rhône-Alpes, France
Is Airbnb profitable in Rive-de-Gier in 2025? Explore comprehensive Airbnb analytics for Rive-de-Gier, Auvergne-Rhône-Alpes, France to uncover income potential. This 2025 STR market report for Rive-de-Gier, based on AirROI data from April 2024 to March 2025, reveals key trends in the niche market of 21 active listings.
Whether you're considering an Airbnb investment in Rive-de-Gier, optimizing your existing vacation rental, or exploring rental arbitrage opportunities, understanding the Rive-de-Gier Airbnb data is crucial. Leveraging the low regulation environment is key to maximizing your short term rental income potential. Let's dive into the specifics.
Key Rive-de-Gier Airbnb Performance Metrics Overview
Monthly Airbnb Revenue Variations & Income Potential in Rive-de-Gier (2025)
Understanding the monthly revenue variations for Airbnb listings in Rive-de-Gier is key to maximizing your short term rental income potential. Seasonality significantly impacts earnings. Our analysis, based on data from the past 12 months, shows that the peak revenue month for STRs in Rive-de-Gier is typically June, while January often presents the lowest earnings, highlighting opportunities for strategic pricing adjustments during shoulder and low seasons. Explore the typical Airbnb income in Rive-de-Gier across different performance tiers:
- Best-in-class properties (Top 10%) achieve $2,311+ monthly, often utilizing dynamic pricing and superior guest experiences.
- Strong performing properties (Top 25%) earn $1,749 or more, indicating effective management and desirable locations/amenities.
- Typical properties (Median) generate around $996 per month, representing the average market performance.
- Entry-level properties (Bottom 25%) see earnings around $578, often with potential for optimization.
Average Monthly Airbnb Earnings Trend in Rive-de-Gier
Rive-de-Gier Airbnb Occupancy Rate Trends (2025)
Maximize your bookings by understanding the Rive-de-Gier STR occupancy trends. Seasonal demand shifts significantly influence how often properties are booked. Typically, Novembersees the highest demand (peak season occupancy), while January experiences the lowest (low season). Effective strategies, like adjusting minimum stays or offering promotions, can boost occupancy during slower periods. Here's how different property tiers perform in Rive-de-Gier:
- Best-in-class properties (Top 10%) achieve 80%+ occupancy, indicating high desirability and potentially optimized availability.
- Strong performing properties (Top 25%) maintain 66% or higher occupancy, suggesting good market fit and guest satisfaction.
- Typical properties (Median) have an occupancy rate around 43%.
- Entry-level properties (Bottom 25%) average 24% occupancy, potentially facing higher vacancy.
Average Monthly Occupancy Rate Trend in Rive-de-Gier
Average Daily Rate (ADR) Airbnb Trends in Rive-de-Gier (2025)
Effective short term rental pricing strategy in Rive-de-Gier involves understanding monthly ADR fluctuations. The Average Daily Rate (ADR) for Airbnb in Rive-de-Gier typically peaks in July and dips lowest during March. Leveraging Airbnb dynamic pricing tools or strategies based on this seasonality can significantly boost revenue. Here's a look at the typical nightly rates achieved:
- Best-in-class properties (Top 10%) command rates of $154+ per night, often due to premium features or locations.
- Strong performing properties (Top 25%) achieve nightly rates of $87 or more.
- Typical properties (Median) charge around $55 per night.
- Entry-level properties (Bottom 25%) earn around $45 per night.
Average Daily Rate (ADR) Trend by Month in Rive-de-Gier
Get Live Rive-de-Gier Market Intelligence 👇

Explore Real-time Analytics
Airbnb Seasonality Analysis & Trends in Rive-de-Gier (2025)
Peak Season (June, April, August)
- Revenue averages $1,723 per month
- Occupancy rates average 47.2%
- Daily rates average $85
Shoulder Season
- Revenue averages $1,228 per month
- Occupancy maintains around 47.0%
- Daily rates hold near $81
Low Season (January, February, March)
- Revenue drops to average $757 per month
- Occupancy decreases to average 39.1%
- Daily rates adjust to average $65
Seasonality Insights for Rive-de-Gier
- The Airbnb seasonality in Rive-de-Gier shows highly seasonal trends requiring careful strategy. While the sections above show seasonal averages, it's also insightful to look at the extremes:
- During the high season, the absolute peak month showcases Rive-de-Gier's highest earning potential, with monthly revenues capable of climbing to $1,881, occupancy reaching a high of 56.0%, and ADRs peaking at $87.
- Conversely, the slowest single month of the year, typically falling within the low season, marks the market's lowest point. In this month, revenue might dip to $698, occupancy could drop to 36.4%, and ADRs may adjust down to $63.
- Understanding both the seasonal averages and these monthly peaks and troughs in revenue, occupancy, and ADR is crucial for maximizing your Airbnb profit potential in Rive-de-Gier.
Seasonal Strategies for Maximizing Profit
- Peak Season: Maximize revenue through premium pricing and potentially longer minimum stays. Ensure high availability.
- Low Season: Offer competitive pricing, special promotions (e.g., extended stay discounts), and flexible cancellation policies. Target off-season travelers like remote workers or budget-conscious guests.
- Shoulder Seasons: Implement dynamic pricing that balances peak and low rates. Target weekend travelers or specific events. Offer slightly more flexible terms than peak season.
- Regularly analyze your own performance against these Rive-de-Gier seasonality benchmarks and adjust your pricing and availability strategy accordingly.
Best Areas for Airbnb Investment in Rive-de-Gier (2025)
Exploring the top neighborhoods for short-term rentals in Rive-de-Gier? This section highlights key areas, outlining why they are attractive for hosts and guests, along with notable local attractions. Consider these locations based on your target guest profile and investment strategy.
| Neighborhood / Area | Why Host Here? (Target Guests & Appeal) | Key Attractions & Landmarks |
|---|---|---|
| Centre Ville | The city center of Rive-de-Gier features classic French architecture and is close to local shops, restaurants, and the train station, making it convenient for visitors. | Église Saint-Romain, Place de la Liberté, Le Parc de l'Église, local markets, Cinéma le Noir et Blanc |
| Parc de la Roche | A spacious park that offers outdoor activities and is a popular spot for families and nature lovers, making it ideal for a peaceful stay. | Walking trails, Play areas for children, Picnic spots, Scenic views, Local wildlife |
| La Vallée du Gier | A picturesque valley that attracts outdoor enthusiasts with hiking trails and scenic views, ideal for nature retreats. | Hiking and biking trails, Beautiful landscapes, Outdoor recreation, Nearby villages, Gier River |
| Les Minguettes | A vibrant neighborhood with multicultural influences, offering unique experiences and local cuisine, appealing to adventurous travelers. | Local restaurants, Cultural festivals, Street art, Market days, Community events |
| Saint-Chamond | Nearby town known for its historical significance and amenities, offering alternative accommodation options for visitors to the region. | Musee de la Mine, Historical architecture, Great dining options, Parks and leisure areas, Local shopping |
| La Côte | The hillside area with beautiful views of the surroundings, popular with those looking for tranquility and natural beauty. | Viewpoints, Nature walks, Wine tasting, Local vineyards, Historical sites |
| Givors | A neighboring town with rich history and access to various cultural spots, suitable for guests wanting to explore more of the region. | Château de Givors, Local museums, Cultural venues, Shopping centers, Public parks |
| Chavagneux | A quiet village atmosphere, providing a relaxing retreat for tourists seeking a break from the hustle of bigger towns, with access to local markets. | Village market, Traditional architecture, Natural beauty, Cultural heritage, Local festivals |
Understanding Airbnb License Requirements & STR Laws in Rive-de-Gier (2025)
While Rive-de-Gier, Auvergne-Rhône-Alpes, France currently shows low STR regulations, specific Airbnb license requirements might still exist or change. Always verify the latest short term rental regulations and Airbnb license requirements directly with local government authorities for Rive-de-Gier to ensure full compliance before hosting.
(Source: AirROI data, 2025, finding no licensed listings among those analyzed)
Top Performing Airbnb Properties in Rive-de-Gier (2025)
Benchmark your potential! Explore examples of top-performing Airbnb properties in Rive-de-Gierbased on Trailing Twelve Month (TTM) revenue. Analyze their characteristics, revenue, occupancy rate, and ADR to understand what drives success in this market.
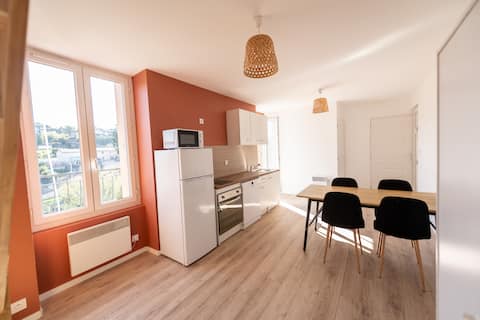
Kasa ǐǐǐǐǐ- Air conditioning - Exterior
Entire Place • 3 bedrooms

ǐǐ ǐǐǐ ǐǐ ǐ- Private parking - Fully equipped
Entire Place • 1 bedroom

La Micale - Great outdoor spaces - Quiet
Entire Place • 2 bedrooms

love room le belka
Entire Place • 1 bedroom
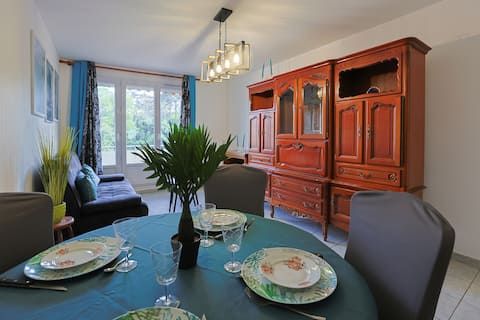
Light & Space: Lyon and Pilat at your Scope
Entire Place • 2 bedrooms

Contemporary home
Entire Place • 1 bedroom
Note: Performance varies based on location, size, amenities, seasonality, and management quality. Data reflects the past 12 months.
Top Performing Airbnb Hosts in Rive-de-Gier (2025)
Learn from the best! This table showcases top-performing Airbnb hosts in Rive-de-Gier based on the number of properties managed and estimated total revenue over the past year. Analyze their scale and performance metrics.
| Host Name | Properties | Grossing Revenue | Stay Reviews | Avg Rating |
|---|---|---|---|---|
| Audrey | 4 | $73,949 | 99 | 4.79/5.0 |
| Fadlaoui | 3 | $19,824 | 36 | 3.00/5.0 |
| Jean Paul | 1 | $17,838 | 14 | 4.79/5.0 |
| Mansouria | 1 | $16,968 | 10 | 4.90/5.0 |
| Perrine | 1 | $16,865 | 16 | 4.50/5.0 |
| Kévin | 1 | $15,388 | 8 | 4.88/5.0 |
| Julie | 1 | $14,977 | 81 | 4.94/5.0 |
| Léa | 1 | $13,294 | 24 | 4.92/5.0 |
| Jean Laurent | 1 | $12,976 | 120 | 4.73/5.0 |
| Gaétan | 1 | $9,780 | 127 | 4.55/5.0 |
Analyzing the strategies of top hosts, such as their property selection, pricing, and guest communication, can offer valuable lessons for optimizing your own Airbnb operations in Rive-de-Gier.
Dive Deeper: Advanced Rive-de-Gier STR Market Data (2025)
Ready to unlock more insights? AirROI provides access to advanced metrics and comprehensive Airbnb data for Rive-de-Gier. Explore detailed analytics beyond this report to refine your investment strategy, optimize pricing, and maximize your vacation rental profits.
Explore Advanced MetricsRive-de-Gier Short-Term Rental Market Composition (2025): Property & Room Types
Room Type Distribution
Property Type Distribution
Market Composition Insights for Rive-de-Gier
- The Rive-de-Gier Airbnb market composition is heavily skewed towards Entire Home/Apt listings, which make up 90.5% of the 21 active rentals. This indicates strong guest preference for privacy and space.
- Looking at the property type distribution in Rive-de-Gier, Apartment/Condo properties are the most common (57.1%), reflecting the local real estate landscape.
- Houses represent a significant 42.9% portion, catering likely to families or larger groups.
Rive-de-Gier Airbnb Room Capacity Analysis (2025): Bedroom Distribution
Distribution of Listings by Number of Bedrooms
Room Capacity Insights for Rive-de-Gier
- The dominant room capacity in Rive-de-Gier is 1 bedroom listings, making up 52.4% of the market. This suggests a strong demand for properties suitable for couples or solo travelers.
- Together, 1 bedroom and 2 bedrooms properties represent 85.7% of the active Airbnb listings in Rive-de-Gier, indicating a high concentration in these sizes.
- With over half the market (52.4%) consisting of studios or 1-bedroom units, Rive-de-Gier is particularly well-suited for individuals or couples.
- Listings with 3+ bedrooms (9.5%) represent a smaller niche, potentially indicating an underserved market for larger group accommodations in Rive-de-Gier.
Rive-de-Gier Vacation Rental Guest Capacity Trends (2025)
Distribution of Listings by Guest Capacity
Guest Capacity Insights for Rive-de-Gier
- The most common guest capacity trend in Rive-de-Gier vacation rentals is listings accommodating 4 guests (47.6%). This suggests the primary traveler segment is likely small families or groups.
- Properties designed for 4 guests and 6 guests dominate the Rive-de-Gier STR market, accounting for 66.6% of listings.
- 23.8% of properties accommodate 6+ guests, serving the market segment for larger families or group travel in Rive-de-Gier.
- On average, properties in Rive-de-Gier are equipped to host 4.0 guests.
Rive-de-Gier Airbnb Booking Patterns (2025): Available vs. Booked Days
Available Days Distribution
Booked Days Distribution
Booking Pattern Insights for Rive-de-Gier
- The most common availability pattern in Rive-de-Gier falls within the 91-180 days range, representing 33.3% of listings. This suggests many properties have significant open periods on their calendars.
- Approximately 61.9% of listings show high availability (181+ days open annually), indicating potential for increased bookings or specific owner usage patterns.
- For booked days, the 91-180 days range is most frequent in Rive-de-Gier (47.6%), reflecting common guest stay durations or potential owner blocking patterns.
- A notable 38.1% of properties secure long booking periods (181+ days booked per year), highlighting successful long-term rental strategies or significant owner usage.
Rive-de-Gier Airbnb Minimum Stay Requirements Analysis
Distribution of Listings by Minimum Night Requirement
1 Night
11 listings
52.4% of total
2 Nights
7 listings
33.3% of total
3 Nights
2 listings
9.5% of total
30+ Nights
1 listings
4.8% of total
Key Insights
- The most prevalent minimum stay requirement in Rive-de-Gier is 1 Night, adopted by 52.4% of listings. This highlights the market's preference for shorter, flexible bookings.
- A strong majority (85.7%) of the Rive-de-Gier Airbnb data shows acceptance of very short stays (1-2 nights), indicating a dynamic, high-turnover market.
Recommendations
- Align with the market by considering a 1 Night minimum stay, as 52.4% of Rive-de-Gier hosts use this setting.
- Adjust minimum nights based on seasonality – potentially shorter during low season and longer during peak demand periods in Rive-de-Gier.
Rive-de-Gier Airbnb Cancellation Policy Trends Analysis (2025)
Flexible
9 listings
47.4% of total
Moderate
8 listings
42.1% of total
Strict
2 listings
10.5% of total
Cancellation Policy Insights for Rive-de-Gier
- The prevailing Airbnb cancellation policy trend in Rive-de-Gier is Flexible, used by 47.4% of listings.
- The market strongly favors guest-friendly terms, with 89.5% of listings offering Flexible or Moderate policies. This suggests guests in Rive-de-Gier may expect booking flexibility.
Recommendations for Hosts
- Consider adopting a Flexible policy to align with the 47.4% market standard in Rive-de-Gier.
- Using a Strict policy might deter some guests, as only 10.5% of listings use it. Evaluate if potential revenue protection outweighs possible lower booking rates.
- Regularly review your cancellation policy against competitors and market demand shifts in Rive-de-Gier.
Rive-de-Gier STR Booking Lead Time Analysis (2025)
Average Booking Lead Time by Month
Booking Lead Time Insights for Rive-de-Gier
- The overall average booking lead time for vacation rentals in Rive-de-Gier is 32 days.
- Guests book furthest in advance for stays during April (average 81 days), likely coinciding with peak travel demand or local events.
- The shortest booking windows occur for stays in March (average 16 days), indicating more last-minute travel plans during this time.
- Seasonally, Summer (59 days avg.) sees the longest lead times, while Winter (20 days avg.) has the shortest, reflecting typical travel planning cycles.
Recommendations for Hosts
- Use the overall average lead time (32 days) as a baseline for your pricing and availability strategy in Rive-de-Gier.
- For April stays, consider implementing length-of-stay discounts or slightly higher rates for bookings made less than 81 days out to capitalize on advance planning.
- Target marketing efforts for the Summer season well in advance (at least 59 days) to capture early planners.
- Monitor your own booking lead times against these Rive-de-Gier averages to identify opportunities for dynamic pricing adjustments.
Popular & Essential Airbnb Amenities in Rive-de-Gier (2025)
Amenity Prevalence
Amenity Insights for Rive-de-Gier
- Essential amenities in Rive-de-Gier that guests expect include: Wifi, Kitchen, Heating, Bed linens, Dishes and silverware. Lacking these (any) could significantly impact bookings.
- Popular amenities like Hot water, Cooking basics, TV are common but not universal. Offering these can provide a competitive edge.
Recommendations for Hosts
- Ensure your listing includes all essential amenities for Rive-de-Gier: Wifi, Kitchen, Heating, Bed linens, Dishes and silverware.
- Prioritize adding missing essentials: Kitchen, Heating, Bed linens, Dishes and silverware.
- Consider adding popular differentiators like Hot water or Cooking basics to increase appeal.
- Highlight unique or less common amenities you offer (e.g., hot tub, dedicated workspace, EV charger) in your listing description and photos.
- Regularly check competitor amenities in Rive-de-Gier to stay competitive.
Rive-de-Gier Airbnb Guest Demographics & Profile Analysis (2025)
Guest Profile Summary for Rive-de-Gier
- The typical guest profile for Airbnb in Rive-de-Gier consists of primarily domestic travelers (91%), often arriving from nearby Lyon, typically belonging to the Post-2000s (Gen Z/Alpha) group (50%), primarily speaking French or English.
- Domestic travelers account for 90.8% of guests.
- Key international markets include France (90.8%) and Netherlands (3.7%).
- Top languages spoken are French (47.7%) followed by English (27.3%).
- A significant demographic segment is the Post-2000s (Gen Z/Alpha) group, representing 50% of guests.
Recommendations for Hosts
- Target domestic marketing efforts towards travelers from Lyon and Paris.
- Tailor amenities and listing descriptions to appeal to the dominant Post-2000s (Gen Z/Alpha) demographic (e.g., highlight fast WiFi, smart home features, local guides).
- Highlight unique local experiences or amenities relevant to the primary guest profile.
- Consider seasonal promotions aligned with peak travel times for key origin markets.
Nearby Short-Term Rental Market Comparison
How does the Rive-de-Gier Airbnb market stack up against its neighbors? Compare key performance metrics like average monthly revenue, ADR, and occupancy rates in surrounding areas to understand the broader regional STR landscape.
| Market | Active Properties | Monthly Revenue | Daily Rate | Avg. Occupancy |
|---|---|---|---|---|
| Épinac | 14 | $5,147 | $333.01 | 37% |
| Divajeu | 19 | $3,941 | $410.65 | 42% |
| Saint-Germain-au-Mont-d'Or | 10 | $3,928 | $316.02 | 40% |
| Puligny-Montrachet | 11 | $3,908 | $398.00 | 44% |
| Dommartin | 11 | $3,905 | $327.00 | 36% |
| Juliénas | 11 | $3,378 | $292.32 | 46% |
| Courzieu | 11 | $3,267 | $287.83 | 52% |
| Vanosc | 13 | $3,072 | $224.52 | 44% |
| Chantepérier | 20 | $3,057 | $281.60 | 37% |
| Bligny-lès-Beaune | 24 | $2,930 | $233.89 | 44% |